

Abstract
Culture of isolated rodent islets is widely used in diabetes research to assess different endpoints, including outcomes requiring histochemical staining. As islet yields during isolation are limited, we determined the number of islets required to obtain reliable data by histology. We found that mean values for insulin-positive β-cell area/islet area, thioflavin S-positive amyloid area/islet area and β-cell apoptosis do not vary markedly when more than 30 islets are examined. Measurement variability declines as more islets are quantified, so that the variability of the coefficient of variation (CV) in human islet amyloid polypeptide (hIAPP) transgenic islets for β-cell area/islet area, amyloid area/islet area and β-cell apoptosis are 13.20% ± 1.52%, 10.03% ± 1.76% and 6.78% ± 1.53%, respectively (non-transgenic: 7.65% ± 1.17% β-cell area/islet area and 8.93% ± 1.56% β-cell apoptosis). Increasing the number of islets beyond 30 had marginal effects on the CV. Using 30 islets, 6 hIAPP-transgenic preparations are required to detect treatment effects of 14% for β-cell area/islet area, 30% for amyloid area/islet area and 23% for β-cell apoptosis (non-transgenic: 9% for β-cell area/islet area and 45% for β-cell apoptosis). This information will be of value in the design of studies using isolated islets to examine β cells and islet amyloid.
Keywords: amyloid, apoptosis, β cell, histology, insulin, islet isolation, immunohistochemistry, pancreatic islet, staining
Introduction
About 1% to 2% of the pancreatic mass consists of islets of Langerhans (Orci et al. 1976; Brissova et al. 2005), which produce and secrete the major endocrine hormones that regulate blood glucose levels. Studying islets and their secretory products is a major area of diabetes research, as islet dysfunction is involved in both predominant forms of diabetes. Type 1 diabetes is characterized by autoimmune destruction of insulin producing β cells (Nerup et al. 1974; Klöppel et al. 1984; Foulis et al. 1986) and type 2 diabetes by a failure of these cells to meet increased secretory demand for insulin and a loss of β-cell mass (Bagdade et al. 1967; Maclean et al. 1955; Kloppel et al. 1985; Kahn et al. 1993). This loss of β cells in type 2 diabetes is caused in part by the deposition of islet amyloid, resulting in an increase in β-cell apoptosis (Jurgens et al. 2011). Although many attempts have been made to develop cell lines to study islet endocrine cell function (Hohmeier and Newgard 2004), none are able to fully replicate primary islets, as their anatomy is different and their phenotypic characteristics frequently change with passage (Gleason et al. 2000). This is especially the case when wanting to assess the effect of insults such as cytokines or islet amyloid on the number of β cells, which is frequently assessed by immunohistochemical methods.
The primary constituent of islet amyloid deposits observed in type 2 diabetes in humans is islet amyloid polypeptide (IAPP). Unlike human IAPP (hIAPP), rodent IAPP does not aggregate into fibrils (Westermark et al. 1990), and therefore several transgenic models have been developed that express amyloidogenic human IAPP in their β cells (Hoppener et al. 1993; Janson et al. 1996; Verchere et al. 1996; Westermark et al. 2000; Hiddinga et al. 2012). Isolated islets from hIAPP transgenic mice can be cultured in high glucose, a condition that leads to pronounced amyloid deposition in a time- and dose-dependent manner (MacArthur et al. 1999; Zraika et al. 2007). A common endpoint in these in vitro studies is the measurement of the degree of islet amyloid deposition (amyloid area relative to islet area), which can be assessed by histological staining with thioflavin S (Schwartz 1970) and the proportion of islet area occupied by β cells determined using insulin staining (Zraika et al. 2007).
Aside from these histochemical measurements, a number of other non-histochemical assessments may need to be performed on isolated islets following experimental manipulation. These require varying numbers of islets and are frequently limited by the yield of islets from a single donor, which is dependent on the age and strain of the donor animal as well as the experience of the individual performing the isolation procedure. Under optimal conditions, 150 to 500 islets can be isolated from a single mouse (Li et al. 2009). Given these limitations and the goal to obtain a number of other non-histochemical measurements from a single experiment, we sought to determine the minimum number of islets required to obtain reliable histology-based assessments of islet parameters. Our findings provide insight into how many islets should be analyzed for β-cell and amyloid areas and for rates of β-cell apoptosis for use as primary endpoint measurements in in vitro studies of isolated islets. Additionally, considering different effect sizes, we calculated the necessary number of replicates needed to determine statistically significant changes in β-cell and amyloid areas as well as rates of β-cell apoptosis.
Materials & Methods
Mice
Hemizygous transgenic mice with β-cell expression of hIAPP (Verchere et al. 1996) on an F1 C57BL/6×DBA/2 background and humanized IAPP mice in which endogenous murine IAPP was genetically replaced by hIAPP (Hiddinga et al. 2012) on a C57BL/6 background as well as non-transgenic control mice on a F1 C57BL/6×DBA/2 background were used as islet donors. The Institutional Animal Care and Use Committee at VA Puget Sound Health Care System approved the use of animals for these studies.
Islet Isolation and Culture
Islets were isolated from the pancreata of 10-week-old male and female mice by collagenase digestion, purified by gradient separation and hand picked. They were recovered overnight in RPMI-1640 medium (Life Technologies; Carlsbad, CA) containing 10% fetal bovine serum, 1% sodium pyruvate, 1% penicillin/streptomycin and 11.1 mM glucose and then cultured for 48–144 hr in RPMI-1640 containing 10% fetal bovine serum, 1% sodium pyruvate, 1% penicillin/streptomycin and 11.1 or 16.7 mM glucose.
Histological Assessment of Islet Area, β-cell Area, Amyloid Area and β-cell Apoptosis
Islets were fixed in 10% neutral buffered formalin for 30 min, resuspended in agar, refixed in neutral buffered formalin for 3 hr, embedded in paraffin and processed for histology. Ten-µm sections were cut through the whole islet pellet. Sections, 100 µm apart, were mounted on slides; this distance was chosen to avoid making measurements twice on the same islet. β cells were identified by staining with an antiserum against insulin (20 µg/ml; clone K36AC10; Sigma-Aldrich, St. Louis, MO) for 18 hr, followed by a 1-hr incubation with secondary antisera (5.6 µg/ml; Jackson ImmunoResearch, West Grove, PA) conjugated with indocarbocyanine (Cy3). Replacement of the primary antibody with an isotype control abolished the signal. Amyloid and nuclei were visualized by counterstaining with thioflavin S (0.5% g/v; Sigma-Aldrich) and Hoechst 33258 (2 µg/ml; Sigma-Aldrich), respectively. No thioflavin S-positive staining was detected in non-transgenic mice, which is in keeping with these mice never developing islet amyloid, as their IAPP sequence is non-amyloidogenic (Westermark et al. 1990). For β-cell apoptosis, sections were stained with propidium iodide (9 µg/ml; Invitrogen, Grand Island, NY) for 30 min and counterstained with an antiserum against insulin, as described above. Specimens from one agar pellet are referred to as an islet preparation for the purpose of this manuscript. Figure 1A provides a schematic overview of this process.
Figure 1.

(A) Diagram of islet sample preparation, staining and analysis from a single islet preparation. Cultured islets (illustrated as red dots) were embedded in agar and cut in 10-µm sections. Sections, 100-µm apart (e.g., as shown in this example: sections 1, 11 and 21), were mounted on a slide and stained with an antiserum against insulin followed by thioflavin S or propidium iodide staining. All islets in a section were identified and designated with a unique number (e.g., as shown in this example: islet numbers 1 to 8 on section 1; 9 to 15 on section 11; 16 to 18 on section 21) and analyzed. The results were used to calculate the values of interest. (B) Schematic representation of the approach to quantifying measures using islet increments of 10 and 20 in a single islet preparation that contained 35 islets.
Computerized Fluorescence Microscopy
Total islet, β-cell and amyloid areas were calculated using a computer-based quantitative method described in detail previously (Wang et al. 2001). Briefly, sections were magnified 200-fold with a fluorescence microscope (Eclipse E800; Nikon, Japan) and insulin- and thioflavin S-positive images were captured with a camera (Retiga 1300; QImaging, Surrey, Canada) using the appropriate filters. These images were projected on to a computer screen to allow for area quantification. Islets were outlined in the image obtained using the amyloid filter (FITC) and this outline was kept as the filter was changed in order to visualize β cells (TRITC) and nuclei (DAPI). Image-Pro Plus 6.1 (Media Cybernetics; Rockville, MD) was used to manually set the density threshold of a pseudocolor so that the highlighted area coincided with the fluorescent area in the microscope. Areas were calculated by the software and processed for further analysis.
Calculations and Data Analysis
For the analysis of β-cell area/islet area and amyloid area/islet area, a total of 35 mice were used, comprising 23 mice (13 transgenic and 10 non-transgenic) for the descriptive statistics and 12 mice (6 transgenic and 6 non-transgenic) for sample size calculations. For β-cell apoptosis, a total of 30 mice were used, with data from 18 mice (12 transgenic and 6 non-transgenic) used for the descriptive statistics and data from 12 mice (6 transgenic and 6 non-transgenic) for sample size calculations. The same islet preparations were used for the sample size calculations for all three measurements.
The results of the microscopic assessments were used to calculate islet, β-cell and amyloid areas. Islet area was used to normalize β-cell area (Σβ-cell area/Σislet area × 100) and amyloid area (Σamyloid area/Σislet area × 100).
Data obtained from measurements made on each islet preparation were used to determine the mean and SD for the individual parameters for each preparation. This evaluation was done in increments of 10 (10, 20, 30, 40, 50, 60, 70, 80 or 90) islets. Moving averages of the different area measurements were then determined as illustrated in Figure 1B. For example, for the 10-islet increment, ∑β-cell area of islets #1–10 was divided by ∑islet area of islets #1–10, followed by the same procedure for the second group (islets # 2–11), followed similarly for the third group (islets # 3–12), and so on until all the islets had been quantified. This process was repeated similarly for amyloid area and the rate of β-cell apoptosis. The coefficient of variation (CV) of each group of islets within an increment group was calculated by dividing its standard deviation by its mean. For the purpose of this manuscript, the CVs obtained from increment group “i” is abbreviated as CIi (where “i”=10, 20, 30, 40, 50, 60, 70, 80 or 90).
Data from five investigators were evaluated. Each investigator’s data set comprised three to six islet preparations. Islet preparations with the greatest number of islets were used to determine the moving averages.
Analyses were performed using Excel version 14 (Microsoft; Redmond, WA) and GraphPad Prism version 5 (GraphPad Software; San Diego, CA). An unpaired t-test was used to determine differences in the CV when evaluating different numbers of islets and the p-value was adjusted for multiple comparisons using Bonferroni’s correction. Data are reported as mean ± SEM unless otherwise specified. A p<0.05 was considered significant.
To calculate the sample sizes needed to detect an expected treatment effect (effect size), we used data from a study in which hIAPP transgenic and non-transgenic mouse islets were cultured in 16.7 mM glucose for 144 hr (n=6 independent experiments per genotype). Sample sizes were determined to provide 80% power to detect a broad range of treatment effects. These calculations were made based on the mean and SD within an islet increment group when quantifying 20, 30 or 40 islets per preparation using the program GraphPad StatMate version 2 (GraphPad Software).
Results
Characteristics of the Islet Preparations
The number of islets in the 19 transgenic and 16 non-transgenic islet preparations used for the analyses of β-cell and amyloid areas ranged from 31 to 98. For the measures of β-cell apoptosis, the number of islets in the 18 transgenic and 12 non-transgenic islet preparations ranged from 21 to 56. Examples of typical islets with varying amounts of insulin and amyloid staining are shown in Figure 2, as is an islet with positive staining for β-cell apoptosis. The mean islet area in these 65 preparations was 13,398 ± 194 μm2. β-cell area/islet area varied widely from 35.8% to 76.9%, with a mean of 59.3% ± 1.6%. Similarly, amyloid area/islet area varied widely, ranging from 0 in non-transgenic islets to 9.4% in transgenic islets. The mean amyloid area/islet area in the transgenic islets was 3.2% ± 0.5%. The mean β-cell apoptosis rate in the relevant 30 islet preparations was 0.24% ± 0.05% apoptotic β-cells, ranging from 0.05% in non-transgenic to 0.90% in transgenic islets.
Figure 2.

Examples of islets from human islet amyloid polypeptide (IAPP) transgenic mice with varying quantities of β-cell and amyloid areas. β cells (red), amyloid (green) and nuclei (blue) are shown for three isolated islets with (A) 63.2% β-cell area and 0% amyloid area; (B) 52.8% β-cell area and 4.5% amyloid area; and (C) 40.1% β-cell area and 16.8% amyloid area. (D) β cells (blue) and propidium iodide (red) staining, with a propidium iodide-positive nucleus, highlighted with an arrow. Magnification is 200 fold. Scale, 50 µm.
Moving Averages and Determination of Optimal Islet Number for Quantification of β-cell Area, Amyloid Area and β-cell Apoptosis
Quantification of the moving average for β-cell area/islet area and amyloid area/islet area from the three preparations with the greatest number of islets (all quantified by one investigator) are illustrated in Figures 3A–3F and Figures 3G–3L, respectively. Similarly, the moving average for β-cell apoptosis from three islet preparations (all quantified by one investigator) are illustrated in Figures 3M–3O. In these six preparations, the moving average for increments of 10 (dark blue line) or 20 (black line) islets demonstrated greater variability than when 30 (green line) or more islets were quantified.
Figure 3.

Moving averages of β-cell area normalized to islet area using islet increments of 10 to 90 islets in islet preparation 1 (A), islet preparation 2 (B) and islet preparation 3 (C). Data from different numbers of islets (distinguished by color) from the same islet preparation were used to compute the moving average. To illustrate more clearly that evaluating 30 islets or more is not associated with marked variability in β-cell area/islet area, data is shown for islet increments of 30–90 only for islet preparations 1 (D), 2 (E) and 3 (F). Moving averages are also shown for amyloid area/islet area using islet increments of 10 to 90 islets in islet preparation 1 (G), islet preparation 2 (H) and islet preparation 3 (I), or using islet increments of 30–90 for islet preparations 1 (J), 2 (K) and 3 (L). Further, moving averages are shown for β-cell apoptosis using islet increments of 10 to 50 islets in islet preparation 4 (M), islet preparation 5 (N) and islet preparation 6 (O).
To examine whether the variability in β-cell area/islet area, amyloid area/islet area and β-cell apoptosis differed when different numbers of islets were quantified, we examined data for these parameters from transgenic and non-transgenic islet preparations that had been quantified by four to five different investigators (Fig. 4). In this figure, each investigator is represented by a different symbol (circle, square, triangle, inverted triangle, diamond) with the CV within an increment group (CIi) represented by a different symbol color (black denotes increment 10, red denotes increment 20, and so on; see Fig. 4). For the measures of β-cell and amyloid areas, in 13 transgenic and 10 non-transgenic islet preparations, these investigators quantified an average of 62.9 ± 3.4 islets, with a range of 31 to 98 islets per preparation. In these preparations, islet size varied greatly (1,559–41,743 μm2). Therefore, as routinely reported, β-cell and amyloid areas were determined relative to islet size. The average CV for β-cell/islet area of CI10 was 29.8% and for CI30, 10.8% (Fig. 4A). When the mean normalized area of CI10 was compared with that of any greater numbers of islets, the largest relative difference in β-cell area/islet area was less than 2.4%. When the same assessments were done for amyloid area/islet area, the average CV of CI10 was 25.5% and the average CV for CI30 was 10.0% (Fig. 4B). For normalized amyloid area, the greatest relative difference between islet increment groups was 15%, observed in a sample that only had 0.25% amyloid area/islet area; thus, the small absolute change of 0.04% amyloid area/islet area led to this 15% relative change. These same assessments for β-cell apoptosis were made in islet preparations from 12 transgenic and 6 non-transgenic mice, using a range of 21 to 56 islets (Fig. 4C). For the rate of β-cell apoptosis, the mean CV for CI10 was 20.7% and for CI30, 7.6%. The largest relative difference in the rate of β-cell apoptosis when the islet increment was changed was 21%.
Figure 4.

Coefficient of variation of CIi for (A) β-cell area/islet area, (B) amyloid area/islet area and (C) rate of β-cells apoptosis. Data from each transgenic islet pellet is connected with a grey line and each non-transgenic islet pellet with a blue line. Islet increments are color coded (10 is black; 20, red; 30, blue; 40, green; 50, orange; 60, purple; 70, gold, 80, salmon pink, 90, pink). The five investigators are symbol coded (circle, square, triangle, inverted triangle, diamond). The same islet preparations were used for (A) and (B), and additional islet preparations were used for (C).
As illustrated in Figures 4 and 5, the CV of CIi for normalized β-cell area, amyloid area and β-cell apoptosis decreased with increasing numbers of islets. The mean CVs for these measures in transgenic islets are illustrated in Figure 5. When comparing the CVs of CIi for β-cell area/islet area determined with 10 to 60 islets with that obtained from 70 islets, the CV was significantly greater when 30 or fewer islets were assessed (p<0.05; Fig. 5A). For amyloid area/islet area, only islet increments of 10 and 20 had CVs that were significantly greater than that for CI70 (p<0.05; Fig. 5B). For the β-cell apoptosis rate, the CV of CI10 was significantly greater as compared with CI30 (p<0.05; Fig. 5C).
Figure 5.
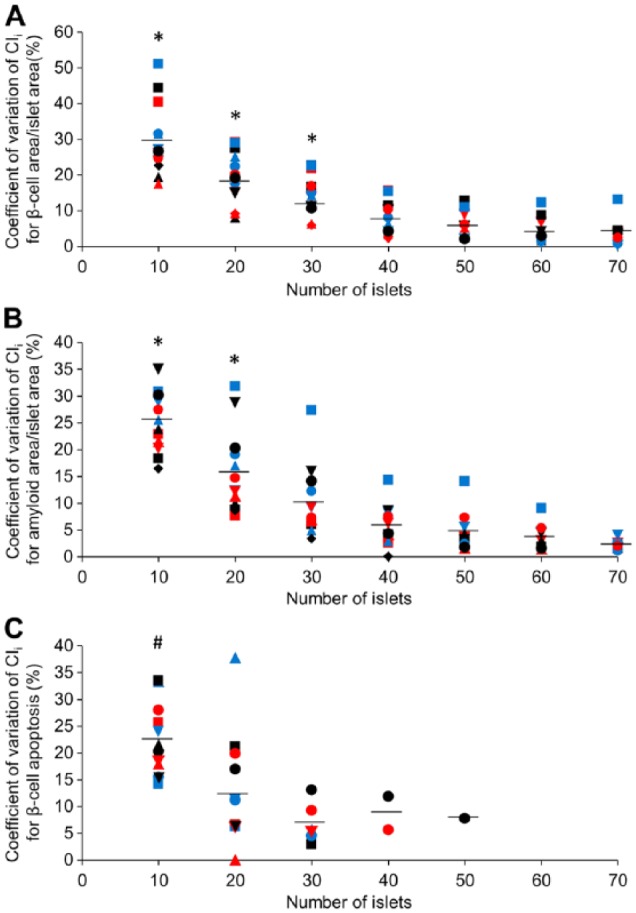
Coefficient of variation of CIi as a function of islet number for (A) β-cell area/islet area, (B) amyloid area/islet area and (C) rate of β-cell apoptosis in transgenic islet preparations. The islet preparations are symbol coded for the five investigators (circle, square, triangle, inverted triangle, diamond) and color coded for the different preparations for each individual investigator (black, red, blue). The same islet preparations were used in (A) and (B), and additional islet preparations were used for (C). Means are illustrated as horizontal lines. *p<0.05 vs 70 islets and #p<0.05 vs 30 islets, as determined with a Bonferroni-corrected unpaired t-test.
To determine whether amyloid deposition influences the variability of β-cell area measurements, we examined the relationship between amyloid area/islet area and the CV of the corresponding β-cell area/islet area in all transgenic islet preparations. No significant relationship was found between these two measures in any islet increment group (Fig. 6). We did not perform these analyses for 70 and 80 islets, as there were only 8 and 3 data pairs available.
Figure 6.

Relationship between amyloid area/islet area and the coefficient of variation (CV) of β-cell area/islet area in transgenic islet preparations for islet increments of (A) 10 (n=18), (B) 20 (n=18), (C) 30 (n=17), (D) 40 (n=17), (E) 50 (n=13) and (F) 60 (n=13).
Sample Size Calculations for β-cell Area, Amyloid Area and β-cell Apoptosis
To calculate sample sizes required to detect expected treatment effects (effect size) in amyloid area, β-cell area and β-cell apoptosis, we used data from a study in which hIAPP transgenic and non-transgenic islets were cultured in 16.7 mM glucose for 144 hr (n=6 independent experiments for each genotype). Sample sizes were determined to provide 80% power to detect a broad range of treatment effects. Calculations were made based on the mean data obtained when quantifying 20, 30 or 40 islets per preparation, with the exception of β-cell apoptosis for which the data was generated using 20 and 30 islets per preparation, as data were only available on less than 40 islets per preparation (Table 1). For the six independent islet preparations from transgenic mice, the average means for β-cell area/islet area, amyloid area/islet area, and rate of β-cell apoptosis did not differ when increasing numbers of islets were quantified, but the standard deviations decreased. Therefore, sample size decreased with an increase in either the effect size or the number of islets analyzed.
Table 1.
hIAPP Transgenic Islet Preparations.
| β-Cell Area/Islet Area |
Multiplicative Effect Size (%) |
||||||||||
|---|---|---|---|---|---|---|---|---|---|---|---|
| Islets | Mean ± SD | 2.5 | 5 | 7.5 | 10 | 12.5 | 15 | 17.5 | 20 | 25 | 30 |
| 20 | 62.40 ± 8.34 | 225 | 57 | 25 | 15 | 9 | 7 | 5 | 4 | 3 | 2 |
| 30 | 61.86 ± 7.40 | 179 | 45 | 20 | 12 | 8 | 5 | 4 | 3 | 2 | 2 |
| 40 | 61.48 ± 7.04 | 165 | 42 | 19 | 11 | 7 | 5 | 4 | 3 | 2 | 2 |
| Amyloid Area/Islet Area |
Multiplicative Effect Size (%) |
||||||||||
| Islets | Mean ± SD | 2.5 | 5 | 7.5 | 10 | 12.5 | 15 | 17.5 | 20 | 25 | 30 |
| 20 | 2.05 ± 0.66 | 1368 | 342 | 152 | 86 | 38 | 21 | 14 | 10 | 4 | 2 |
| 30 | 2.03 ± 0.51 | 817 | 205 | 91 | 52 | 23 | 13 | 9 | 6 | 3 | 2 |
| 40 | 2.07 ± 0.47 | 482 | 144 | 68 | 40 | 17 | 10 | 7 | 5 | 2 | 2 |
| % Apoptotic β Cells |
Multiplicative Effect Size (%) |
||||||||||
| Islets | Mean ± SD | 2.5 | 5 | 7.5 | 10 | 15 | 20 | 25 | 30 | 50 | 70 |
| 20 | 0.30 ± 0.12 | 2047 | 512 | 228 | 128 | 57 | 32 | 21 | 15 | 6 | 3 |
| 30 | 0.30 ± 0.06 | 484 | 121 | 54 | 31 | 14 | 8 | 5 | 4 | 2 | 2 |
Non-transgenic Islet Preparations.
| β-cell Area/Islet Area |
Multiplicative Effect Size (%) |
||||||||||
|---|---|---|---|---|---|---|---|---|---|---|---|
| Islets | Mean ± SD | 2.5 | 5 | 7.5 | 10 | 15 | 20 | 25 | 30 | 50 | 70 |
| 20 | 69.73 ± 5.28 | 73 | 18 | 8 | 5 | 3 | 2 | 2 | 2 | 2 | 2 |
| 30 | 69.56 ± 5.11 | 68 | 17 | 8 | 5 | 3 | 2 | 2 | 2 | 2 | 2 |
| 40 | 69.48 ± 5.08 | 67 | 17 | 8 | 5 | 3 | 2 | 2 | 2 | 2 | 2 |
| % Apoptotic β Cells |
Multiplicative Effect Size (%) |
||||||||||
| Islets | Mean ± SD | 2.5 | 5 | 7.5 | 10 | 15 | 20 | 25 | 30 | 50 | 70 |
| 20 | 0.13 ± 0.07 | 3084 | 771 | 343 | 193 | 86 | 49 | 31 | 22 | 8 | 4 |
| 30 | 0.14 ± 0.05 | 1834 | 459 | 204 | 115 | 51 | 29 | 19 | 13 | 5 | 3 |
Number of islet preparations required per group to measure β-cell area/islet area, amyloid area/islet area and β-cell apoptosis rate in islets from hIAPP transgenic and non-transgenic mice cultured in 16.7 mM glucose for 144 hr for different effect sizes when quantifying 20, 30 and 40 islets (power of 80%; p=0.05 for two-sided test).
We did the same analyses for β-cell area and rate of β-cell apoptosis using six islet preparations from non-transgenic mice and these data are also presented in Table 1. In keeping with what we observed with the hIAPP transgenic islets, the means did not differ, whereas the standard deviations decreased when increasing numbers of islets were quantified. Therefore, the required sample size decreased with increasing effect size or number of islets analyzed.
Discussion
In this study we determined the variability in β-cell and amyloid areas as well as β-cell apoptosis when quantifying different numbers of islets. As expected, the variability in these measures decreases as more islets are examined. We found that making these measures on 30 islets provides reliable, and we believe acceptable, estimates of β-cell area, amyloid area and β-cell apoptosis. Thus, by using just 30 islets for these measures, an islet isolation should yield sufficient islets for the determination of other non-histochemical outcomes of interest.
Our initial analyses involved 23 islet preparations from hIAPP transgenic and non-transgenic mice that had been quantified by five different investigators for islet, β-cell and amyloid areas and 18 islet preparations for β-cell apoptosis assessments. Using the approach of moving averages, as illustrated in Figure 3, it is apparent that the mean β-cell and amyloid areas relative to islet area as well as β-cell apoptosis demonstrate far greater variability when 10 or 20 islets are analyzed than when 30 or more islets are quantified. These observations suggest that it should be possible to analyze 30 islets with very little difference in the mean measure. However, as the number of islets examined increased, the variability of the CVs within an islet increment group for all measures decreased, thereby making it more likely to demonstrate statistical differences between samples when greater numbers of islets are quantified. The implication of this observation is that, in studies where an intervention is anticipated to produce a marginal change, there is a benefit to quantifying more islets.
Even though increasing the number of islets decreased the variability of the CVs for β-cell area/islet area, amyloid area/islet area and the rate of β-cell apoptosis, in most instances it is not necessary for large (more than 40) numbers of islets to be analyzed. When 30 islets are used, the CVs for these measures, we believe, are more than acceptable. For amyloid, we found that, when the area of interest is low, a small absolute change leads to a large relative change, thus increasing the CV considerably. That said, when the amount of amyloid area relative to islet area is 1.0% or more, which is the quantity expected under typical control conditions, the variability of the CV is typically <15%.
In the assessment of β-cell area/islet area, we found that, for one investigator, the mean value for this measure was higher in all six preparations compared with those samples examined by the other four investigators (inverted triangle in Fig. 4A). We do not know if this difference is due to one or more of a number of factors including an islet selection bias, a different outcome of the experimental conditions, technical differences in sample preparation, or investigator variation in the scoring method. Nevertheless, the variation of CVs for β-cell area/islet area in these islets with a greater proportion of β-cells did not differ from those quantified by the other four investigators using similar numbers of islets. This observation is important, as it highlights that differences in the proportion of the islet occupied by β cells and/or the investigator are not critical determinants of the resulting variation of CVs for β-cell area/islet area.
The previous assessment of the impact of the amount of sample on measurements of β-cell mass in sections of rat pancreas have suggested that, for a relative error of 10% (95% confidence interval) or less, at least 1.2% of the total pancreas needs to be systematically sampled and analyzed (Chintinne et al. 2010). Doubling the sample to 2.5% of the pancreas decreases the relative error but it remains greater than 5%. Based on an estimate that the adult mouse pancreas contains about 3,000 islets (Dor et al. 2004; Halban 2004), this sample estimate amounts to 36 and 75 islets, respectively. Another group has suggested that this systematic sampling has to be from four to five depths avoiding the peripheries of the tissue (Golson et al. 2014). Typically, this would amount to 100 to 200 islets (unpublished observation). In our system of isolated islets, we observed acceptable variation of CVs with a fewer number of islets compared to what has been suggested for histological measurements in vivo. Thus, the variability of CVs we observed for β-cell area/islet area when evaluating 30 isolated islets from a single preparation is lower than that found when estimating β-cell measures in intact pancreata using a similar or greater number of islets.
In our estimation of what may be the optimal number of islets to assess, we also took into account the fact that performing complex experiments using islets to obtain only histological-based measurements results in the loss of an ability to relate these findings to other outcomes. For example, one may be interested in examining the relationship between β-cell area and mRNA levels, peptide content and/or cell viability. Another reason not to use large amounts of islets per islet preparation for histochemical quantification is that the yield per islet isolation is limited.
Using data from the control conditions of a study in which we had made measurements of amyloid and β-cell areas relative to islet area as well as β-cell apoptosis, we determined sample sizes for these three measures with a broad range of effect sizes. As anticipated, with increasing effect size of an intervention, the number of studies that would be required to statistically detect differences declined. Similarly, increasing islet numbers decreased the SD and led to smaller sample sizes. Based on these determinations, it would appear that 4 to 8 separate studies using 30 islets will provide sufficient power to detect treatment effects that are frequently observed with interventions that change amyloid deposition, β-cell area and/or β-cell apoptosis (Zraika et al. 2009; Zraika et al. 2010; Aston-Mourney et al. 2011; Subramanian et al. 2012; Aston-Mourney et al. 2013).
We made measurements of β-cell/islet area in both hIAPP transgenic and non-transgenic islets. When the variability of the CVs for this measure between the two different genotypes was compared, increasing the number of islets assessed produced similar reductions in the CV for both genotypes. Further, we found that the presence of amyloid did not result in a bias in the variability of β-cell area (Fig. 6). These observations are in keeping with the finding that the calculated sample sizes decreased similarly in both genotypes with an increase in effect size or number of islets quantitated.
In summary, we have performed the first comprehensive assessment of the reproducibility of histochemical measurements frequently made on islets in studies of glucose metabolism. Our findings suggest that, although the variability in measures of interest decrease as greater numbers of islets are assessed, 30 islets is a reasonable number to balance the need for precision and experimental feasibility.
Acknowledgments
We thank Joshua Willard, Phillip Bergquist, Atiqur Rahman, Jessica Wilkins-Gutierrez and Chan Ho for excellent technical support.
Footnotes
Declaration of Conflicting Interests: The authors declared no potential conflicts of interest with respect to the research, authorship, and/or publication of this article.
Funding: The authors disclosed receipt of the following financial support for the research, authorship, and/or publication of this article: This work was supported by the Department of Veterans Affairs grant BX001060 and NIH grants DK-007247, DK-080945 and DK-017047. DTM was supported by a Swiss National Science Foundation Fellowship and the Dick and Julia McAbee Endowed Fellowship in Diabetes Research from the University of Washington. TS and ATT were supported by an American Diabetes Association Mentor-Based Fellowship.
References
- Aston-Mourney K, Hull RL, Zraika S, Udayasankar J, Subramanian SL, Kahn SE. (2011). Exendin-4 increases islet amyloid deposition but offsets the resultant beta cell toxicity in human islet amyloid polypeptide transgenic mouse islets. Diabetologia 54:1756-1765. [DOI] [PMC free article] [PubMed] [Google Scholar]
- Aston-Mourney K, Zraika S, Udayasankar J, Subramanian SL, Green PS, Kahn SE, Hull RL. (2013). Matrix metalloproteinase-9 reduces islet amyloid formation by degrading islet amyloid polypeptide. J Biol Chem 288:3553-3559. [DOI] [PMC free article] [PubMed] [Google Scholar]
- Bagdade JD, Bierman EL, Porte D., Jr (1967). The significance of basal insulin levels in the evaluation of the insulin response to glucose in diabetic and nondiabetic subjects. J Clin Invest 46:1549-1557. [DOI] [PMC free article] [PubMed] [Google Scholar]
- Brissova M, Fowler MJ, Nicholson WE, Chu A, Hirshberg B, Harlan DM, Powers AC. (2005). Assessment of human pancreatic islet architecture and composition by laser scanning confocal microscopy. J Histochem Cytochem 53:1087-1097. [DOI] [PubMed] [Google Scholar]
- Chintinne M, Stange G, Denys B, In ‘t Veld P, Hellemans K, Pipeleers-Marichal M, Ling Z, Pipeleers D. (2010). Contribution of postnatally formed small beta cell aggregates to functional beta cell mass in adult rat pancreas. Diabetologia 53:2380-2388. [DOI] [PubMed] [Google Scholar]
- Dor Y, Brown J, Martinez OI, Melton DA. (2004). Adult pancreatic beta-cells are formed by self-duplication rather than stem-cell differentiation. Nature 429:41-46. [DOI] [PubMed] [Google Scholar]
- Foulis AK, Liddle CN, Farquharson MA, Richmond JA, Weir RS. (1986). The histopathology of the pancreas in type 1 (insulin-dependent) diabetes mellitus: a 25-year review of deaths in patients under 20 years of age in the United Kingdom. Diabetologia 29:267-274. [DOI] [PubMed] [Google Scholar]
- Gleason CE, Gonzalez M, Harmon JS, Robertson RP. (2000). Determinants of glucose toxicity and its reversibility in the pancreatic islet beta-cell line, HIT-T15. Am J Physiol Endocrinol Metab 279:E997-E1002. [DOI] [PubMed] [Google Scholar]
- Golson ML, Bush WS, Brissova M. (2014). Automated quantification of pancreatic beta-cell mass. Am J Physiol Endocrinol Metab 306:E1460-E1467. [DOI] [PMC free article] [PubMed] [Google Scholar]
- Halban PA. (2004). Cellular sources of new pancreatic beta cells and therapeutic implications for regenerative medicine. Nat Cell Biol 6:1021-1025. [DOI] [PubMed] [Google Scholar]
- Hiddinga HJ, Sakagashira S, Ishigame M, Madde P, Sanke T, Nanjo K, Kudva YC, Lee JJ, van Deursen J, Eberhardt NL. (2012). Expression of wild-type and mutant S20G hIAPP in physiologic knock-in mouse models fails to induce islet amyloid formation, but induces mild glucose intolerance. J Diabetes Investig 3:138-147. [DOI] [PMC free article] [PubMed] [Google Scholar]
- Hohmeier HE, Newgard CB. (2004). Cell lines derived from pancreatic islets. Mol Cell Endocrinol 228:121-128. [DOI] [PubMed] [Google Scholar]
- Höppener Dr. J. W. M, Verbeek J. S, de Koning E. J. P, Oosterwijk C, van Hulst K. L, Visser-Vernooy H. J, Hofhuis F. M. A, van Gaalen S, Berends M. J. H, Hackeng W. H. L, Jansz H. S, Morris J. F, Clark A, Capel P. J. A, Lips C. J. M. (1993). Chronic overproduction of islet amyloid polypeptide/amylin in transgenic mice: lysosomal localization of human islet amyloid polypeptide and lack of marked hyperglycaemia or hyperinsulinaemia. Diabetologia 36:1258-1265. [DOI] [PubMed] [Google Scholar]
- Janson J, Soeller WC, Roche PC, Nelson RT, Torchia AJ, Kreutter DK, Butler PC. (1996). Spontaneous diabetes mellitus in transgenic mice expressing human islet amyloid polypeptide. Proc Natl Acad Sci U S A 93:7283-7288. [DOI] [PMC free article] [PubMed] [Google Scholar]
- Jurgens CA, Toukatly MN, Fligner CL, Udayasankar J, Subramanian SL, Zraika S, Aston-Mourney K, Carr DB, Westermark P, Westermark GT, Kahn SE, Hull RL. (2011). beta-cell loss and beta-cell apoptosis in human type 2 diabetes are related to islet amyloid deposition. Am J Pathol 178:2632-2640. [DOI] [PMC free article] [PubMed] [Google Scholar]
- Kahn SE, Prigeon RL, McCulloch DK, Boyko EJ, Bergman RN, Schwartz MW, Neifing JL, Ward WK, Beard JC, Palmer JP. (1993). Quantification of the relationship between insulin sensitivity and beta-cell function in human subjects. Evidence for a hyperbolic function. Diabetes 42:1663-1672. [DOI] [PubMed] [Google Scholar]
- Klöppel G, Drenck C, Carstensen A, Heitz P. (1984). The B cell mass at the clinical onset of type I diabetes. Behring Inst Mitt 75:42-49. [PubMed] [Google Scholar]
- Kloppel G, Lohr M, Habich K, Oberholzer M, Heitz PU. (1985). Islet pathology and the pathogenesis of type 1 and type 2 diabetes mellitus revisited. Surv Synth Pathol Res 4:110-125. [DOI] [PubMed] [Google Scholar]
- Li DS, Yuan YH, Tu HJ, Liang QL, Dai LJ. (2009). A protocol for islet isolation from mouse pancreas. Nat Protoc 4:1649-1652. [DOI] [PubMed] [Google Scholar]
- MacArthur DL, de Koning EJ, Verbeek JS, Morris JF, Clark A. (1999). Amyloid fibril formation is progressive and correlates with beta-cell secretion in transgenic mouse isolated islets. Diabetologia 42:1219-1227. [DOI] [PubMed] [Google Scholar]
- Maclean N, Ogilvie RF. (1955). Quantitative estimation of the pancreatic islet tissue in diabetic subjects. Diabetes 4:367-376. [DOI] [PubMed] [Google Scholar]
- Nerup J, Andersen O, Bendixen G, Egeberg J, Gunnarsson R, Kromann H, Poulsen J. (1974). Cell-mediated Immunity in Diabetes Mellitus. Proc R Soc Med 67:506-513. [DOI] [PMC free article] [PubMed] [Google Scholar]
- Orci L, Baetens D, Rufener C, Amherdt M, Ravazzola M, Studer P, Malaisse-Lagae F, Unger R. (1976). Hypertrophy and hyperplasia of somatostatin-containing D-cells in diabetes. Proc Natl Acad Sci U S A 73:1338-1342. [DOI] [PMC free article] [PubMed] [Google Scholar]
- Schwartz P. (1970). Amyloidosis; cause and manifestation of senile deterioration, Springfield: Charles C. Thomas. [Google Scholar]
- Subramanian SL, Hull RL, Zraika S, Aston-Mourney K, Udayasankar J, Kahn SE. (2012). cJUN N-terminal kinase (JNK) activation mediates islet amyloid-induced beta cell apoptosis in cultured human islet amyloid polypeptide transgenic mouse islets. Diabetologia 55:166-174. [DOI] [PMC free article] [PubMed] [Google Scholar]
- Verchere CB, D’Alessio DA, Palmiter RD, Weir GC, Bonner-Weir S, Baskin DG, Kahn SE. (1996). Islet amyloid formation associated with hyperglycemia in transgenic mice with pancreatic beta cell expression of human islet amyloid polypeptide. Proc Natl Acad Sci U S A 93:3492-3496. [DOI] [PMC free article] [PubMed] [Google Scholar]
- Wang F, Hull RL, Vidal J, Cnop M, Kahn SE. (2001). Islet amyloid develops diffusely throughout the pancreas before becoming severe and replacing endocrine cells. Diabetes 50:2514-2520. [DOI] [PubMed] [Google Scholar]
- Westermark GT, Gebre-Medhin S, Steiner DF, Westermark P. (2000). Islet amyloid development in a mouse strain lacking endogenous islet amyloid polypeptide (IAPP) but expressing human IAPP. Mol Med 6:998-1007. [PMC free article] [PubMed] [Google Scholar]
- Westermark P, Engstrom U, Johnson KH, Westermark GT, Betsholtz C. (1990). Islet amyloid polypeptide: pinpointing amino acid residues linked to amyloid fibril formation. Proc Natl Acad Sci U S A 87:5036-5040. [DOI] [PMC free article] [PubMed] [Google Scholar]
- Zraika S, Aston-Mourney K, Marek P, Hull RL, Green PS, Udayasankar J, Subramanian SL, Raleigh DP, Kahn SE. (2010). Neprilysin impedes islet amyloid formation by inhibition of fibril formation rather than peptide degradation. J Biol Chem 285:18177-18183. [DOI] [PMC free article] [PubMed] [Google Scholar]
- Zraika S, Hull RL, Udayasankar J, Aston-Mourney K, Subramanian SL, Kisilevsky R, Szarek WA, Kahn SE. (2009). Oxidative stress is induced by islet amyloid formation and time-dependently mediates amyloid-induced beta cell apoptosis. Diabetologia 52:626-635. [DOI] [PMC free article] [PubMed] [Google Scholar]
- Zraika S, Hull RL, Udayasankar J, Utzschneider KM, Tong J, Gerchman F, Kahn SE. (2007). Glucose- and time-dependence of islet amyloid formation in vitro. Biochem Biophys Res Commun 354:234-239. [DOI] [PMC free article] [PubMed] [Google Scholar]