

Abstract
Objective
Characterize the number of minutes of moderate and vigorous physical activity at work and outside of work during seven consecutive days, in a sample of 55 commercial construction workers.
Methods
Workers wore accelerometers during work and outside work hours for seven consecutive days, and completed brief survey at the seventh day of data collection.
Results
From the directly measured physical activity, the average number per participant of moderate minutes of occupational physical activity and physical activity outside of work obtained in short bouts were 243 minutes (65%) and 130 minutes (35%), respectively. Directly measured minutes of vigorous occupational physical activity were significant and positively correlated with self-reported fatigue.
Conclusions
Among commercial construction workers, physical activity from work contributes significantly, approximately 2/3, towards a workers total amount of weekly minutes of moderate physical activity.
INTRODUCTION
Construction work is physically demanding yet it might not confer the health benefits associated with physical activities. While moderate or vigorous intensity leisure time physical activity (LTPA) has been widely shown to confer positive health benefits to cardiovascular health and to extend longevity,1–4 exposure to high occupational physical activity (OPA) has been associated with an increased risk of cardiovascular disease (CVD) and all-cause mortality.5,6 In addition, the daily work activities in construction include frequent lifting and carrying of heavy loads, static work, and exposure to vibrations and extreme weather conditions,7 which have all been associated with work-related diseases and injury.8–10 In fact, musculoskeletal disorders (MSDs) are highly prevalent in the construction industry.9 In 2010, the rate of MSDs was 16% higher than the rate of 32.8 per 10,000 Full Time Equivalent workers (FTEs) for all industries combined.11 For the same period, overweight and obesity, which have an inverse relationship with physical activity, were present in 71% of US construction workers, compared to 63% for all industries combined.11 Furthermore, MSDs and CVD have been identified as main causes of occupational disability in construction workers.10,12
Interventions aimed at increasing LTPA levels among construction workers may have a role as part of an integrated occupational health, safety and worksite health intervention.13–16 However, the amount of moderate and vigorous levels of OPA that construction workers experience remains unclear. Studies using objective measures of physical activity generally show that people overestimate their levels of moderate and vigorous physical activity.17,18 For occupational physical activity, same results have been found when the task performed is physically demanding.19 Therefore, our ability in implementing tailored physical activity interventions that factors a worker’s job conditions is limited. There is a need to characterize the moderate and vigorous levels of OPA and outside of work among construction workers. Previous observational studies have primarily examined physical activity based on self-reports,3,5,6 while other studies lack sufficient direct measurement for providing a good estimation of physical activity levels.20
The goals of this pilot study were to collect and characterize directly measured and self-reported moderate and vigorous physical activity levels at work, as well as outside of work in a convenience sample of 60 commercial construction workers during seven consecutive days. Since construction work is classified as physically demanding, we expect work activities to contribute significantly to the total number of minutes at moderate and vigorous activity for the week. In addition, we examined the association between directly measured and self-reported physical activity from both work and outside of work activities while controlling for perceived exertion, fatigue, pain, and functional limitations that could influence the implementation of work interventions.15
METHODS
Subjects and Study Design
In collaboration with the safety mangers and jobsite foreman of three general construction contracting firms, we identified five commercial construction worksites in the State of Massachusetts from where we randomly invited 78 workers and subsequently consented and enrolled 60 construction workers into the pilot study (77% response rate) between February and April 2013. All study materials and protocols were approved by the applicable institutional review board.
Physical Activity Measurements
To directly measure physical activity, participants wore a GT3X Actigraph Accelerometer on their waist for seven consecutive days. On first day, the accelerometer was initialized by the researcher and it was demonstrated to the construction workers how to attach and remove the accelerometer at their waist. Workers were instructed to wear the accelerometer all days except while they were sleeping, taking a shower, or swimming. Participants also kept a daily log throughout the week of study documenting the beginning and end of work shifts along with times they wore the accelerometer and when they took it off. The accelerometers recorded data in one-minute intervals, providing the number of counts for each minute for the duration of the seven days. A count was defined as any activity that was measured by the accelerations where the accelerometer is mounted at the waist, and is above the pre-defined threshold of 0.016317 m/s2. Number of counts per minute has been highly correlated with energy expenditure.21 At the end of the seven days, the researcher retrieved the accelerometer from the participant and downloaded its data to the study computer and the device was turned off.
We parsed the accelerometer data into two sets of data, minutes associated with work alone (OPA) and minutes associated with non-work times (Outside of Work). For each set of parsed data, we assigned each minute to a different level of physical activity based on definitions derived by Freedson and colleagues from energy expenditure studies.21 The different levels of physical activity intensity include sedentary (0–100 counts per minute), light (101–1952 counts per minute, moderate (1953–5724 counts per minute), and vigorous (>5725 counts per minute). We also identified bouts of moderate and vigorous activities with duration of 10 minutes or more.22 For each set of parsed data, we also calculated the total number of minutes of moderate and vigorous activity along with the total number of minutes obtained in bouts of 10 minutes or more of moderate and vigorous activity since most guidelines on physical activity are based on sustained activity for a minimum of 10 minutes.23,24 To describe overall physical activity at work, we also calculated total minutes of sedentary and light activities based on the parsed dataset containing “At Work” physical activity data.
From these parsed data sets, we assessed if an individual met weekly recommended guidelines for moderate and vigorous physical activity using three different sets of criteria. First, we used the strict recommendations from the American College of Sports Medicine and the American Heart Association of engaging in 30 minutes of moderate activity at least 5 days a week or 20 minutes of vigorous activity 3 days a week.23 Second, we used the more recent guidelines from the United States Department of Health and Human Services of engaging in 150 minutes of moderate activity or 75 minutes of vigorous activity per week.24 For both of these criteria, minutes of moderate and vigorous activity were calculated for bouts of 10 minutes or more. Third, we used a modified version of the US Department of Health and Human Services recommendation of 150 minutes of moderate or 75 minutes of vigorous activity accumulated in bouts of at least 10 min allowing 1- to 2-min interruption (short bouts), which also seems to be beneficial in reducing the cardiovascular risk.25
Perceived exertion and survey
Workers completed at the end of first day of data collection, the Borg rating scale measuring their perceived exertion of physical activity intensity level for their current and typical shift.26 The response scale, ranged from 6 to 20 which correlates to the worker’s heart rate, indicating how heavy and strenuous the participant perceived the shift.
At the end of the 7th day, each worker was asked to complete a survey that included retrospective measures of leisure-time and occupational physical activity, pain, fatigue, and functional limitations experienced during the study week.
The physical activity measure was adopted from the Center for Disease Control and Prevention Behavioral Risk Factor Surveillance System (BRFSS) survey.27 Participants were asked how much time they spent doing moderate (1 item) and vigorous (1 item) activities for at least 10 minutes at a time while at work in the last 7 days, and then while not at work in the last 7 days. Responses were summed to reflect total minutes of moderate and total minutes of vigorous physical activity for both OPA and Outside of Work for the preceding week. The daily logs of activities over the last seven days helped them calculate these times.
The validated fatigue measure included an impact scale with eight items (e.g. Because of fatigue, I felt less alert).28 Each of the eight items was rated on a Likert-type scale, with 1=never and 5=very often. Scores were summed to attain a total ranging from 8 to 40, with an increasing level of fatigue.
The pain measure consisted of five items assessing pain severity for the past seven days in five body areas (low back, neck/shoulder, wrist/forearm, knee, ankle/feet). Responses were rated on a 5-point Likert-type scale ranging from 1 = none to 5 = extreme pain.29 The 5 responses were summed for a single pain score ranging from 5 to 25.
The functional limitations measure asked the participants about their ability to perform 10 routine daily activities of living during the past 7 days (e.g. ability to do heavy household chores in the last 7 work days).30 Participants rated levels of difficulty in carrying out these 10 tasks of life on a 5-point Likert-type scale, with 1 = “no difficulty in carrying out the task” to 5 = “unable to do task without help.” Responses from these items were summed creating a score ranging from 10 to 50.
Statistical Analyses
To evaluate the associations between directly measured physical activity and self-reported physical activity, fatigue, pain and functional limitations, we used Spearman’s correlations. Non-parametric Spearman’s correlations were chosen because of the ordinal ratings of the scales used in assessing these survey measures; and the highly skewed distributions of these parameters. Correlation analyses explored associations between directly measured physical activity (short bouts) and each of self-reported measure (i.e., physical activity, fatigue, pain, functional limitations, and perceived exertion).
To ensure our correlations were not driven by the influence of potential covariates, we ran multiple linear regression models on associations that had significant (p<0.05) correlations and adjusted for potential covariates such as age, self-reported fatigue and perceived exertion. For the multiple linear regression models, the dependent variable was minutes of directly measured moderate OPA. The independent variables considered in the models were age, body mass index (BMI), self-reported physical activity (minutes), fatigue, pain, and perceived exertion. All analyses were carried out in STATA 11 (StataCorp, College Station, TX).
RESULTS
We collected complete self-reported survey data as well as directly measured accelerometer data on 55 of 60 construction workers (Table 1). Due to initialization errors of the accelerometers, we lost the directly measured physical activity data on 5 of the 60 workers. Missing data corresponded to workers employed as pile driver (1), laborer (3), and foreman (1) in two of the five worksites. For the 55 construction workers, self-reported compliance in wearing the accelerometer device at work was 99%; and outside of work was 93%. Descriptive statistics are shown in Table 1.
Table 1.
Socio-demographic, work, work exertion, and physical activity characteristics among participants (n=55).
| Socio-demographic and Work Characteristics | N† | % |
|---|---|---|
| Gender | ||
| Female | 0 | 0 |
| Male | 55 | 100 |
| Job Title | ||
| Plumber | 3 | 5 |
| Carpenter | 10 | 18 |
| Demolition | 3 | 5 |
| Electrician | 5 | 9 |
| Operator | 2 | 4 |
| Foreman | 4 | 7 |
| Pipe Fitter | 2 | 4 |
| Iron Worker | 2 | 4 |
| Laborer | 19 | 35 |
| Pile Driver | 2 | 4 |
| Welder | 1 | 2 |
| Missing | 2 | 4 |
| Mean | S.D. | |
| Hours Worked Last 7 Days | 40 | 9 |
| Age | 40 | 11 |
| BMI (kg/m2) | 29 | 4 |
| Perceived exertion | Mean | S.D. |
| Current shift | 12 | 3 |
| Typical shift | 14 | 3 |
| Self-reported Occupational Physical Activity | Mean | S.D. |
| Moderate activity (mins/week) | 942 | 906 |
| Vigorous activity (mins/week) | 522 | 728 |
| Self-reported Physical Activity outside of work | Mean | S.D. |
| Moderate activity (mins/week) | 450 | 570 |
| Vigorous activity (mins/week) | 275 | 484 |
| Met guidelines for physical activity based on self-reported physical activity | N† | % |
| Strict Guidelinesa | 29 | 53 |
| General guidelinesb | 42 | 76 |
| Met guidelines for physical activity based on direct measure | N | % |
| Strict Guidelinesa | 1 | 2 |
| General guidelinesb | 16 | 29 |
| General with short bouts requirementc | 53 | 96 |
30 minutes of moderate activity at least 5 days a week or 20 minutes of vigorous activity 3 days a week achieved in 10 minute bouts.
150 minutes of moderate activity or 75 minutes of vigorous activity per week achieved in 10 minutes bouts.
150 minutes of moderate activity or 75 minutes of vigorous activity per week, in bouts of at least 10 minutes allowing 1 to 2 min interruption.
Differences in sub-total population sample due to item non-response or missing.
Self reported physical activity
Workers self-reported a greater number of minutes of moderate (109%) and vigorous (90%) physical activity at work as compared to self-reported minutes outside of work (Table 2.1). While 76% of the sample of workers met the general U.S. guidelines of physical activity (150 minutes of moderate activity or 75 minutes of vigorous activity per week achieved in 10 minutes bouts) through their self-reported data, only 29% of the workers met this definition when compared to their directly measured physical activity data.
Directly measured physical activity
Based on the total directly measured minutes of moderate (20572 minutes) and vigorous (367 minutes) occupational and outside of work physical activity obtained during the whole week in short bouts, we found that OPA contributes on average to 65% and 29% of the total weekly minutes accrued of moderate and vigorous physical activity respectively (Table 2). In agreement with the direct measures, most minutes of moderate (68%) and vigorous (66%) self reported physical activity were obtained outside of work (Table 1). Almost 88% of the time, OPA was classified as sedentary or light (Table 2). Fifty-three participants (96%) achieved the United States Department of Health and Human Services guidelines when considering short bouts (Table 1).
Table 2.
Across worker distribution of directly measured occupational physical activity (OPA) and physical activity outside of work performed in short and 10 minute bouts per week among participants (n=55).
| SHORT BOUTS
| |||||
|---|---|---|---|---|---|
| Occupational Physical Activity | Mean | (SD) | P25 | P50 | P75 |
|
Physical Activity Level (min)
| |||||
| Sedentary | 760 | 677 | 372 | 573 | 931 |
| Light | 1055 | 404 | 901 | 1129 | 1331 |
| Moderate | 243 | 128 | 140 | 232 | 335 |
| Vigorous | 2 | 6 | 0 | 0 | 1 |
|
| |||||
|
Physical Activity Level (%)
| |||||
| Sedentary | 37 | 18 | 21 | 29 | 42 |
| Light | 51 | 14 | 49 | 58 | 63 |
| Moderate | 12 | 7 | 8 | 12 | 16 |
| Vigorous | 0 | 0 | 0 | 0 | 0 |
|
| |||||
|
Physical Activity Level Outside of Work (min)
| |||||
| Moderate | 130 | 123 | 56 | 80 | 172 |
| Vigorous | 5 | 12 | 0 | 0 | 1 |
|
| |||||
|
Physical Activity Level Outside of Work (%)
| |||||
| Moderate | 0 | 0 | 0 | 0 | 0 |
| Vigorous | 0 | 0 | 0 | 0 | 0 |
|
| |||||
|
10 MINUTE BOUTS
| |||||
| Occupational Physical Activity | Mean | (SD) | P25 | P50 | P75 |
| # Moderate bouts | 3 | 3 | 0 | 2 | 5 |
| Moderate (min) | 40 | 50 | 0 | 21 | 64 |
| Physical Activity Outside of work | |||||
| # Moderate bouts | 5 | 11 | 0 | 1 | 5 |
| Moderate (min) | 93 | 209 | 0 | 20 | 88 |
| # Vigorous bouts | 0 | 1 | 0 | 0 | 0 |
| Vigorous (min) | 3 | 11 | 0 | 0 | 0 |
Correlation analyses
The correlations between perceived exertion, pain, fatigue, functional limitations, self reported physical activity and directly measured physical activity in minutes were not statistically significant, except for directly measured minutes of vigorous activity at work with self reported moderate OPA which were positively correlated (Table 3 and Figure 1).
Table 3.
Spearman’s correlation coefficients (and p-values) between direct measures of occupational physical activity levels and moderate and vigorous activity outside of work in minutes performed in short bouts and self-reported minutes at moderate and vigorous occupational and outside of work physical activity among participants of the (n=55)†
| Parameter | Perceived Exertion | Pain | Fatigue | Functional Limitations | Self-reported OPA | Self-Reported Outside of Work | ||||||||||||
|---|---|---|---|---|---|---|---|---|---|---|---|---|---|---|---|---|---|---|
| Current shift | Typical shift | Moderate | Vigorous | Moderate | Vigorous | |||||||||||||
| rs | p-value | rs | p-value | rs | p-value | rs | p-value | rs | p-value | rs | p-value | rs | p-value | rs | p-value | rs | p-value | |
| Occupational Physical activity (min) | ||||||||||||||||||
| Sedentary | 0.5 | 0.8 | −0.1 | 0.6 | 0.1 | 0.5 | 0.1 | 0.7 | 0.1 | 0.6 | −0.2 | 0.3 | −0.2 | 0.2 | −0.2 | 0.4 | −0.1 | 0.5 |
| Light | 0 | 0.8 | 0 | 1 | −0.1 | 0.5 | −0.1 | 0.5 | 0.1 | 0.7 | 0.1 | 0.7 | 0.1 | 0.5 | 0 | 1 | 0 | 0.8 |
| Moderate | 0.1 | 0.6 | 0.2 | 0.2 | −0.3 | 0.1 | −0.2 | 0.4 | −0.1 | 0.6 | 0.2 | 0.4 | 0.2 | 0.2 | −0.2 | 0.2 | 0 | 1 |
| Vigorous | 0.2 | 0.3 | −0.1 | 0.4 | 0 | 0.8 | 0.2 | 0.2 | 0.1 | 0.7 | 0.4 | 0.04 | 0.2 | 0.2 | 0.1 | 0.6 | 0.1 | 0.4 |
| Directly measured Outside of Work | ||||||||||||||||||
| Moderate | −0.1 | 0.7 | 0.2 | 0.2 | −0.2 | 0.3 | 0.2 | 0.4 | ||||||||||
| Vigorous | 0.1 | 0.5 | 0.2 | 0.3 | −0.1 | 0.4 | 0.2 | 0.3 | ||||||||||
Bold values indicate significant correlations (p<0.05)
Figure 1.
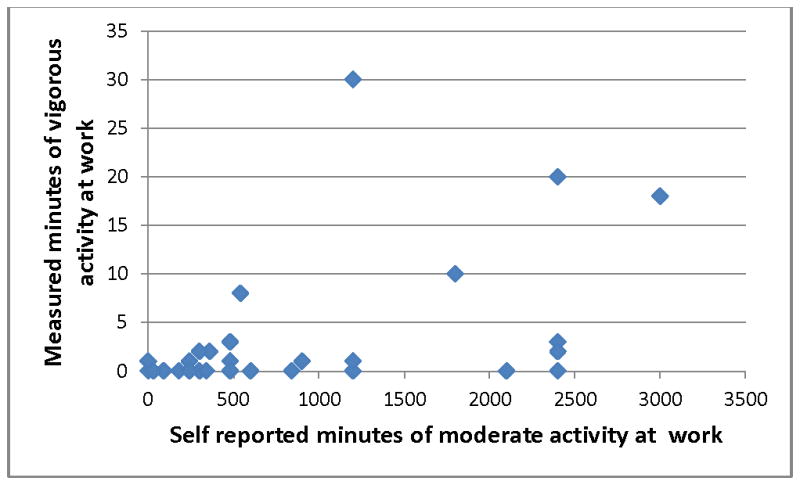
Directly measured minutes of vigorous occupational physical activity versus self-reported minutes of moderate occupational physical activity (n=46, difference in total population sample due to item non-response or missing)
The statistically significant association identified by the correlation analyses between vigorous OPA and self reported moderate OPA remained significant in the multiple linear regression model keeping minutes of moderate OPA as the outcome and self-reported moderate OPA as the main predictor after adjusting for BMI and pain (Table 4).
Table 4.
Multiple linear regression models with unadjusted and adjusted estimates. (n=46)
| Parameter | Estimate | 95% confidence limits | Standard error | P value | |
|---|---|---|---|---|---|
| Unadjusted | |||||
| Self reported moderate OPA | 0.002 | 0.0003 – 0.004 | 0.001 | 0.03 | |
| Adjusted | |||||
| Self reported moderate OPA | 0.002 | 0.0002 – 0.004 | 0.001 | 0.03 | |
| BMI | −0.2 | −0.67 – 0.27 | 0.2 | 0.4 | |
| Pain | 0.3 | −0.24 – 0.90 | 0.3 | 0.3 | |
DISCUSSION
Our direct measures for physical activity performed in short bouts indicate that levels of moderate OPA (231 minutes) and physical activity outside of work (130 minutes) exceeded the American College of Sports Medicine and the American Heart Association’s recommended number of minutes of physical activity per week.
As we expected, the data collected in this pilot suggests that construction workers achieve the United States physical activity guidelines from the physical activity contributed at both work and outside of work, when considering physical activity done in short bouts (with a duration less than 10 minutes). For physical activity while at work, 73% of the workers met the recommended weekly physical activity guidelines for moderate activity. For physical activity outside of work, 31% of the workers met the recommended levels. If we consider the physical activity at work and outside of work, the total percentage of workers meeting the recommendations for moderate activity reached 93% of the participants.
When we used guidelines requiring that the moderate physical activity occurs in bouts of 10 minutes or longer, then only 29% achieved 150 minutes of moderate activity or more per week and only 2% achieved these 150 minutes with 30 minutes per day across five days of the week (Table 1). This suggests those workers are primarily getting physical activity in short bouts of moderate and vigorous activity. Duration of these short bouts of physical activity at work is more related to the characteristics of the task itself, which often last less than 10 minutes. This is in contrast to the sustained physical activity usually obtained for 10 minutes or longer during leisure time. There is evidence that moderate and vigorous physical activity done in short bouts might provide cardiovascular benefits. 25
These study results indicate that construction workers are getting plenty on PA (short bouts); however, US construction workers similar to our sample have high BMI values. Interventions addressing Health status in these workers should not rely on increasing PA alone. Scientific literature suggests that LTPA has a beneficial effect at improving myocardial function, increasing myocardial oxygen supply, and reducing heart rate, which all contribute to enhance physical fitness.31 In contrast, OPA in physically demanding jobs has an increased risk of CVD and all-cause mortality.5 Physical activity, in general, has been identified as an element of the five health related components of physical fitness (cardiorespiratory endurance, muscular endurance, muscular strength, body composition and flexibility). These components can be improved or maintained through planned, structured and repetitive physical activity known as exercise.32 Additionally, men with high physical fitness and high physical work demands do not have an increased risk for CVD mortality.5 Furthermore, workplace interventions aimed at improving physical fitness among construction workers have been successful in the construction work setting: Gram et al.14 found a significant improvement in physical fitness after a twelve-week worksite-based intervention consisting of an individually tailored training program through a twenty minute set of aerobic and strength exercises completed three times per week.14
Perhaps a long-term integrated intervention aimed at reducing physical loads at work, improving physical fitness and reinforcing healthy lifestyles such as tobacco cessation, healthy diets, and reduction of alcohol abuse, may benefit the health of construction workers.13 For example, Groeneveld et al.33, implemented an intervention in 816 male construction workers at high risk for CVD. Over a 6-months period, workers in the intervention group had 45–60 minutes of in person counseling and 4 telephone contacts lasting 15–30 minutes each. They found a beneficial effect on smoking cessation and diet. In our study, 85% of the workers were either overweight or obese with a mean BMI of 29 kg/m2. The features of construction work include times of intense work and intermittent unemployment. It is possible that dietary intake and lack of physical activities during a longer period would explain continued overweight among construction workers. These finding necessitates the need for longitudinal studies that characterize occupational and non-occupation related factors that contribute to the cardiovascular risk factor of construction workers.
We found that workers over-reported the number of minutes of moderate and vigorous activity at work by nearly four-fold and two hundred and sixty-fold, respectively, compared to their directly measured minutes. Our findings support existing concerns regarding reliance on exposures obtained by means of self-reported data and their validity due to the bias that could leads with exposure misclassification.19,34–36 The accuracy of the self-reported duration of the working task might be influenced by the work pattern (working continuously for long periods or discontinuously for short periods), the perceived physical exertion of the task and worker fatigue. For example, we found that workers who self-reported high fatigue where significantly less likely to meet moderate OPA levels. High physical demands of a task could increase the chances of over-reporting its duration and under-report other tasks that are less physically demanding.19
The main strengths of our study were the use of direct measures of physical activity over the seven days follow-up period. We had a very compliant worker population, who let us get complete data (accelerometer data, perceived exertion questionnaire and survey) from 55 (92%) construction workers from the 60 recruited. Direct measures at work and outside of work allowed us to captures variations in physical activity and provided us with a better estimate of OPA and the physical activity outside of work. Therefore, we had a more reliable estimator with a lower risk of misclassification.
This study is not without limitations. The accelerometers may have underestimated activity that involves a static or non-ambulatory exercise, such as biking, swimming, rowing and manual material handling.37 Nonetheless, this did not affect our workers in meeting the US guidelines for physical activity, given the already high level of physical activity measured among them. The BRFSS questionnaire may have limitations in estimating the physical activity at work given its focuses on leisure time activities. Other health survey instruments utilized for assessing physical activity at work are available; however, their goal is to quantify physical activity among sedentary workers.38–40
Finally, the results and conclusions of this pilot study are limited to our convenience sample of unionized, commercial construction workers in New England. However, this sample did represent wide variety of job titles typical in the New England unionized work force on construction. The distribution of race, trade, and job title in this sampler were not that different than the distribution of a larger sample (>300) of construction workers in New England.41 Distribution of trades and race will vary across the country as well as well as other factors that influence physical activity (e.g. seasonal patterns). In terms of physical activity of the larger population, these construction workers do have very different patterns of moderate activity compared to health care workers in New England.36
In conclusion, we found that commercial construction workers in our sample engaged in a large amount of minutes of moderate levels of physical activity at work and outside of work. They met the U.S. Department of Health and Human Services guidelines for physical activity when considering physical activity done in short bouts. Despite the compliance with the guidelines, 85% of the workers were overweight or obese. Given the negative effect of OPA on health, we recommend a tailored intervention aimed to reduce physical loads at work, increase physical fitness in order to reduce the gap between physical job demands and workers’ fitness, and the promotion of healthy lifestyles such as healthy diet, tobacco cessation and alcohol abuse prevention.
Clinical Significance.
Health promotion and intervention activities aimed at increasing leisure-time physical activity levels among commercial construction workers may not need to be a priority. Integrated approaches for improving healthy lifestyles that also include diet and overall fitness should be considered.
Acknowledgments
Funding: National Institute for Occupational Safety and Health (U19 OH008861)
This work was partially supported by a pilot study grant from the Harvard School of Public Health Center for Work, Health and Wellbeing, a National Institute for Occupational Safety and Health Total Worker Health™ Center of Excellence (grant U19 OH008861). Other support included the National Institute of Arthritis and Musculoskeletal and Skin Diseases grant T32 AR055885 and the National Institute for Occupational Safety and Health grant K01-OH010485. The authors would like to thank Kincaid Lowe and Mia Goldwasser of Northeastern University, Emily Sparer and Torey Jerauld of Harvard School of Public Health, and Mingzong Zhang of Tsinghua University who helped in worksite recruitment and data collection.
Footnotes
Conflict of interest noted: None
References
- 1.Krause N, Brand RJ, Kaplan GA, Kauhanen J, Malla S, Tuomainen TP, et al. Occupational physical activity, energy expenditure and 11-year progression of carotid atherosclerosis. Scand J Work Environ Health. 2007;33(6):405–24. doi: 10.5271/sjweh.1171. [DOI] [PubMed] [Google Scholar]
- 2.Holtermann A, Mortensen OS, Burr H, Sogaard K, Gyntelberg F, Suadicani P. The interplay between physical activity at work and during leisure time--risk of ischemic heart disease and all-cause mortality in middle-aged Caucasian men. Scand J Work Environ Health. 2009;35(6):466–74. doi: 10.5271/sjweh.1357. [DOI] [PubMed] [Google Scholar]
- 3.Clays E, De Bacquer D, Janssens H, De Clercq B, Casini A, Braeckman L, et al. The association between leisure time physical activity and coronary heart disease among men with different physical work demands: a prospective cohort study. Eur J Epidemiol. 2013;28(3):241–7. doi: 10.1007/s10654-013-9764-4. [DOI] [PubMed] [Google Scholar]
- 4.Lissner L, Bengtsson C, Bjorkelund C, Wedel H. Physical activity levels and changes in relation to longevity. A prospective study of Swedish women. Am J Epidemiol. 1996;143(1):54–62. doi: 10.1093/oxfordjournals.aje.a008657. [DOI] [PubMed] [Google Scholar]
- 5.Holtermann A, Mortensen OS, Burr H, Sogaard K, Gyntelberg F, Suadicani P. Physical demands at work, physical fitness, and 30-year ischaemic heart disease and all-cause mortality in the Copenhagen Male Study. Scand J Work Environ Health. 2010;36(5):357–65. doi: 10.5271/sjweh.2913. [DOI] [PubMed] [Google Scholar]
- 6.Holtermann A, Burr H, Hansen JV, Krause N, Sogaard K, Mortensen OS. Occupational physical activity and mortality among Danish workers. Int Arch Occup Environ Health. 2012;85(3):305–10. doi: 10.1007/s00420-011-0668-x. [DOI] [PubMed] [Google Scholar]
- 7.Boschman JS, van der Molen HF, Sluiter JK, Frings-Dresen MH. Occupational demands and health effects for bricklayers and construction supervisors: A systematic review. Am J Ind Med. 2011;54(1):55–77. doi: 10.1002/ajim.20899. [DOI] [PubMed] [Google Scholar]
- 8.Arndt V, Rothenbacher D, Brenner H, Fraisse E, Zschenderlein B, Daniel U, et al. Older workers in the construction industry: results of a routine health examination and a five year follow up. Occup Environ Med. 1996;53(10):686–91. doi: 10.1136/oem.53.10.686. [DOI] [PMC free article] [PubMed] [Google Scholar]
- 9.Brenner H, Ahern W. Sickness absence and early retirement on health grounds in the construction industry in Ireland. Occup Environ Med. 2000;57(9):615–20. doi: 10.1136/oem.57.9.615. [DOI] [PMC free article] [PubMed] [Google Scholar]
- 10.Arndt V, Rothenbacher D, Daniel U, Zschenderlein B, Schuberth S, Brenner H. Construction work and risk of occupational disability: a ten year follow up of 14,474 male workers. Occup Environ Med. 2005;62(8):559–66. doi: 10.1136/oem.2004.018135. [DOI] [PMC free article] [PubMed] [Google Scholar]
- 11.U.S. Bureau of Labor Statistics. Survey of Occupational Injuries and Illnesses. 2010 [Google Scholar]
- 12.The Center for Construction Research and Training. Construction Chart Book. 2013 [Google Scholar]
- 13.Sorensen G, Barbeau EM. Integrating occupational health, safety and worksite health promotion: opportunities for research and practice. Med Lav. 2006;97(2):240–57. [PubMed] [Google Scholar]
- 14.Gram B, Holtermann A, Sogaard K, Sjogaard G. Effect of individualized worksite exercise training on aerobic capacity and muscle strength among construction workers - a randomized controlled intervention study. Scand J Work Environ Health. 2012;38(5):467–75. doi: 10.5271/sjweh.3260. [DOI] [PubMed] [Google Scholar]
- 15.Gram B, Holtermann A, Bultmann U, Sjogaard G, Sogaard K. Does an exercise intervention improving aerobic capacity among construction workers also improve musculoskeletal pain, work ability, productivity, perceived physical exertion, and sick leave?: a randomized controlled trial. J Occup Environ Med. 2012;54(12):1520–6. doi: 10.1097/JOM.0b013e318266484a. [DOI] [PubMed] [Google Scholar]
- 16.Viester L, Verhagen EA, Proper KI, van Dongen JM, Bongers PM, van der Beek AJ. VIP in construction: systematic development and evaluation of a multifaceted health programme aiming to improve physical activity levels and dietary patterns among construction workers. BMC Public Health. 2012;12:89. doi: 10.1186/1471-2458-12-89. [DOI] [PMC free article] [PubMed] [Google Scholar]
- 17.Chinapaw MJ, Slootmaker SM, Schuit AJ, van Zuidam M, van Mechelen W. Reliability and validity of the Activity Questionnaire for Adults and Adolescents (AQuAA) BMC Med Res Methodol. 2009;9:58. doi: 10.1186/1471-2288-9-58. [DOI] [PMC free article] [PubMed] [Google Scholar]
- 18.Celis-Morales CA, Perez-Bravo F, Ibanez L, Salas C, Bailey ME, Gill JM. Objective vs. self-reported physical activity and sedentary time: effects of measurement method on relationships with risk biomarkers. PLoS One. 2012;7(5):e36345. doi: 10.1371/journal.pone.0036345. [DOI] [PMC free article] [PubMed] [Google Scholar]
- 19.Barrero LH, Katz JN, Perry MJ, Krishnan R, Ware JH, Dennerlein JT. Work pattern causes bias in self-reported activity duration: a randomised study of mechanisms and implications for exposure assessment and epidemiology. Occup Environ Med. 2009;66(1):38–44. doi: 10.1136/oem.2007.037291. [DOI] [PMC free article] [PubMed] [Google Scholar]
- 20.Clays E, De Bacquer D, Van Herck K, De Backer G, Kittel F, Holtermann A. Occupational and leisure time physical activity in contrasting relation to ambulatory blood pressure. BMC Public Health. 2012;12:1002. doi: 10.1186/1471-2458-12-1002. [DOI] [PMC free article] [PubMed] [Google Scholar]
- 21.Freedson PS, Melanson E, Sirard J. Calibration of the Computer Science and Applications, Inc. accelerometer. Med Sci Sports Exerc. 1998;30(5):777–81. doi: 10.1097/00005768-199805000-00021. [DOI] [PubMed] [Google Scholar]
- 22.Troiano RP, Berrigan D, Dodd KW, Masse LC, Tilert T, McDowell M. Physical activity in the United States measured by accelerometer. Med Sci Sports Exerc. 2008;40(1):181–8. doi: 10.1249/mss.0b013e31815a51b3. [DOI] [PubMed] [Google Scholar]
- 23.Haskell WL, Lee IM, Pate RR, Powell KE, Blair SN, Franklin BA, et al. Physical activity and public health: updated recommendation for adults from the American College of Sports Medicine and the American Heart Association. Med Sci Sports Exerc. 2007;39(8):1423–34. doi: 10.1249/mss.0b013e3180616b27. [DOI] [PubMed] [Google Scholar]
- 24.U.S. Department of Health & Human Services. 2008 Physical Guidelines for Americans. U.S. Department of Health & Human Services; [Google Scholar]
- 25.Glazer NL, Lyass A, Esliger DW, Blease SJ, Freedson PS, Massaro JM, et al. Sustained and shorter bouts of physical activity are related to cardiovascular health. Med Sci Sports Exerc. 2013;45(1):109–15. doi: 10.1249/MSS.0b013e31826beae5. [DOI] [PMC free article] [PubMed] [Google Scholar]
- 26.Borg G. Psychophysical scaling with applications in physical work and the perception of exertion. Scand J Work Environ Health. 1990;16:55–8. doi: 10.5271/sjweh.1815. [DOI] [PubMed] [Google Scholar]
- 27.Centers for Disease Control and Prevention; Prevention CfDCa, editor. Behavioral Risk Factor Surveillance System. 2009. [Google Scholar]
- 28.Fisk JD, Doble SE. Construction and validation of a fatigue impact scale for daily administration (D-FIS) Qual Life Res. 2002;11(3):263–72. doi: 10.1023/a:1015295106602. [DOI] [PubMed] [Google Scholar]
- 29.Dennerlein JT, Hopcia K, Sembajwe G, Kenwood C, Stoddard AM, Tveito TH, et al. Ergonomic practices within patient care units are associated with musculoskeletal pain and limitations. Am J Ind Med. 2012;55(2):107–16. doi: 10.1002/ajim.21036. [DOI] [PMC free article] [PubMed] [Google Scholar]
- 30.Hudak PL, Amadio PC, Bombardier C. Development of an upper extremity outcome measure: the DASH (disabilities of the arm, shoulder and hand) [corrected]. The Upper Extremity Collaborative Group (UECG) Am J Ind Med. 1996;29(6):602–8. doi: 10.1002/(SICI)1097-0274(199606)29:6<602::AID-AJIM4>3.0.CO;2-L. [DOI] [PubMed] [Google Scholar]
- 31.Haskell WL, Leon AS, Caspersen CJ, Froelicher VF, Hagberg JM, Harlan W, et al. Cardiovascular benefits and assessment of physical activity and physical fitness in adults. Med Sci Sports Exerc. 1992;24(6 Suppl):S201–20. [PubMed] [Google Scholar]
- 32.Caspersen CJ, Powell KE, Christenson GM. Physical activity, exercise, and physical fitness: definitions and distinctions for health-related research. Public Health Rep. 1985;100(2):126–31. [PMC free article] [PubMed] [Google Scholar]
- 33.Groeneveld IF, Proper KI, van der Beek AJ, Hildebrandt VH, van Mechelen W. Short and long term effects of a lifestyle intervention for construction workers at risk for cardiovascular disease: a randomized controlled trial. BMC Public Health. 2011;11:836. doi: 10.1186/1471-2458-11-836. [DOI] [PMC free article] [PubMed] [Google Scholar]
- 34.Van der Beek AJ, Braam IT, Douwes M, Bongers PM, Frings-Dresen MH, Verbeek JH, et al. Validity of a diary estimating exposure to tasks, activities, and postures of the trunk. Int Arch Occup Environ Health. 1994;66(3):173–8. doi: 10.1007/BF00380776. [DOI] [PubMed] [Google Scholar]
- 35.Unge J, Hansson GA, Ohlsson K, Nordander C, Axmon A, Winkel J, et al. Validity of self-assessed reports of occurrence and duration of occupational tasks. Ergonomics. 2005;48(1):12–24. doi: 10.1080/00140130412331293364. [DOI] [PubMed] [Google Scholar]
- 36.Umukoro PE, Arias OE, Stoffel SD, Hopcia K, Sorensen G, Dennerlein JT. Physical Activity at Work Contributes Little to Patient Care Workers’ Weekly Totals. J Occup Environ Med. 2013;55:S63–S68. doi: 10.1097/JOM.0000000000000046. [DOI] [PubMed] [Google Scholar]
- 37.Matthew CE. Calibration of accelerometer output for adults. Med Sci Sports Exerc. 2005;37(11 Suppl):S512–22. doi: 10.1249/01.mss.0000185659.11982.3d. [DOI] [PubMed] [Google Scholar]
- 38.Chau JY, Van Der Ploeg HP, Dunn S, Kurko J, Bauman AE. Validity of the occupational sitting and physical activity questionnaire. Med Sci Sports Exerc. 2012;44(1):118–25. doi: 10.1249/MSS.0b013e3182251060. [DOI] [PubMed] [Google Scholar]
- 39.Reis JP, Dubose KD, Ainsworth BE, Macera CA, Yore MM. Reliability and validity of the occupational physical activity questionnaire. Med Sci Sports Exerc. 2005;37(12):2075–83. doi: 10.1249/01.mss.0000179103.20821.00. [DOI] [PubMed] [Google Scholar]
- 40.Kwak L, Hagstromer M, Sjostrom M. Can the IPAQ-long be used to assess occupational physical activity? J Phys Act Health. 2012;9(8):1130–7. doi: 10.1123/jpah.9.8.1130. [DOI] [PubMed] [Google Scholar]
- 41.Sparer EH, Murphy LA, Taylor KM, Dennerlein JT. Correlation between safety climate and contractor safety assessment programs in construction. Am J Ind Med. 2013;56(12):1463–72. doi: 10.1002/ajim.22241. [DOI] [PMC free article] [PubMed] [Google Scholar]