

Abstract
Retroviral integration is catalyzed by a tetramer of integrase (IN) assembled on viral DNA ends in a stable complex, known as the intasome1,2. How the intasome interfaces with chromosomal DNA, which exists in the form of nucleosomal arrays, is currently unknown. Here we show that the prototype foamy virus (PFV) intasome is proficient at stable capture of nucleosomes as targets for integration. Single-particle cryo-electron microscopy (EM) reveals a multivalent intasome-nucleosome interface involving both gyres of nucleosomal DNA and one H2A-H2B heterodimer. While the histone octamer remains intact, the DNA is lifted from the surface of the H2A-H2B heterodimer to allow integration at strongly preferred superhelix location (SHL) ±3.5 positions. Amino acid substitutions disrupting these contacts impinge on the ability of the intasome to engage nucleosomes in vitro and redistribute viral integration sites on the genomic scale. Our findings elucidate the molecular basis for nucleosome capture by the viral DNA recombination machinery and the underlying nucleosome plasticity that allows integration.
Retroviral INs and related transposases severely deform target DNA (tDNA) to gain access to the scissile phosphodiester bonds3,4. Given limited accessibility and constraints imposed on conformation of DNA, the nucleosomal structure5 should be expected to impede integration. Yet, mounting evidence indicates that retroviruses and some yeast retrotransposons integrate into nucleosomes6-12. Recombinant PFV IN affords assembly of all key intermediates of retroviral integration2,3,13,14 presenting hitherto unprecedented experimental approaches to probe interactions between the viral machinery and its cellular partners. The PFV intasome displayed robust strand transfer activity when supplied with mononucleosomes prepared from human chromatin or the recombinant W601 nucleosome previously described by Lowary and Widom15. The reaction yielded two major types of DNA products (L and S) consistent with concerted integration into the exposed major groove at nucleosomal SHL±3.5 positions, separated from the dyad by 3.5 turns of DNA helix (∼36 bp, Fig. 1a, Extended Data Fig. 1a-c). In contrast, integration into deproteinized nucleosomal DNA was far less efficient and lacked pronounced hotspots (Fig. 1a, Extended Data Fig. 1c).Nucleosomes could be pulled-down by biotinylated intasome on streptavidin agarose under a range of salt concentrations in the absence of divalent metal cofactors, which are essential for IN enzymatic activity. The substitution A188D in IN suppressed the interaction, confirming involvement of the intasomal tDNA-binding groove in nucleosome capture (Extended Data Fig. 2a)3.
Figure 1. Nucleosome capture by the PFV intasome.
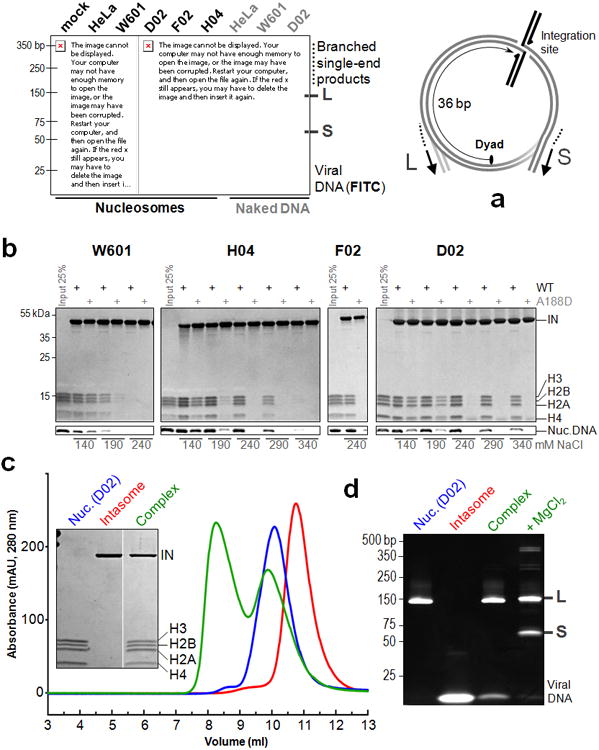
a , Integration into HeLa-derived or recombinant (W601, H04, D02 or F02) core nucleosomes or naked DNA. Fluorescein-labeled intasomal DNA and reaction products were separated by PAGE and detected by fluorescence scanning. The major long (L, ∼127 bp) and short (S, ∼56 bp) products, result from concerted strand transfer at nucleosomal SHL±3.5 positions, which are separated from the dyad by 3.5 turns of DNA helix or 36 bp. The products include viral DNA joined to nucleosomal DNA fragments (Extended Data Fig. 1b); b, Pull-down of recombinant nucleosomes with biotinylated intasome in the presence of variable NaCl concentrations; where indicated, the intasome was assembled with A188D IN. Bound material, separated in SDS-PAGE gels, was stained to detect proteins (IN, H3, H2A, H2B and H4) and nucleosomal DNA (Nuc. DNA); c, Isolation of the intasome - D02 nucleosome complex by size exclusion chromatography. Peak fractions of intasome (red trace), D02 nucleosome (blue) and the complex (green) were separated by SDS-PAGE (inset); d, DNAs from D02 nucleosome, intasome, as well as the intasome-nucleosome complex before and after incubation with 5 mM MgCl2 were separated by PAGE and detected with GelRed.
To identify a nucleosome suitable for structural studies in complex with the intasome, we isolated human nucleosomes captured by the intasome in the presence of 290 mM NaCl (Extended Data Fig. 2b). Three individual nucleosomal DNA fragments recovered in this experiment were assembled with recombinant human histones (Extended Data Fig. 1a, 2c). While displaying the common PFV integration hotspots at SHL±3.5 positions (Fig. 1a, Extended Data Fig. 1d), the selected nucleosomes D02, F02 and H04 bound the intasome under considerably more stringent conditions compared to W601 (Fig. 1b), a property that depended on nucleosome structure (Extended Data Fig. 2d). Lower thermal stability of the selected nucleosomes (Extended Data Fig. 3) suggests enhanced flexibility, which may aid in the conformational adaptation required for intasome binding (see below). The D02 nucleosome afforded isolation of a stable complex with the intasome, which upon incubation with 5 mM Mg2+ converted into the strand transfer complex with integrated viral DNA ends (Fig. 1c, d). DNA sequencing analysis of the resulting products revealed integration into a single site, offset from the middle of the D02 DNA by 36 bp, indicating that the complexes comprised of the dyad-related nucleosomal site dissociated during purification (Extended Data Fig. 1d).
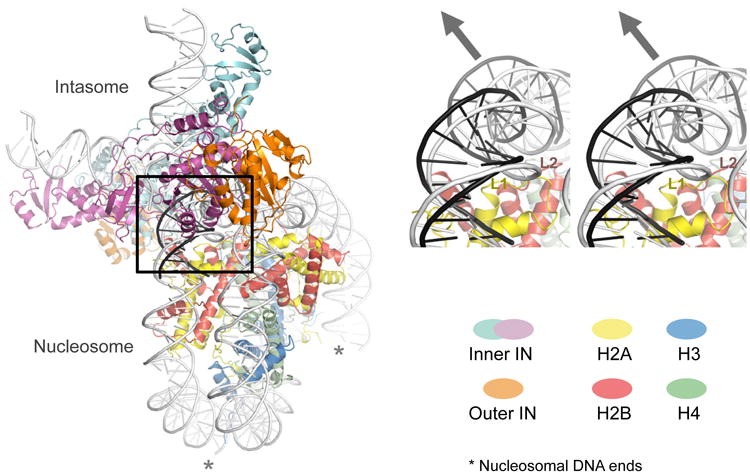
To determine the structure of the 400-kDa intasome-D02 nucleosome complex prior to strand transfer, we acquired single-particle cryo-EM data. The resulting electron density map, calculated to 7.8 Å resolution (Extended Data Fig. 4), allowed unambiguous docking of the intasome2,3 and the nucleosome5,16 crystal structures (Fig. 2a). The intasome contains a homotetramer of IN made of two types of subunits. The inner IN chains provide catalytic function, synapse the viral DNA ends and form the tDNA-binding groove. The function of the outer IN subunits, which attach to the inner subunits via the canonical catalytic core domain (CCD) dimerization interface2,17, has been unclear. The path of the viral and nucleosomal DNA backbone, the histone octamer and the inner subunits of the IN tetramer are well defined in the electron density map (Fig. 2a, 3a, Supplementary Video 1).
Figure 2. Structure of the intasome-nucleosome complex.

a, Segmented electron density map as semi-transparent surface with docked intasome and nucleosome structures shown as ribbons. H2B, the N-terminal tail of H2A (H2A-N), the CTD and one of the CCD dimers are indicated; b, Nucleosomal DNA within the tDNA-binding cleft of the intasome. DNA conformations as in available nucleosome structures (left) and as in the crystals of the PFV target capture complex (right) produce local electron density cross-correlation scores of 0.36 and 0.70, respectively.
Figure 3. Mutagenesis of the intasome-nucleosome interface.
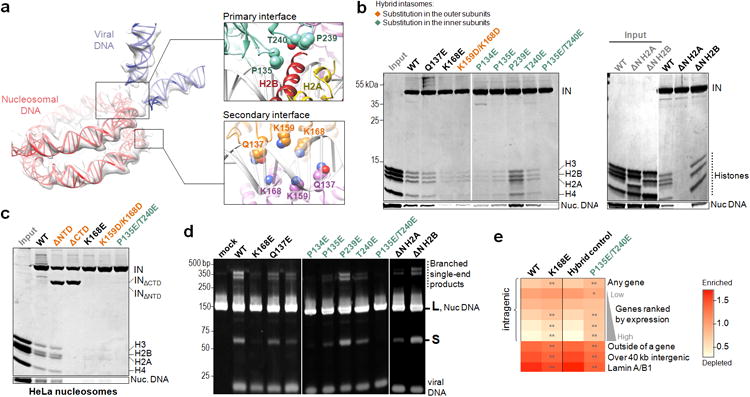
a , DNA component of the complex. The insets show pertinent details of the interface, with selected IN amino acid residues as spheres; b, Pull-down of H04 nucleosomes assembled with WT or variant (ΔN H2A or ΔN H2B, lacking residues 1-12 or 1-23, respectively) histones with biotinylated intasomes at 240 mM (left panel) or 290 mM NaCl (right panel). Substitutions in hybrid PFV intasomes were restricted to the outer subunits or inner IN subunits (indicated in orange and cyan font, respectively); c, Pull-down of HeLa nucleosomes with biotinylated intasomes at 240 mM NaCl; d, Reactivity of intasome variants with W601 nucleosome assembled with WT or variant histones. DNA products, separated by PAGE, were detected with GelRed; e, Heat map of relative integration frequencies. Each row represents a specific feature characteristic of the targeted genomic region. The color scale indicates whether a feature is enriched (red) or depleted (light orange) compared to the in vitro control. Each column represents a PFV vector variant tested: WT, K168E, hybrid control (vector produced using a combination of K120E and D273K/D185N/E221Q pcoP-POL packaging vectors encoding functional inner and catalytically incompetent outer IN subunits, respectively) or P135E/T240E (the substitutions introduced into the inner subunits in the hybrid control background). Asterisks indicate significant departures of the mutants from their respective controls (χ2 test: *P< 0.01, **P< 10-5).
The cryo-EM structure reveals an extensive intasome-nucleosome interface, involving three IN subunits, both gyres of the nucleosomal DNA and one H2A-H2B heterodimer (Fig. 2a, Supplementary Video 1). The tDNA-binding groove of the intasome engages nucleosomal DNA above one of the H2A-H2B histone heterodimers, in agreement with the location of the preferred integration site. The path of DNA captured within the tDNA-binding groove of the intasome strongly deviates from that in the structure of free nucleosome (Fig. 2b). Here, DNA is deformed and lifted by ∼7 Å from the surface of the H2A-H2B heterodimer to adopt a conformation strikingly matching the sharply bent naked tDNA in crystals of the PFV target capture complex3 (Fig. 2b, Extended Data Fig. 5, Supplementary Video 1). Notably, the H2A L1-loop directly underlying the integration site is a hotspot for structural variability within the histone core18. Thus, the segment of nucleosomal DNA preferentially targeted by the intasome may be particularly malleable to conformational adaptation. The interface is extended by ancillary contacts on both sides of the tDNA-binding groove. A triad of loops belonging to the inner IN subunits cradle the C-terminal helix of H2B (Fig. 2a). On the other side, the intasome leans against the second gyre of nucleosomal DNA, using a saddle-shaped surface of the CCD-CCD interface (Fig. 2a, 3a, Secondary interface). These interactions may compensate for the requirement to deform DNA beyond its ground state on the nucleosome. An early study, albeit using undefined integrase-DNA complexes, implicated SHL±3.5 and SHL±1.5 positions as sites for HIV-1 integration into nucleosomes8. Thus, some of the nucleosomal locations may be virus species dependent, perhaps directed by interactions between integrase and specific histone heterodimers.
Next, we introduced amino acid substitutions into the relevant regions of PFV IN and evaluated the ability of resulting intasomes to engage nucleosomes in vitro. Some substitutions were engineered selectively into the inner or the outer subunits of the intasome using a pair of IN variants K120E and D273K that co-assemble into hybrid intasomes through restricted localization to the inner and the outer subunit, respectively (Extended Data Fig. 6a-c). IN residues Gln137, Lys168 and Lys159 are located in the vicinity of the contacts with the second gyre of nucleosomal DNA, while Pro135, Pro239 and Thr240 approach the C-terminal helix of H2B (Fig. 3a). Substitutions at these positions affect the ability of the intasome to engage nucleosomes to various degrees. In particular, K168E in the inner and outer subunits or the double substitution P135E/T240E in the inner subunits grossly affected the interaction with recombinant and native human nucleosomes (Fig. 3b, c). The same substitutions reduced the ability of the intasome to integrate into W601 nucleosome (Fig. 3d), while importantly preserving strand transfer activity into naked plasmid DNA (Extended Data Fig. 6d).
To assess the importance of the observed interactions under conditions of viral infection, we used a PFV vector system with a GFP reporter (Extended Data Fig. 7a) 19. Initially, we mapped the genomic positions of 153,447 unique integration events of wild-type (WT) vector in human epithelial HT1080 cells. As a reference dataset, we determined ∼2.2 million integration sites using purified PFV intasomes and deproteinized human DNA. In agreement with published observations20,21, PFV disfavored transcription units: 32% of integration sites were found in RefSeq genes, which is ∼16% below the gene targeting frequency in the reference dataset (P≪10-300; Fig. 3e, Extended Data Table 1). Ranking transcription units by their activity in HT1080 cells, we discovered that PFV integration strongly contrasted with local transcriptional activity (P≪10-300; Fig. 3e). Furthermore, integration sites accumulated within gene-poor and lamin-A/B associated genomic regions22, indicating a strong bias towards condensed perinuclear heterochromatin (Fig. 3e, Extended Data Table 1).
PFV vectors incorporating K168E IN or P135E/T240E IN as the inner subunit of the intasome displayed 2-4 fold defects in their ability to stably transduce HT1080 cells, while still strongly outperforming matched controls harboring catalytically-inert IN variants (Extended Data Fig. 7b-d). The residual infectivity allowed the mapping of 14,872 and 10,148 unique integration sites of K168E and P135E/T240E IN vectors, respectively. In accord with their location outside of the tDNA-binding groove of the intasome, the mutations did not affect the weak sequence bias at the sites of integration (Extended Data Fig. 8). However, the mutations strongly corrupted the ability of the virus to discriminate against highly expressed genes, also leading to a modest but highly significant reduction in integration into gene-poor, lamina-associated regions (Fig. 3e, Extended Data Table 1). These observations are consistent with the importance of the intasome-nucleosome interactions observed in our structure for integration into condensed heterochromatin, normally preferred by PFV. Nucleosomes within transcriptionally active chromatin display the highest rate of remodeling and turnover, undergoing partial or complete disassembly to allow passage of RNA polymerase23,24. Transient destabilization of the nucleosome arrays within highly expressed genes would provide a window of opportunity for the mutant viral intasomes.
In addition to the contacts involving structured regions of the intasome and the nucleosome, their flexible domains also contribute to the interaction. Segmentation of the cryo-EM map reveals a tubular density that likely represents the N-terminal tail of H2A reaching out to the C-terminal domain (CTD) domain of one of the inner IN subunits (Fig. 2a). Concordantly, deletion of the H2A but not H2B N-terminal tail reduced intasome binding and strand transfer into nucleosomes (Fig. 3b, d). Moreover, deletion of the outer subunit NTDs and CTDs, which were unresolved in the prior crystal structures2,3,13,14,25 and in our averaged cryo-EM density (Fig. 2a), reduced the ability of the intasome to pull-down nucleosomes (Extended Data Fig. 2a). Further mutagenesis revealed a role of the outer CTDs (Fig. 3c), possibly through promiscuous interactions of the positively charged domains with nucleosomal DNA. Using the nucleosomal structure as a landing platform may allow the viral machinery to sense epigenetic marks as well as provide surface for recruitment of chromatin remodelers for disassembly of the post-catalytic strand transfer complex.
Methods
PFV intasome assembly
PFV IN was expressed in bacteria and purified as previously described26. Synthetic DNA oligonucleotides used for intasome assembly were HPLC-purified (Midland Certified). For pull-downs, activity assays and electron microscopy studies, PFV intasomes were assembled with stabilized processed U5 DNA (ref. 27) obtained by annealing oligonucleotides 5′-TGCGAAATTCCATGACA (transferred strand) and 5′-ATTGTCATGGAATTTCGCA. For experiments involving biotin pull-downs or in-gel fluorescent detection of strand transfer products, the transferred strand oligonucleotide was synthetized with 5′triethylene glycol biotin or fluorescein, respectively. To allow compatibility with the linker-mediated PCR protocols, a longer donor DNA construct spanning 47 bp of processed PFV U5 end and made by annealing oligonucleotides 5′- GATGTAACTCCTTAGGATAATCAATATACAAAATTCCATGACA and 5′-ATTGTCATGGAATTTTGTATATTGATTATCCTAAGGAGTTACATC, and this was used to generate in vitro genomic integration sites.
The intasomes were assembled according to published procedures2,27, by dialyzing 120 μM PFV IN and 50 μM donor DNA duplex combined in 500 mM NaCl and 50 mM BisTrispropane-HCl, pH 7.45 against excess low-salt buffer containing 200 mM NaCl, 20 mM BisTris propane-HCl, pH 7.45, 2 mM dithiothreitol (DTT) and 25 μM ZnCl2 for 16 h at 18 °C. For hybrid intasome assembly, 60 μM each IN variant (K120E and D273K) was used. The intasomes were purified by size-exclusion chromatography through a 10/300 GL Superdex-200HR column (GE Healthcare) in 20 mM BisTris propane-HCl, pH 7.45, 320 mM NaCl and kept on ice for immediate use.
Preparation of native human mononucleosomes
Native human mononucleosomes were prepared according to established protocols28 with minor modifications. HeLa cells were lysed in 1.5 mM MgCl2, 10 mM KCl, 0.5 mM DTT, 0.5 mM phenylmethanesulfonylfluoride (PMSF), 10 mM Hepes-NaOH, pH 7.9using a 40-ml Dounce homogenizer (Wheaton). Nuclei, harvested by gentle centrifugation, weredigested with 0.5 U/ml micrococcal nuclease (Sigma-Aldrich) in 4 volumes 0.34 M sucrose, 3 mM CaCl2, 60 mM KCl, 0.5 mM PMSF and 50 mM Tris-HCl, pH 7.5for 10 min at 37 °C. The reaction was stopped with 50 mM EDTA, and the nucleosomes, extracted by addition of 0.5 M NaCl, were dialyzed overnight at 4 °C against 650 mM NaCl, 2 mM EDTA, 1 mM β-mercaptoethanol, and 20 mM Hepes, pH 7.4. Nucleosomes were isolated by size exclusion chromatography through a Superdex-200 column operated in 650 mM NaCl, 1 mM EDTA and 20 mM Tris-HCl, pH 7.5.For the use in strand transfer assays (Fig. 1a), nativenucleosomes, purified by size exclusion chromatography and dialyzed overnight against 100 mM NaCl, 1 mM EDTA and 20 mM Tris-HCl, pH 7.5, were separated by native 8% PAGE in a Model-491 preparative cell (Bio-Rad Laboratories). Nucleosomes were concentrated to 3 mg/ml using Vivaspin devices (GE Healthcare) and stored on ice.
Assembly of recombinant nucleosomes
DNA fragments for recombinant nucleosome assembly were generated by PCR using in-house produced Pfu polymerase and a DNA Engine Tetrad-2 thermal cycler (BioRad Laboratories). DNA products, pooled from four or eight 96-well PCR plates (100 μl reaction per well), were concentrated by precipitation with ethanol, re-dissolved in 1 mM EDTA and 5 mM Tris-HCl, pH 8.0 and injected into a 1-ml column packed with POROS-HQ 50 μm resin (Life Technologies). After extensive wash with salt-free buffer, DNA was eluted with a linear 0-2 M NaCl gradient in 5 mM Tris-HCl, pH 8.0. The fractions containing the PCR fragment were pooled and concentrated by ethanol precipitation. The procedure allows production of virtually any nucleosome-size DNA fragment on mg scale. Human H2A, H3 and H4 histones, expressed in bacteria in inclusion bodies, were purified as previously described29. Human H2B was expressed with an N-terminal hexahistidine tag, which was removed prior to histone octamer refolding. Nucleosomes,assembled by dialysis were purified using native 8% PAGE and heat re-positioned by incubation at 37 °C for 30 min, as previously described (Extended Data Fig. 1a)29.
Biotin pull-down assays
Ten μg biotinylated intasome was allowed to bind 10 μg recombinant or native nucleosomes in 700 μlof pull-down buffer (140-340 mM NaCl, 10 % glycerol, 1 mM DTT 0.1 % Nonidet P-40 and 50 mM BisTrispropane-HCl, pH 7.45), in the presence of 20 μl of streptavidin agarose (Life Technologies). After incubation for 2 h of end-over-rocking at 4 °C, the resin was washed in 5 changes of 700 μl pull-down buffer. Bound nucleoprotein complexes, dissociated by incubating the resin in 30 μl of 1.3× Laemmli SDS sample buffer at 37 °C for 5 min, were analyzed by electrophoresis in 18% SDS PAGE gels (Life Technologies). Proteins and DNA were detected by staining the gels with Coomassie instant blue and GelRed (Biotium), respectively.
To generate a library of nucleosomal DNA fragments enriched in tighter intasome binders, a biotin pull-down experiment setup with a 10-fold excess of nucleosomes in the presence of 290 mM NaCl. The DNA component of recovered nucleosomal fraction was treated with S1 nuclease and calf intestinal phosphatase (New England Biolabs). Blunt-ended and dephosphorylated DNA was incubated with Taq Polymerase to add deoxyadenosine to 3′ ends for cloning into pCR4-TOPO (Life Technologies). Individual clones were sequenced using M13 forward primer.
Strand transfer assays
Reactions were carried out using intasomes purified by size exclusion chromatography. A standard reaction contained 1.25 μg of intasome and 5 μg of nucleosome in 300 μl of 240 mM NaCl, 5 mM MgCl2, 1 mM DTT, 4 μM ZnCl2, 25 mM BisTris propane-HCl, pH 7.45. Strand transfer was allowed to proceed for 15 min at 37 °C, and the reaction was stopped by addition of 0.5% SDS and 25 mM EDTA. DNA products, deproteinized by digestion with 30 μg proteinase K at 37 °C for 1 h and ethanol precipitation, were separated in 4-12% TBE PAGE gels. Fluorescein-labeled DNA was detected using a Typhoon TRIO fluorescence scanner (GE Healthcare); non-labeled DNA was visualized by staining with GelRed. Strand transfer assays using naked supercoiled plasmid target DNA was done according to published procedures2.
Nucleosome thermal denaturation assays
The heat denaturation assays were done in a CFX96 real-time detection system (Bio-Rad Laboratories) using Sypro Orange (Life Technologies, distributed by as 5,000× stock solution). Five μg nucleosome in 150 mM NaCl, 25 mM Tris-HCl, pH 7.5, supplemented with 2.5× Sypro Orange in a final volume of 100 μl was heated from 20 to 95 °C with a 30-sec hold every 0.5 °C, following which fluorescence was recorded (excitation at 523 nm and detection at 564 nm). Melting temperatures were determined using CFX manager software from the first derivative of the signal curve.
Preparation of intasome-nucleosome complex for EM
The complex, assembled by incubating 200 μg PFV intasome and 200 μg D02 nucleosome in 300 μl of 320 mM NaCl, 20 mM BisTris propane, pH 7.45 for 20 min at room temperature, was purified by size exclusion chromatography over a Superdex-200HR 10/300 column in 320 mM NaCl, 25 mM BisTris propane-HCl, pH 7.45. Fractions containing the complex were immediately used to prepare EM grids.
Negative-stain single-particle analysis
Negative stain EM grids were prepared as follows. Carbon was evaporated onto freshly cleaved mica using a Q150TE coater (Quorum Technologies) and baked for two hours at 50° before floating onto 400-mesh copper grids (Agar Scientific). Dry continuous carbon grids were glow discharged for 30s at 45 mA using a 100× glow discharger (Electron Microscopy Sciences). A 4-μl drop of sample was applied onto the glow-discharged grid immediately after elution from the gel filtration column. The grid was sequentially laid on top of four distinct 75 μl drops of a 2% (w/v) uranylformate solution, stirred for 10 s, before blotting to dryness and stored at room temperature before imaging. Negative stain grids were screened on a G2 Spirit LaB6 microscope (FEI) and data were collected on a JEOL-2100 LaB6 electron microscope (JEOL) operated at 200 kV. Images were recorded at a nominal magnification of 50,000× on a Ultrascan 4k × 4k CCD camera (Gatan), resulting in a 2.2 Å pixel size at the specimen level. A total of 135 micrographs were collected with a 1 to 2 μm defocus and using 20 e-/Å2. Contrast transfer function (CTF) estimation was performed with CTF Find 3 (ref. 30) and micrographs were phase-flipped using Bsoft (ref. 31). Reference free two‐dimensional averages were calculated using routine MSA/MRA IMAGIC protocols32. The initial three-dimensional model was determined starting from a sphere, and further refined with multi-model projection-matching approaches using libraries from the EMAN2and SPARXpackages33,34 (Extended Data Fig.9).
Cryo-EM structure determination
A 4-μl sample drop was applied to plasma cleaned C-Flat grids (400 mesh CF-1/1, Electron Microscopy Sciences). After 1 min incubation, grids were double side blotted for 3.8 s in a CP3 cryo-plunger (Gatan) at 80% humidity and plunge frozen into -172°C liquefied ethane. Cryo-grids were screened for ice quality using a 914 side-entry cryo-holder (Gatan) on a JEOL-2100 LaB6 operated at 200 kV and equipped with an UltraScan 4k×4k CCD camera (Gatan).Cryo-grids were stored in liquid nitrogen and dry-shipped to the Netherlands Centre for Electron Nanoscopy (NeCEN, Leiden, The Netherlands). At NeCEN, cryo-grids were loaded into a Titan Krioselectron microscope (FEI) for automated data collection with the EPU software (FEI) over a period of 3 days. Images were recorded at a nominal magnification of 59,000× on Falcon direct electron detector. 1,479 micrographs were recorded using a -1.5/-3.5 μm defocus range with an electron dose of 40 e-/Å2. A first cryo-EM map was calculated starting from a subset of 16,702 particles manually picked from 157 micrographs using Xmipp software35. Multimodel refinement protocols described above were employed to solve a 19.7Å resolution cryo-structure (based on 6,057 particles), using the 60-Å low-pass filtered negative stain volume as a starting model. A complete, 333,545-particle dataset was generated after automated picking in Xmippon the best 932 micrographs, selected after inspection of the power spectrum. Contrast transfer function was estimated using CTFFIND3. All further processing was performed within the RELION 1.2 environment36. A first round of 2D classification was performed to discard poorly averaging particles, resulting in a cleaned 193,569-particle dataset. A 3D classification was subsequently performed using three classes and starting from the initial cryo-EM map; 83,500 particles belonging to the best 3D class was selected and subjected to one further round of 3D classification. This approach yielded an improved volume calculated from 53,887 particles. These particles were subsequently separated into 187 groups, based on their refined intensity scale-factor, and used in a final 3D refinement using the selected, 60-Å low-pass filtered 3d class as a starting model. The density map was corrected for the modulation transfer function (MTF) of the Falcon detector and sharpened by applying a -818 Å2 B factor, estimated automatically with the RELION post-processing function (Extended Data Fig. 4g). Final resolution after post-processing was 7.84 Å, according to the 0.143 cut-off criterion (Extended Data Fig. 4d). The handedness of the map was verified by inspection of the duplex DNA density. UCSF Chimera was used for automated rigid-body docking and generating figures and videos37.
PFV vector infections and integration site analysis
Single-cycle viruses were produced by co-transfection of HEK293T cells (Cell Services, London Research Institute) with pMD9 (GFP reporter PFV vector) and codon-optimized foamy virus GAG, POL and ENV packaging constructs, as previously described19,38. Hybrid PFV vectors and matched controls were pseudo typed with the less fusogenic macaque simian foamy virus envelope39, which allowed the use of higher virus inputs. Mutations were introduced into POL expression construct (pcoP-POL)19 by replacement of a BamHI/XbaI fragment spanning the IN coding region with respective mutant versions assembled by overlap-splicing PCR. Viruses were concentrated by centrifugation of cell-free supernatants through 20% sucrose cushion and re-suspended in phosphate buffered saline for immediate use. PFV GAG was detected in viral lysates using Western blotting with rabbit polyclonal antibodies40. HT1080 cells41, obtained from Cell Services of the London Research Institute, were cultured in Dulbecco's modified Eagle's medium supplemented with 10% fetal calf serum. The cells were infected with PFV vectors at a confluence of 20-30% and allowed to expand for 5-7 days to eliminate non-integrated viral DNA prior to cell sorting analyses and/or genomic DNA isolation. To generate in vitro integration sites, 10 μg deproteinized genomic DNA obtained from uninfected human cells was incubated with 0.8 μg PFV intasome in 1 ml of 125 mM NaCl, 10 mM MgCl2, 2 mM DTT, 20 μM ZnCl2, 25 mM BisTris propane, pH 7.45 for 30 min at 37 °C.
The protocol for linker-mediated PCR was adapted for amplification of PFV U5-genomic DNA junctions from published procedures42-44. Briefly, genomic DNA, digested with BfaI/BanII/CviQI, was ligated to an asymmetric linker made by annealing synthetic oligonucleotides 5′-TAGTCCCTTAAGCGGAG (with 3′ end blocked by an amino group modifier) and 5′-GTAATACGACTCACTATAGGGCNNNNNCTCCGCTTAAGGGAC (the string of random nucleotides comprise a serial number43, not relevant to this study). PFV U5 integration sites were PCR-amplified using primers 5′-CAAGCAGAAGACGGCATACGAGATCGGTCTCGGCATTCCTGCTGAACCGCTCTTCCGATCTGTAATACGACTCACTATAGGGC and 5′-GTGTGAACTACACTTATCTTAAATGATG followed by a nested PCR with primers 5′-CAAGCAGAAGACGGCATACGAGATCGGTCTCGGCATTCCTGCTGAACCGCTCTTCCGATCTGTAATACGACTCACTATAGGGC and 5′-AATGATACGGCGACCACCGAGATCTACACTCTTTCCCTACACGACGCTCTTCCGATCTXXXXXCTTAAATGATGTAACTCCTTAGGATAATCAATATAC (the string of underlined nucleotides marked with “X” denotes the position of a 5-base index, which was unique for each integration site library analyzed). The products were sequenced using MiSeqIllumina platform at the Dana-Farber Cancer Institute Molecular Biology Core Facilities.
The sequences of PFV U5-genomic DNA junctions were aligned to hg19 version of the human genome (http://genome.ucsc.edu/) using BLAT45 with settings -stepSize=6, -minIdentity=97 and -maxIntron=0. The output was filtered using a custom Python script to retain only unique, high-quality matches starting with the first nucleotide downstream of the processed U5 sequence CAAAATTCCATGACA. The genomic coordinates were converted to the standard browser extensible data (BED) format, with each interval reporting the center dinucleotide of a PFV integration site. Distributions of the integration sites with respect to genomic features (http://genome.ucsc.edu/cgi-bin/hgTables), HT1080-specific gene expression activity (gene expression omnibus accession code GSE58968)46 and lamina-associated domains (GSE22428)47, were analyzed using BEDtools software suite48. Nucleotide sequence logos were generated using WebLogo software (http://weblogo.threeplusone.com/)49.
Extended Data
Extended Data Figure 1. PFV integration into recombinant mono-nucleosomes.
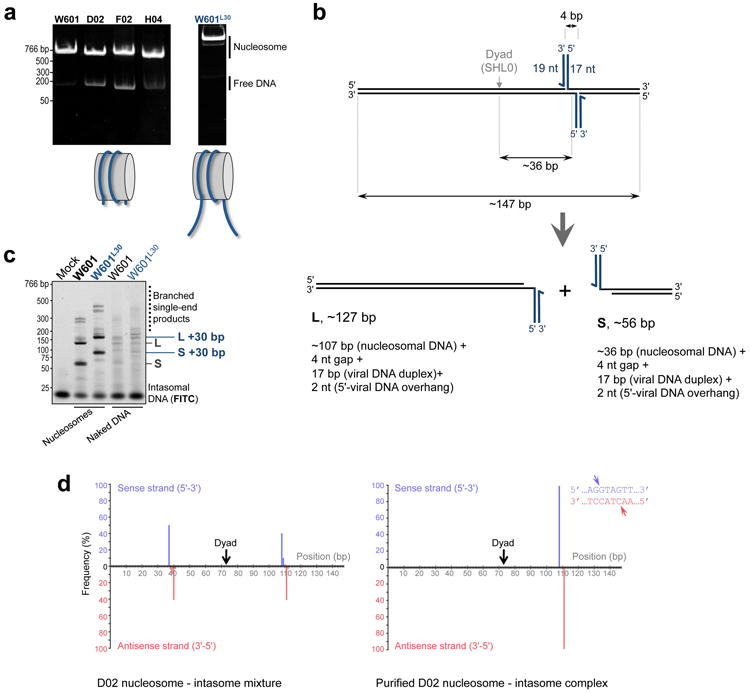
a, W601, D02, F02 and H04 nucleosome core particles (left) and W601 nucleosome with 30-bp tails mimicking linker DNA (W601L30, right) were separated by native PAGE and detected by staining with ethidium bromide; b, Major products of PFV integration into a nucleosome core particle. Concerted integration of intasomal oligonucleotides (blue lines) into discontinuous tDNA (black lines) produces pairs of strand transfer products containing viral DNA mimics joined to tDNA fragments via 4-bp gaps; c, PFV integration into nucleosome core particles (W601) and extended nucleosomes (W601L30). Fluorescein-labeled intasomal DNA and reaction products were separated by PAGE and detected by fluorescence scanning. Migration positions of the strand transfer products obtained with W601L30 nucleosome shift relative to those with the W601 core particle by ∼30 bp. Thus, linker DNA does not appear to influence integration; d, Positions of integration events on D02 nucleosomal DNA before (left) or after (right) purification of the complex. The histograms show relative frequencies of integration events along the D02 DNA fragment into the top (blue bars) or bottom (pink bars) strands. The inset shows the nucleotide sequence at the preferred integration site; arrowheads indicate precise positions of the major integration events into the top and bottom strands of D02 DNA.
Extended Data Figure 2. Pull-down of native nucleosomes and naked DNA by biotinylated PFV intasome.
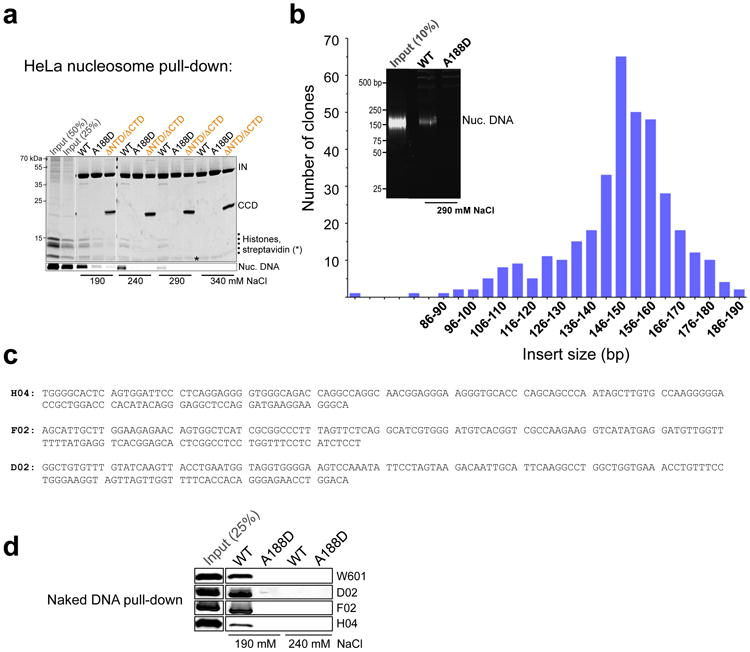
a, Mono-nucleosomes prepared by micrococcal nuclease digestion of HeLa cell chromatin were incubated with biotinylated intasomes under conditions of indicated ionic strength (190-240 mM NaCl). The intasomes used were WT, A188D or a hybrid intasome lacking the NTDs and CTDs on the outer subunit (indicated as ΔNTD/ΔCTD; see main text and Extended Data Fig. 6a-c for details of hybrid intasome design). The intasome-nucleosome complexes were isolated on streptavidin agarose and separated by SDS PAGE. Proteins and nucleosomal DNA were detected by staining with Coomassie Blue and GelRed, respectively. Two leftmost lanes contained 50% and 25% of input nucleosomes, as indicated. Migration positions of protein sizes standards (kDa) are shown to the left of the gel; b, Isolation of HeLa nucleosomes preferentially binding to the PFV intasome. Biotinylated WT or A188D intasomes were incubated with 10-fold excess HeLa nucleosomes in the presence of 290 mM NaCl. Nucleosomal DNA recovered with WT intasome was cloned into a bacterial vector; the histogram depicts distribution of nucleosomal insert sizes obtained in this experiment. The inset shows separation of deproteinized nucleosomal DNA from 10% of input nucleosome material and from the fractions recovered with WT and A188D intasomes; c, Nucleotide sequences of three human DNA fragments (H04, F02 and D02) recovered with the intasome and used to assemble recombinant nucleosomes in this work; d, Naked W601 D02, F02 or H04 DNA was incubated with biotinylated WT or A188D intasomes in the presence of 190 or 240 mM NaCl, as indicated DNA fractions recovered after pulled down on streptavidin beads were separated by PAGE and detected by staining with GelRed.
Extended Data Figure 3. Thermal denaturation of recombinant nucleosomes.
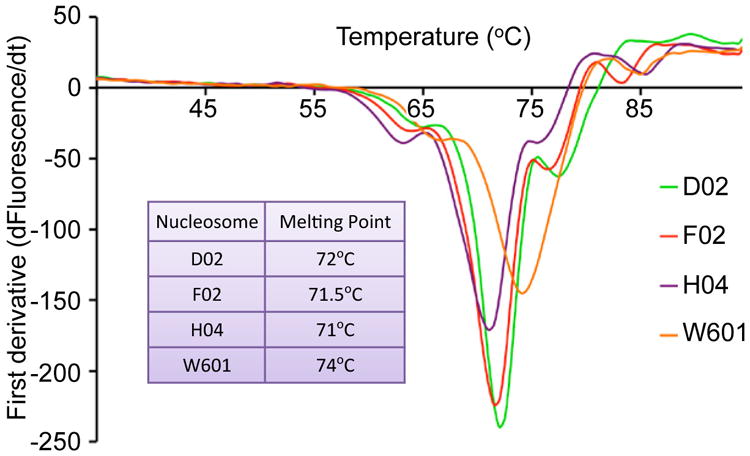
Derivative melt profiles of recombinant nucleosomes used in this study. The table in the inset shows experimentally determined melting temperatures.
Extended Data Figure 4. Overview of the cryo-EM data.

a, Representative micrograph of frozen hydrated intasome-nucleosome complex; b, Two-dimensional class averages (phase-flipped only; box size: 26 nm); c, Euler angle distribution of all particles included in the final three-dimensional reconstruction. Sphere size relates to particle number; d, Gold standard Fourier-shell correlation and resolution using the 0.143 criterion; e, Three-dimensional volume of the intasome-nucleosome complex refined with RELION; f, Match between reference free two dimensional class averages and 3D re-projections of the cryo-EM structure. 2D class averages of fully CTF corrected particles are matched with the re-projections of the refined 3D structure before map sharpening (post-processing); 30-6 Å band pass filter imposed; g, Overview of the 3D classification and structure refinement. The initial negative stain structure was used for one round of structure refinement using a smaller cryo dataset. The resulting map was used as a starting model for one round of 3D classification (three classes) on a complete cryo dataset. Particles from the two most populated 3D classes were merged and used for one further round of 3D classification (six classes). Each 3D class was refined independently; the most populated 3D class comprising 53,887 particles refined to 7.8 Å resolution.
Extended Data Figure 5. Nucleosomal DNA plasticity.
Overview of the intasome-nucleosome complex structure (left) and a magnified stereo view of nucleosomal DNA engaged within tDNA binding cleft of the intasome (right). DNA conformations as in free nucleosomes (PDB ID 1KX5) and as tDNA in complex with the PFV intasome (3OS1) are shown in light and dark gray, respectively; the arrowhead shows approximate direction of the DNA deformation. Asterisks indicate nucleosomal DNA ends.
Extended Data Figure 6. Hybrid intasomes: structure-based design and validation in vitro.
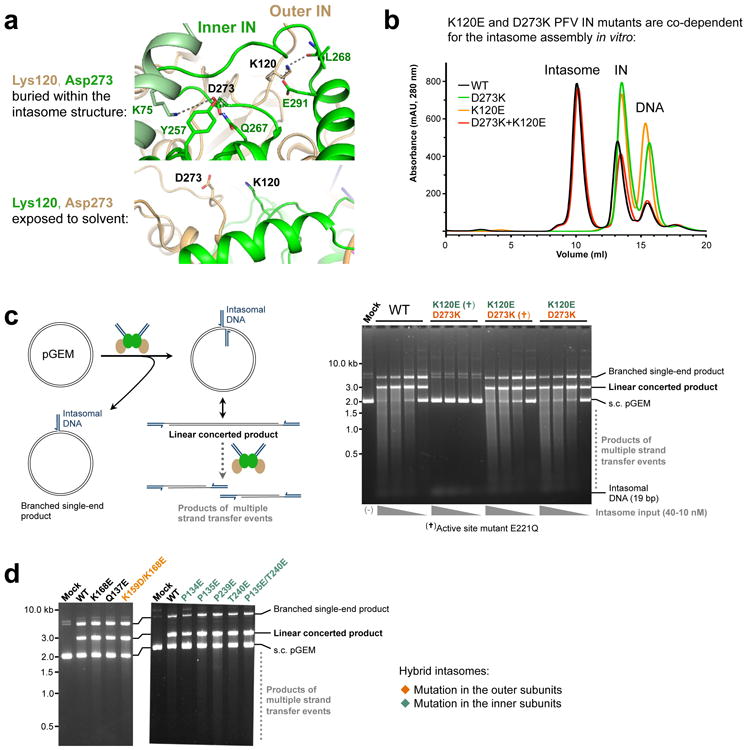
a, Views on the environment of Lys120 and Asp273 PFV IN residues within the intasome structure. Protein is shown as cartoons with side chains of selected amino acid residues shown as sticks; the cartoons and carbon atoms of the inner and outer IN chains are shown in green and light-orange, respectively. Lys120 of the outer and Asp273 of the inner IN subunit are involved in a network of interactions; in contrast, Lys120 of the inner and Asp273 of the outer IN subunit are solvent-exposed. Consequently, IN mutants harboring substitutions of Lys120 or Asp273 can only play a role in the inner or outer intasomal subunits, respectively; b, PFV IN mutants K120E and D273K are co-dependent for intasome assembly. Products of intasome assembly using WT, D273K, K120E PFV IN or an equimolar mixture of D273K and K120E INs were separated by size exclusion chromatography. Elution positions of the intasome, IN and free DNA are indicated. The assembly was successful with WT IN or with a mixture of the two IN mutants, but not with either of the IN variants separately; c, Validation of the hybrid intasome design. Left: possible types of strand transfer products obtained by reacting the intasome with circular DNA target (pGEM, black lines). Full-site integration (strand transfer involving both intasomal DNAs, dark blue lines) results in a linear concerted product, which may be targeted by further strand transfer events. Half-site integration (strand transfer involving a single intasomal DNA end) results in a circular branched single-end product. Right: strand transfer assays using mutant intasomes and circular pGEM DNA target. The intasomes were assembled using WT IN or a mixture of K120E and D273K mutants, as indicated atop the gel. IN variants indicated with a cross (†) additionally incorporated the E221Q amino acid substitution that disables the enzyme active site. Reaction products were separated by agarose gel electrophoresis. Intasomes were used at indicated concentrations; the leftmost lane contained a mock sample, which received no intasome. Migration positions of the reaction products, intasomal DNA and unreacted supercoiled (s.c.) pGEM are indicated to the right of the gel. As predicted, the strand transfer function of the hybrid intasome strictly requires the active site from the K120E (inner) IN subunit, but not the D273K (outer) subunit; d, Strand transfer activity of mutant intasomes on naked plasmid DNA. Mutations indicated in orange or green were restricted to the outer or inner subunits of the hybrid PFV intasome, respectively.
Extended Data Figure 7. Infectivity of the mutant PFV vectors.
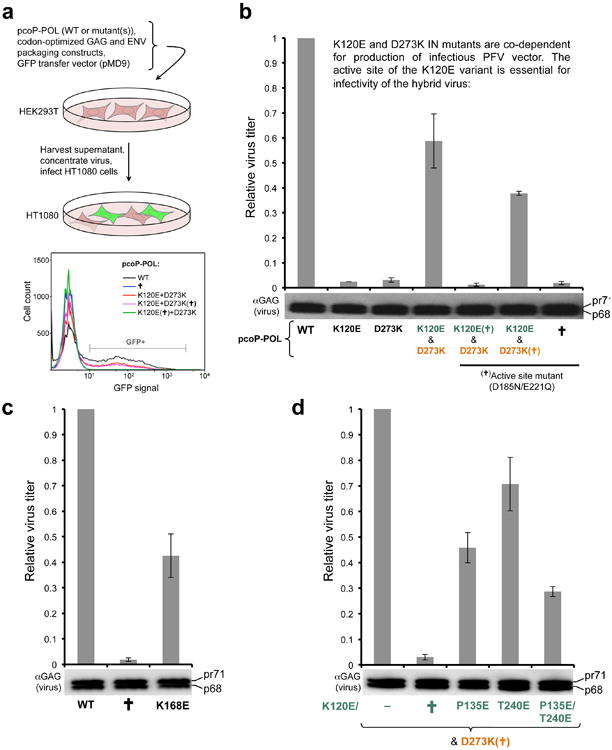
a, Schematic of the experiments. PFV vectors were produced in 293T cells transfected with DNA constructs encoding PFV GAG, POL and ENV, plus a GFP reporter transfer vector (pMD9). The virus, concentrated by centrifugation, was applied onto target HT1080 cells. Five days post-infection the cells were analyzed by FACS and/or used for isolation of genomic DNA and integration site sequencing. IN mutations were introduced into the packaging construct encoding POL (pcop-POL); b, Validation of the hybrid intasome design in viral culture conditions. PFV GFP virus was produced using WT, K120E, D273K POL packaging construct or a mixture of K120E and D273K mutants. The variants indicated with a cross (†) additionally contained a double point mutation inactivating the IN active site (D185N/E221Q). The graph and the Western bot show mean relative infectivity and GAG contents (pr71 and p68) of the resultant viruses, respectively. All infectivity experiments were done at least in triplicate, with two or more independent virus preparations; error bars represent standard deviations. The K120E and D273K IN mutants are co-dependent for production of infectious PFV vector, and that the functional active site of K120E IN component is essential for production of infectious hybrid virus; c, Relative infectivity of the PFV vectors harboring WT, K168E, or active-site-dead D185N/E221Q (indicated with a cross, †) IN; d, Relative infectivities of hybrid viruses produced using D273K/D185N/E221Q (indicated as D273K (†)) and K120E, K120E/D185N/E221Q (†), K120E/P135E, K120E/T240E, and K120E/P135E/T240E. The Western blots below the graphs show GAG (pr71 and p68) contents of the respective PFV vector preps.
Extended Data Figure 8. Local nucleotide sequence biases at PFV integration sites.
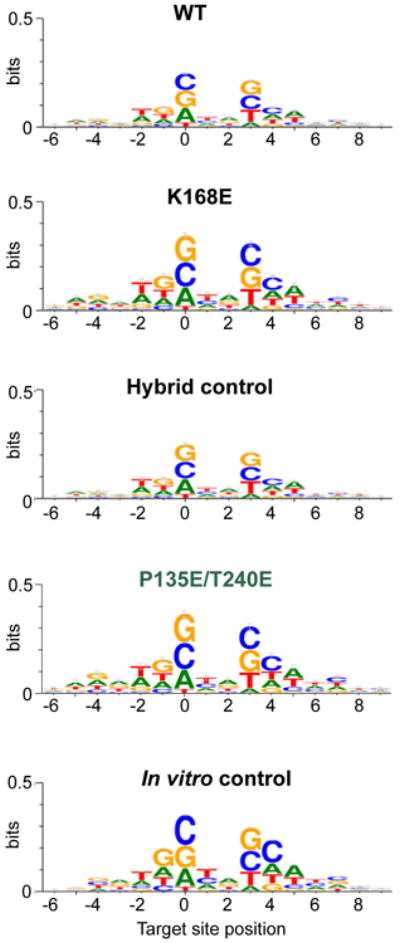
Nucleotide sequence preferences at PFV integration sites in cellula (WT, K168E, hybrid control and P135E/T240E) or in vitro displayed in the form of sequence logos. The heights of the logos correspond to the maximum information content at each position (maximum information content being 2 bit per base). Position 0 corresponds to the target nucleotide joined to the processed U5 PFV end.
Extended Data Figure 9. Negative-stain electron microscopy analysis.
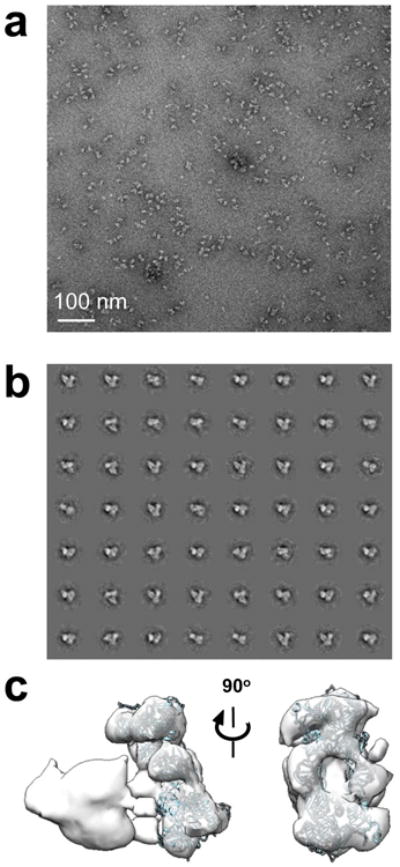
a, Representative micrograph; b, reference free class averages; c, 3D electron density map of the intasome-nucleosome complex with a docked intasome structure. Note that DNA density is not recovered with negative-stain EM.
Extended Data Table 1. Integration site preferences of PFV vector mutants.
| Dataset | Total sites | Intragenic1 | +/- 5 kb TSS2 | +/- 5 kb Lamin3 | Intergenic (≥40 kb)4 | Gene density (Mbp-1)5 | ||||
| Number | %6 | Number | % | Number | % | Number | % | |||
| In vitro7 | 2,212,496 | 1,050,686 | 47.5 | 213,822 | 9.7 | 880,461 | 39.8 | 713,115 | 32.2 | 10.3 |
| WT | 153,447 | 49,023 | 32.0 | 14,646 | 9.5 | 99,307 | 64.7 | 73,367 | 47.8 | 6.7 |
| K168E | 14,872 | 5,244 | 35.3(P<10-14) | 1,410 | 9.5(P>0.5) | 8,987 | 60.4(P<10-23) | 6,572 | 44.2(P<10-15) | 7.4(P≪2.2·10-16) |
| Hybrid control8 | 41,243 | 12,862 | 31.2 | 3,447 | 8.4 | 28,251 | 68.5 | 20,320 | 49.3 | 6.3 |
| P135E/T240E9 | 10,148 | 3,830 | 37.7(P<10-34) | 801 | 7.9(P>0.5) | 5,701 | 56.2(P<10-119) | 4,361 | 43.0(P<10-28) | 7.6(P≪2.2·10-16) |
Number and fraction of integration sites within RefSeq genes.
Integration sites within 5 kb of a RefSeq transcription start site.
Integration sites within 5 kb of Lamin-A/B1 signal in HT1080 cells.
Integration sites within long intergenic regions (≥40 kb).
Average number of genes within 500 kb of an integration site.
Percent of sites within a feature; values for the mutant and paired control, which show statistically significant differences (P≪0.01) are shown in bold type. P values calculated for equivalence with WT or hybrid control using chi2 (for Intragenic, +/-5 kb TSS, +/- 5 kb Lamin, and Intergenic) or Mann-Whitney-Wilcoxon (for Gene density) test are given in brackets. Bonferroni correction for multiple comparisons were applied to the P values.
Reference dataset containing integration sites obtained using purified PFV intasome and deproteinized human genomic DNA.
Hybrid PFV vector harboring K120E and D273K/D185N/E221Q IN mutants.
Hybrid PFV vector harboring K120E/P135E/T240E and D273K/D185N/E221Q IN mutants.
Supplementary Material
Acknowledgments
This work was supported by the EU FP7 HIVINNOV consortium grant 305137 (to P.C.), the US National Institute of General Medical Sciences P50 grant GM082251-06 (to P.C.) and the US National Institutes of Health R01 grant AI070042-08 (to A.N.E.). Data collection was in part funded by NeCEN, the Netherlands Centre for Electron Nanoscopy (Leiden, NL) by grants from the NWO (project 175.010.2009.001) and by the European Union's Regional Development Fund through ‘Kansenvoor West’ (project 21Z.014). We would like to thank L. Collinson, R. Carzaniga (LRI) and KirstyMacLellan-Gibson (NIBSC) for EM access, R. Horton-Harpin (Cell Cervices, LRI) for provision of HeLa cell pellets and assistance with tissue culture. We also thank F. Santoni (University of Geneva), N. Sweeny (Imperial College London) and all our colleagues for helpful discussions.
Footnotes
Supplementary Information is available in the online version of the paper.
Author Contributions: D.P.M. analyzed interactions of the PFV intasome and nucleosomes, discovered conditions to produce the stable intasome-nucleosome complex and prepared it for electron microscopy; L.R. D.P.M. and A.C. performed all EM work with the exception of cryo-EM grid preparation and screening performed by L.R.; R.M. collected cryo-EM data; L.R. and A.C. determined the structure. S.H. designed the co-dependent K120E-D273K PFV IN pair; D.L. designed and provided WT PFV vector constructs; P.C. cloned PFV vector mutants; P.C. and P.L. carried out PFV infections; E.S. and A.N.E. developed the protocol and carried out sequencing of PFV integration sites; P.C. analyzed integration site distributions.
The cryo-EM electron density map has been deposited with the EMDB (accession 13005). Integration sites are available through the NCBI GEO repository (accession GSE67730).
The authors declare no competing financial interests.
Readers are welcome to comment on the online version of the paper.
References
- 1.Li M, Mizuuchi M, Burke TR, Jr, Craigie R. Retroviral DNA integration: reaction pathway and critical intermediates. EMBO J. 2006;25:1295–1304. doi: 10.1038/sj.emboj.7601005. [DOI] [PMC free article] [PubMed] [Google Scholar]
- 2.Hare S, Gupta SS, Valkov E, Engelman A, Cherepanov P. Retroviral intasome assembly and inhibition of DNA strand transfer. Nature. 2010;464:232–236. doi: 10.1038/nature08784. [DOI] [PMC free article] [PubMed] [Google Scholar]
- 3.Maertens GN, Hare S, Cherepanov P. The mechanism of retroviral integration from X-ray structures of its key intermediates. Nature. 2010;468:326–329. doi: 10.1038/nature09517. [DOI] [PMC free article] [PubMed] [Google Scholar]
- 4.Montano SP, Pigli YZ, Rice PA. The mu transpososome structure sheds light on DDE recombinase evolution. Nature. 2012;491:413–417. doi: 10.1038/nature11602. [DOI] [PMC free article] [PubMed] [Google Scholar]
- 5.Luger K, Mader AW, Richmond RK, Sargent DF, Richmond TJ. Crystal structure of the nucleosome core particle at 2.8. A resolution. Nature. 1997;389:251–260. doi: 10.1038/38444. [DOI] [PubMed] [Google Scholar]
- 6.Pryciak PM, Sil A, Varmus HE. Retroviral integration into minichromosomes in vitro. EMBO J. 1992;11:291–303. doi: 10.1002/j.1460-2075.1992.tb05052.x. [DOI] [PMC free article] [PubMed] [Google Scholar]
- 7.Pryciak PM, Varmus HE. Nucleosomes, DNA-binding proteins, and DNA sequence modulate retroviral integration target site selection. Cell. 1992;69:769–780. doi: 10.1016/0092-8674(92)90289-o. [DOI] [PubMed] [Google Scholar]
- 8.Pruss D, Bushman FD, Wolffe AP. Human immunodeficiency virus integrase directs integration to sites of severe DNA distortion within the nucleosome core. Proc Natl Acad Sci U S A. 1994;91:5913–5917. doi: 10.1073/pnas.91.13.5913. [DOI] [PMC free article] [PubMed] [Google Scholar]
- 9.Muller HP, Varmus HE. DNA bending creates favored sites for retroviral integration: an explanation for preferred insertion sites in nucleosomes. EMBO J. 1994;13:4704–4714. doi: 10.1002/j.1460-2075.1994.tb06794.x. [DOI] [PMC free article] [PubMed] [Google Scholar]
- 10.Wang GP, Ciuffi A, Leipzig J, Berry CC, Bushman FD. HIV integration site selection: analysis by massively parallel pyrosequencing reveals association with epigenetic modifications. Genome Res. 2007;17:1186–1194. doi: 10.1101/gr.6286907. [DOI] [PMC free article] [PubMed] [Google Scholar]
- 11.Roth SL, Malani N, Bushman FD. Gammaretroviral integration into nucleosomal target DNA in vivo. J Virol. 2011;85:7393–7401. doi: 10.1128/JVI.00635-11. [DOI] [PMC free article] [PubMed] [Google Scholar]
- 12.Baller JA, Gao J, Stamenova R, Curcio MJ, Voytas DF. A nucleosomal surface defines an integration hotspot for the Saccharomyces cerevisiae Ty1 retrotransposon. Genome Res. 2012;22:704–713. doi: 10.1101/gr.129585.111. [DOI] [PMC free article] [PubMed] [Google Scholar]
- 13.Hare S, Maertens GN, Cherepanov P. 3′-processing and strand transfer catalysed by retroviral integrase in crystallo. EMBO J. 2012;31:3020–3028. doi: 10.1038/emboj.2012.118. [DOI] [PMC free article] [PubMed] [Google Scholar]
- 14.Yin Z, Lapkouski M, Yang W, Craigie R. Assembly of prototype foamy virus strand transfer complexes on product DNA bypassing catalysis of integration. Protein Sci. 2012;21:1849–1857. doi: 10.1002/pro.2166. [DOI] [PMC free article] [PubMed] [Google Scholar]
- 15.Lowary PT, Widom J. New DNA sequence rules for high affinity binding to histone octamer and sequence-directed nucleosome positioning. J Mol Biol. 1998;276:19–42. doi: 10.1006/jmbi.1997.1494. [DOI] [PubMed] [Google Scholar]
- 16.Davey CA, Sargent DF, Luger K, Maeder AW, Richmond TJ. Solvent mediated interactions in the structure of the nucleosome core particle at 1.9 a resolution. J Mol Biol. 2002;319:1097–1113. doi: 10.1016/S0022-2836(02)00386-8. [DOI] [PubMed] [Google Scholar]
- 17.Dyda F, et al. Crystal structure of the catalytic domain of HIV-1 integrase: similarity to other polynucleotidyl transferases. Science. 1994;266:1981–1986. doi: 10.1126/science.7801124. [DOI] [PubMed] [Google Scholar]
- 18.Shaytan AK, Landsman D, Panchenko AR. Nucleosome adaptability conferred by sequence and structural variations in histone H2A-H2B dimers. Curr Opin Struct Biol. 2015;32C:48–57. doi: 10.1016/j.sbi.2015.02.004. [DOI] [PMC free article] [PubMed] [Google Scholar]
- 19.Mullers E, et al. Novel functions of prototype foamy virus Gag glycine- arginine-rich boxes in reverse transcription and particle morphogenesis. J Virol. 2011;85:1452–1463. doi: 10.1128/JVI.01731-10. [DOI] [PMC free article] [PubMed] [Google Scholar]
- 20.Trobridge GD, et al. Foamy virus vector integration sites in normal human cells. Proc Natl Acad Sci U S A. 2006;103:1498–1503. doi: 10.1073/pnas.0510046103. [DOI] [PMC free article] [PubMed] [Google Scholar]
- 21.Nowrouzi A, et al. Genome-wide mapping of foamy virus vector integrations into a human cell line. J Gen Virol. 2006;87:1339–1347. doi: 10.1099/vir.0.81554-0. [DOI] [PubMed] [Google Scholar]
- 22.Guelen L, et al. Domain organization of human chromosomes revealed by mapping of nuclear lamina interactions. Nature. 2008;453:948–951. doi: 10.1038/nature06947. [DOI] [PubMed] [Google Scholar]
- 23.Deal RB, Henikoff JG, Henikoff S. Genome-wide kinetics of nucleosome turnover determined by metabolic labeling of histones. Science. 2010;328:1161–1164. doi: 10.1126/science.1186777. [DOI] [PMC free article] [PubMed] [Google Scholar]
- 24.Schwabish MA, Struhl K. Asf 1 mediates histone eviction and deposition during elongation by RNA polymerase II. Mol Cell. 2006;22:415–422. doi: 10.1016/j.molcel.2006.03.014. [DOI] [PubMed] [Google Scholar]
- 25.Gupta K, et al. Solution conformations of prototype foamy virus integrase and its stable synaptic complex with U5 viral DNA. Structure. 2012;20:1918–1928. doi: 10.1016/j.str.2012.08.023. [DOI] [PMC free article] [PubMed] [Google Scholar]
- 26.Valkov E, et al. Functional and structural characterization of the integrase from the prototype foamy virus. Nucleic Acids Res. 2009;37:243–255. doi: 10.1093/nar/gkn938. [DOI] [PMC free article] [PubMed] [Google Scholar]
- 27.Hare S, et al. Molecular mechanisms of retroviral integrase inhibition and the evolution of viral resistance. Proc Natl Acad Sci U S A. 2010;107:20057–20062. doi: 10.1073/pnas.1010246107. [DOI] [PMC free article] [PubMed] [Google Scholar]
- 28.Schnitzler GR. Isolation of histones and nucleosome cores from mammalian cells. Curr Protoc Mol Biol. 2001;Chapter 21 doi: 10.1002/0471142727.mb2105s50. Unit 21 25. [DOI] [PubMed] [Google Scholar]
- 29.Dyer PN, et al. Reconstitution of nucleosome core particles from recombinant histones and DNA. Methods Enzymol. 2004;375:23–44. doi: 10.1016/s0076-6879(03)75002-2. [DOI] [PubMed] [Google Scholar]
- 30.Mindell JA, Grigorieff N. Accurate determination of local defocus and specimen tilt in electron microscopy. J Struct Biol. 2003;142:334–347. doi: 10.1016/s1047-8477(03)00069-8. [DOI] [PubMed] [Google Scholar]
- 31.Heymann JB, Belnap DM. Bsoft: image processing and molecular modeling for electron microscopy. J Struct Biol. 2007;157:3–18. doi: 10.1016/j.jsb.2006.06.006. [DOI] [PubMed] [Google Scholar]
- 32.van Heel M, Harauz G, Orlova EV, Schmidt R, Schatz M. A new generation of the IMAGIC image processing system. J Struct Biol. 1996;116:17–24. doi: 10.1006/jsbi.1996.0004. [DOI] [PubMed] [Google Scholar]
- 33.Tang G, et al. EMAN2: an extensible image processing suite for electron microscopy. J Struct Biol. 2007;157:38–46. doi: 10.1016/j.jsb.2006.05.009. [DOI] [PubMed] [Google Scholar]
- 34.Hohn M, et al. SPARX, a new environment for Cryo-EM image processing. J Struct Biol. 2007;157:47–55. doi: 10.1016/j.jsb.2006.07.003. [DOI] [PubMed] [Google Scholar]
- 35.de la Rosa-Trevin JM, et al. Xmipp 3.0: an improved software suite for image processing in electron microscopy. J Struct Biol. 2013;184:321–328. doi: 10.1016/j.jsb.2013.09.015. [DOI] [PubMed] [Google Scholar]
- 36.Scheres SH. RELION: implementation of a Bayesian approach to cryo-EM structure determination. J Struct Biol. 2012;180:519–530. doi: 10.1016/j.jsb.2012.09.006. [DOI] [PMC free article] [PubMed] [Google Scholar]
- 37.Pettersen EF, et al. UCSF Chimera--a visualization system for exploratory research and analysis. J Comput Chem. 2004;25:1605–1612. doi: 10.1002/jcc.20084. [DOI] [PubMed] [Google Scholar]
- 38.Heinkelein M, et al. Improved primate foamy virus vectors and packaging constructs. J Virol. 2002;76:3774–3783. doi: 10.1128/JVI.76.8.3774-3783.2002. [DOI] [PMC free article] [PubMed] [Google Scholar]
- 39.Stirnnagel K, et al. Differential pH-dependent cellular uptake pathways among foamy viruses elucidated using dual-colored fluorescent particles. Retrovirology. 2012;9:71. doi: 10.1186/1742-4690-9-71. [DOI] [PMC free article] [PubMed] [Google Scholar]
- 40.Stange A, Luftenegger D, Reh J, Weissenhorn W, Lindemann D. Subviral particle release determinants of prototype foamy virus. J Virol. 2008;82:9858–9869. doi: 10.1128/JVI.00949-08. [DOI] [PMC free article] [PubMed] [Google Scholar]
- 41.Rasheed S, Nelson-Rees WA, Toth EM, Arnstein P, Gardner MB. Characterization of a newly derived human sarcoma cell line (HT-1080) Cancer. 1974;33:1027–1033. doi: 10.1002/1097-0142(197404)33:4<1027::aid-cncr2820330419>3.0.co;2-z. [DOI] [PubMed] [Google Scholar]
- 42.Matreyek KA, et al. Host and viral determinants for MxB restriction of HIV-1 infection. Retrovirology. 2014;11:90. doi: 10.1186/s12977-014-0090-z. [DOI] [PMC free article] [PubMed] [Google Scholar]
- 43.Chatterjee AG, et al. Serial number tagging reveals a prominent sequence preference of retrotransposon integration. Nucleic Acids Res. 2014;42:8449–8460. doi: 10.1093/nar/gku534. [DOI] [PMC free article] [PubMed] [Google Scholar]
- 44.Schroder AR, et al. HIV-1 integration in the human genome favors active genes and local hotspots. Cell. 2002;110:521–529. doi: 10.1016/s0092-8674(02)00864-4. [DOI] [PubMed] [Google Scholar]
- 45.Kent WJ. BLAT--the BLAST-like alignment tool. Genome Res. 2002;12:656–664. doi: 10.1101/gr.229202. [DOI] [PMC free article] [PubMed] [Google Scholar]
- 46.Deyle DR, et al. A genome-wide map of adeno-associated virus-mediated human gene targeting. Nat Struct Mol Biol. 2014;21:969–975. doi: 10.1038/nsmb.2895. [DOI] [PMC free article] [PubMed] [Google Scholar]
- 47.Meuleman W, et al. Constitutive nuclear lamina-genome interactions are highly conserved and associated with A/T-rich sequence. Genome Res. 2013;23:270–280. doi: 10.1101/gr.141028.112. [DOI] [PMC free article] [PubMed] [Google Scholar]
- 48.Quinlan AR, Hall IM. BEDTools: a flexible suite of utilities for comparing genomic features. Bioinformatics. 2010;26:841–842. doi: 10.1093/bioinformatics/btq033. [DOI] [PMC free article] [PubMed] [Google Scholar]
- 49.Crooks GE, Hon G, Chandonia JM, Brenner SE. WebLogo: a sequence logo generator. Genome Res. 2004;14:1188–1190. doi: 10.1101/gr.849004. [DOI] [PMC free article] [PubMed] [Google Scholar]
Associated Data
This section collects any data citations, data availability statements, or supplementary materials included in this article.