Abstract
The objectives of this study were to explore the inhibition mechanism of lung cancer cells A549 and H460 by curcuminoid extracts and nanoemulsions prepared from Curcuma longa Linnaeus. In addition, human bronchus epithelial cell line BEAS-2B (normal cell) was selected for comparison. A high-performance liquid chromatography (HPLC) method was developed to separate and quantify the various curcuminoids in C. longa extract, including curcumin (1,714.5 μg/mL), demethoxycurcumin (1,147.4 μg/mL), and bisdemethoxycurcumin (190.2 μg/mL). A high-stability nanoemulsion composed of Tween 80, water, and curcuminoid extract was prepared, with mean particle size being 12.6 nm. The cell cycle was retarded at G2/M for both the curcuminoid extract and nanoemulsion treatments; however, the inhibition pathway may be different. H460 cells were more susceptible to apoptosis than A549 cells for both curcuminoid extract and nanoemulsion treatments. Growth of BEAS-2B remained unaffected for both the curcuminoid extract and nanoemulsion treatments, with a concentration range from 1 to 4 μg/mL. Also, the activities of caspase-3, caspase-8, and caspase-9 followed a dose-dependent increase for both A549 and H460 cells for both the treatments, accompanied by a dose-dependent increase in cytochrome C expression and a dose-dependent decrease in CDK1 expression. Interestingly, a dose-dependent increase in cyclin B expression was shown for A549 cells for both the treatments, while a reversed trend was found for H460 cells. Both mitochondria and death receptor pathways may be responsible for apoptosis of both A549 and H460 cells.
Keywords: curcuminoid extract, curcuminoid nanoemulsion, Curcuma longa Linnaeus, lung cancer cell, cell cycle, apoptosis mechanism
Introduction
Curcuma longa Linnaeus, a vital medicinal herb widely grown in Asian countries such as India, the People’s Republic of China, and Malaysia, has received considerable attention in the past 2 decades due to its possible clinical use in the treatment of chronic diseases such as diabetes, inflammation, cancer, and Alzheimer’s disease.1 The major bioactive compound present in dried roots and stems of C. longa L. is curcuminoid, which contains curcumin, demethoxycurcumin, and bisdemethoxycurcumin, with curcumin being the most abundant ingredient.2 However, as curcuminoid is insoluble in water and susceptible to degradation under light and alkaline conditions, its application in food and drug industries is limited.3 In addition, the extremely low bioavailability of curcuminoid in vivo also affects its therapeutic efficiency in chronic diseases,4 questioning the use of curcuminoid as a botanic drug.
According to a statistical report issued by the Ministry of Health of Taiwan in 2014, malignant tumor associated with lung cancer, is the leading cause of death in Taiwan.5 On the basis of biological characteristics and clinical performance, lung cancer can be divided into small-cell lung cancer and non-small-cell lung cancer, with the former accounting for 12%–15% and the latter for 85%–88% of the cases.6 Comparatively, small-cell lung tumors grow and spread faster to the brain, skeleton, and lymph organs than non-small-cell lung tumors, with the former being more allergic to chemical and radiation therapies.7 Non-small-cell lung cancer can be further divided into adenocarcinoma, squamous cell carcinoma, and large cell carcinoma. Large cell carcinoma is the most difficult to treat due to its possible presence in any spot of the lungs as well as fast growth and migration.8
Numerous reports have been published regarding the biological activities of curcuminoid, especially curcumin standard. However, the effect of curcuminoid nanoemulsion on inhibition of cancer cell growth was less explored. Among the various curcuminoids, curcumin was shown to be the most efficient in scavenging 2,2-diphenyl-1-picrylhydrazyl (DPPH)-free radicals, with IC50 being 28.2 μg/mL.9 Also, curcumin possessed anti-inflammatory activity through expression regulation of NF-kB, COX-2, inducible nitric oxide synthase, pro-matrix metalloproteinase, and tumor necrosis factor-α.10 More importantly, curcumin could inhibit proliferation and migration of various cancer cells, as well as enhance expressions of P21, P27, and P53 of breast cancer cells with cell cycle arrested at G1 phase.11,12 Similarly, in an animal experiment, curcumin was found effective in reducing bladder tumor volume through decrease of cyclin D, VEGF, COX-2, C-myc, and BcL-2 expressions.13 Similar outcome was observed in a breast cancer mice model by Kang et al14 who demonstrated that curcumin could suppress tumor growth and potentiate the growth inhibitory effect of paclitaxel when combined with curcumin. All these findings suggest that curcumin possesses a great potential to be used as a chemotherapy agent.
Over the past 2 decades, nanotechnology has emerged as a new technology with wide application in product development in both food and pharmaceutical industries, especially the development of nanoemulsion with a size between 10 and 100 nm. It has been well established that nanoemulsion possesses the ability to encapsulate bioactive compounds for enhancement of water-soluble ability, stability during storage, as well as bioavailability in vivo.15,16 The objectives of this study were to develop a nanoemulsion for encapsulation of curcuminoid and study the inhibition mechanism of non-small lung cancer cells A549 and NCI-H460 by both curcuminoid extracts and nanoemulsions. In addition, human bronchus epithelial cell line BEAS-2B (normal cell) was selected for comparison.
Materials and methods
Materials
Fresh C. longa L. was purchased from a local Chinese drug store in Taipei and placed into a bag sealed under vacuum for storage at −30°C until use. Curcuminoid standards including curcumin, demethoxycurcumin, and bisdemethoxycurcumin were procured from Enzo Life Science Co. (Farmingdale, NY, USA) and Sigma-Aldrich Co. (St Louis, MO, USA). Internal standard (IS) methyl red was also from Sigma-Aldrich Co. High-performance liquid chromatography (HPLC)-grade solvents such as methanol and acetonitrile were from Merck Co. (Darmstadt, Germany). Formic acid and dimethyl sulfoxide (DMSO) were from Sigma-Aldrich Co. Ethanol (99.9%) was from Sigma-Aldrich Co. Deionized water was made using a Milli-Q water purification system from EMD Millipore (Billerica, MA, USA).
Both lung cancer cell lines A549 and H460 were obtained from Taiwan Food Industry Development Research Institute (Hsinchu, Taiwan). Human bronchus epithelial cell line BEAS-2B (normal cell) was provided by Dr Chi-Chong Wang, Graduate Institute of Medicine, Fu Jen University (Taipei, Taiwan). Fetal bovine serum (FBS), RPMI-1640 medium, and Hank’s balanced salt solution (HBSS) were from HyClone Co. (Logan, UT, USA). Trypan blue stain, trypsin–ethylenediaminetetraacetic acid (EDTA; 0.25%), and penicillin–streptomycin were from Thermo Fisher Scientific (Waltham, MA, USA). Sodium hydrogen carbonate, RNAse A, propidium iodide (PI), bovine serum albumin (BSA), and sodium dodecyl sulfate (SDS) were from Sigma-Aldrich Co. Annexin V, Annexin V buffer, and caspase-3 assay kit were from BD Biosciences (San Jose, CA, USA). MTT, glycerol, Tris (free base), TEMED (N,N,N′,N′-tetramethylethylenediamine), ammonium persulfate (AP), and acrylamide (30%) were from USB Co. (Cleveland, OH, USA). Amersham ECL Western blotting detection agent was from GE Healthcare Bio-Sciences AB (Uppsala, Sweden). Bradford reagent for protein assay was from Bio-Rad Laboratories Inc. (Hercules, CA, USA). Both caspase-8 and caspase-9 fluorometric assay kits were from BioVision Inc. (Milpitas, CA, USA). Primary antibodies including mouse anti-cyclin B, mouse anti-P21, mouse anti-cytochrome C, and mouse anti-BcL-2 were from BD Biosciences. Mouse anti-P53, mouse anti-CDC 2 (CDK1), and mouse anti-glyceraldehyde 3-phosphate dehydrogenase (GAPDH) were from Novus Biological LLC (Littleton, CO, USA). The secondary antibody goat anti-mouse-IgG-HRP was from Jackson ImmunoResearch Laboratories Inc. (West Grove, PA, USA). The analytical column (Eclipse XDB-C18, 150×4.6 mm ID, 5 μm particle size) was from Agilent Technologies (Santa Clara, CA, USA).
Instrumentation
The HPLC instrument (Agilent Technologies 1100 series) is composed of a degasser (G1379A), a temperature-controlled column oven (G1316A), a quaternary pump (G1311A), a photodiode array detector (G1315B), and a 6130 quadrupole mass spectrometer with multimode ion source (EST and APCI). The freeze drier (FD 24) was from Chin-Ming Co. (Taipei, Taiwan). The sonicator (DC400H) was from Delta New Instrument Co. (Taipei, Taiwan). The high-speed centrifuge (Sorvall RC5C) was from DuPont Co. (Wilmington, DE, USA). The microcentrifuge (Fresco 21) was from Thermo Fisher Scientific. The laminar flow (4BC-24) was from Hwa Hsia Co. Ltd. (Taipei, Taiwan). The inverted microscope (Eclipse TS 100) was from Nikon Corporation (Tokyo, Japan). The cytoflow meter (CyFlow ML) was from Partec Co. (Munster, Germany). The carbon dioxide incubator (SCA-165DS) was from Astec Co. (Fukuoka, Japan). The enzyme-linked immunosorbent assay (ELISA) reader (Versa Man) was from Molecular Devices LLC (Sunnyvale, CA, USA). The cold light fluorescence image analysis system (BioSpectrum 500) was from UVP Co. (Upland, CA, USA). The funnel shaker (V-U) was from Hsiang-Tai Co. (Taipei, Taiwan). The low-temperature circulation water bath (Fristek B402L) was from Li-Chen Industrial Co., Ltd (Taichung City, Taiwan). The electrophoresis system was from Bio-Rad Laboratories (Bossier City, LA, USA). JEM-1400 transmission electron microscopy (TEM) was from JEOL (Tokyo, Japan). The multifunction full wavelength microplate analyzer (Infinite 200 PRO series) was from Tecan Co. (Männedorf, Switzerland).
Extraction of curcuminoid
A method based on the study by Li et al17 was modified to extract curcuminoid from C. longa L. Five grams of dried sample powder and 50 mL of 99.5% ethanol were thoroughly mixed for homogeneity in each of four 250 mL centrifuge bottles. Then, all the bottles were sonicated (40 KHz, 100 W) for 30 minutes, followed by shaking for 1 hour, centrifuging at 4,000 rpm (4°C) for 10 minutes, collecting supernatant, and evaporating to dryness under vacuum. The residue was dissolved in 99.5% ethanol and diluted to 20 mL. After filtration through a 0.22 μm membrane filter, the curcuminoid extract was obtained and stored at −20°C for HPLC analysis.
HPLC analysis of curcuminoid
The various curcuminoids including curcumin, demethoxycurcumin, and bisdemethoxycurcumin were separated within 10 minutes by using an Eclipse XDB-C18 column (150×4.6 mm ID, 5 μm particle size) with a flow rate of 1 mL/min, column temperature 35°C, detection wavelength 425 nm, and a gradient mobile phase of 0.1% formic acid and acetonitrile, with 40% acetonitrile in the beginning, increased to 64% acetonitrile in 7 minutes, maintained for 3 minutes, increased to 90% acetonitrile in 15 minutes. Various curcuminoids were identified by comparing retention times, absorption spectra, and mass spectra of unknown peaks with reference standards. Electrospray ionization with negative ion mode was employed for detection, with a scanning range of 100–1,000 m/z, drying gas flow 12 L/min, nebulizer pressure 50 psi, dry gas temperature 350°C, vaporizer temperature 250°C, capillary voltage 4,000 V, charging voltage 2,000 V, and fragmentor voltage 120 V. IS methyl red was used for quantitation by dissolving in 99.5% ethanol to a concentration of 100 μg/mL. Six concentrations of 0.1, 0.5, 1, 5, 10, and 15 μg/mL were prepared each for curcumin, demethoxycurcumin, and bisdemethoxycurcumin, and then mixed with methyl red to a final concentration of 10 μg/mL in each standard solution. Three standard curves were obtained by plotting concentration ratio (standard versus IS) against area ratio (standard versus IS), with the linear regression equation and correlation coefficient (R) obtained automatically by an EXCEL software system. The various curcuminoids were then quantified by using the linear regression equations.
Preparation of curcuminoid nanoemulsion
Approximately 3 mL of curcuminoid nanoemulsion with a concentration of 2,000 μg/mL was prepared by collecting a portion of curcuminoid extract and solvent removed under nitrogen. Then, Tween 80 (0.24 g) was added and the mixture was homogenized thoroughly, followed by adding 2.76 g of deionized water and mixing again for complete dispersion of Tween 80 in water. The solution was then sonicated in a sonicator for 60 minutes to obtain the curcuminoid nanoemulsion.
Nanoemulsion analysis
The particle size distribution of curcuminoid nanoemulsion was determined by diluting a portion of nanoemulsion sample in 50 mM phosphoric acid dihydrogen potassium buffer solution (pH 5.5), filtering through a 0.2 μm membrane filter, and pouring into a polystyrene colorimetric tube for dynamic light scattering (DLS) analysis. In addition, the shape and size of curcuminoid nanoemulsion were analyzed by TEM based on diffraction contrast to produce bright or dark field. Initially, a portion of curcuminoid nanoemulsion was diluted 50 times with deionized water, after which a 20 μL sample was dropped on a copper grid for 30 seconds and then the extra sample was removed with a glass filter paper for double staining by 20 μL PTA (2%) for 30 seconds. After the excess solution was removed with the glass filter paper, the sample was placed in a waterproof oven for complete drying for TEM analysis under 120 kVA and enlargement for 300,000 times. Then, the shape and size of curcuminoid nanoemulsion were obtained.
For stability study, the curcuminoid nanoemulsion was stored at 4°C for 3 months, during which a portion of the sample was collected every 15 days for determination of particle size distribution by DLS.
For encapsulation study, a method based on a study by Bisht et al18 was modified. A portion of curcuminoid nanoemulsion was poured into a centrifuged tube containing a dialysis membrane with molecular weight (MW) cutoff at 3 kDa and deionized water in the lower layer. Free curcuminoid penetrated into the dialysis membrane for dispersion in the aqueous layer, while the encapsulated curcuminoid remained on the membrane surface. The free curcuminoid in the aqueous layer was then analyzed by HPLC for calculation of entrapment efficiency.
Cell culture
Phosphoric acid buffer solution (10× phosphate-buffered saline [PBS]) with a pH of 7.2 was prepared by mixing 2 g KH2PO4, 80.1 g NaCl, 2.0 g KCl, and 11.5 g Na2PO4 in 1 L deionized water, followed by dilution with deionized water for ten times and sterilized under high pressure. The MTT solution was prepared by dissolving 25 mg MTT powder in 5 mL PBS solution, after which the solution was filtered through a 0.2 μm membrane filter and stored at −20°C. Prior to use, this solution was mixed with HBSS at a ratio of 1:9 (v/v).
Human lung cancer cell lines A549 and H460 were cultured in RPMI-1640 medium containing 5% FBS, while human bronchus epithelial cell line BEAS-2B was cultured in RPMI-1640 medium containing 10% FBS. The RPMI medium was prepared by mixing 52 g RPMI-1640 powder, 10 g sodium bicarbonate, and 50 mL penicillin–streptomycin in sterilized water, followed by adjusting the pH to 7.2–7.4, diluting to 4,750 mL with sterilized water, and filtering through a 0.2 μm membrane filter. A portion of 950 mL was poured into a 1 L bottle and mixed with 50 mL FBS to obtain the RPMI-1640 medium containing 5% FBS, while the other portion of 900 mL was poured into another 1 L bottle and mixed with 100 mL FBS to obtain the RPMI-1640 containing 10% FBS. All the three cell lines were cultured in an incubator at 37°C and 5% CO2 for 2–3 days. After the cell density reached approximately 80% confluency, cells were washed with PBS and detached by adding 1 mL of 0.25% trypsin–EDTA solution, followed by reacting at 37°C for 1–2 minutes and adding 1 mL medium for neutralization. Then, the cells were collected and centrifuged at 1,200 rpm for 5 minutes. The supernatant was removed and 1 mL of fresh medium was added. Then, a portion of cells was reseeded in 10 mL of new culture medium. For cell number count, approximately 20 μL of cell solution was collected and mixed with the same volume of trypan blue, after which the mixture was poured into a hemocytometer for counting cell number under a microscope. Then, the cell concentration was calculated by using the following formula:
where A or B are the total cell numbers based on duplicate calculation of nine squares in both the upper and lower calculation chambers, respectively.
Cell morphology assay
Cells were seeded in a six-well plate with each well containing 5×10⁴ cells and cultured overnight for cell adhesion. Then, the culture medium was removed and replaced with various concentrations of curcuminoid extract or nanoemulsion for 24 and 48 hours, followed by observation under a microscope and photography.
MTT assay
The cell suspension (0.2 mL) was seeded in a 96-well plate with each well containing 5×10³ cells and cultured overnight for cell adhesion. Then, the culture medium was removed and replaced with different concentrations of curcuminoid extract or nanoemulsion. Triplicate treatments were conducted for each concentration. After 48 hours of incubation, the culture medium was sucked and the residual culture medium was removed by adding PBS. Then, 0.2 mL MTT reagent (0.5 mg/mL) was added to each well and incubated for 2 hours, followed by adding 0.2 mL DMSO to dissolve the crystal, and absorbance was measured at 570 nm with an ELISA reader. The relative cell survival rate was calculated based on the ratio of the absorbance of the sample treatment relative to the absorbance of the control treatment.
Cell cycle analysis
Cells (105) were seeded in a 6 cm culture plate and incubated overnight for cell adhesion. Then, the culture medium was removed and replaced with different concentrations of curcuminoid extract or nanoemulsion. After 48 hours of incubation, the cells were washed with PBS and detached by adding trypsin–EDTA, followed by collecting cells for centrifugation at 1,200 rpm for 5 minutes, removing supernatant, flushing twice cells with PBS, and adding 1 mL 70% ethanol solution for cell fixing at 4°C. Then, the cells were again centrifuged to remove ethanol and washed twice with PBS, after which 0.1 mL of RNAse A (1 mg/mL) and 0.1 mL of the staining agent PI (100 μg/mL) were added for reaction at 37°C for 30 minutes. After filtration through a 40 μm nylon screen, the stained cells were analyzed by a flow cytometer for cell cycle distribution.
Annexin V/PI staining assay
Cells (2×10⁵) were seeded in a six-well plate and cultured overnight for cell adhesion, after which the culture medium was removed and replaced with various concentrations of curcuminoid extract or nanoemulsion. After incubation for 24 hours, the cells were washed with PBS and detached with trypsin–EDTA, followed by collection in a tube, centrifugation at 1,200 rpm for 5 minutes, removal of supernatant, and washing once with PBS (4°C). Then, 0.1 mL of binding buffer (IX) was added to suspend the cells, followed by the addition of 5 μL of fluorescein isothiocyanate (FITC)–Annexin V and 10 μL of PI staining reagent. After mixing thoroughly and reacting at room temperature for 15 minutes in the dark, 0.4 mL of binding buffer (IX) was added for the analysis of apoptotic and necrotic cell populations by a flow cytometer.
Western blotting
Cells (1×10⁶) were incubated in a 10 cm plate for 24 hours, after which the culture medium was removed and replaced with different concentrations of curcuminoid extract or nanoemulsion. After incubation for 24 hours, the cells were collected in a 1.5 mL tube for centrifugation at 1,200 rpm for 5 minutes, followed by removal of supernatant, washing once with PBS (4°C), addition of cell lysis buffer solution for cell disruption with a sonicator, and centrifugation again at 12,000 rpm for 30 minutes. Then, the protein-containing supernatant was collected and stored at −80°C before use. Quantitation of protein was carried out based on the standard curve of BSA prepared by plotting various concentrations of BSA against absorbance at 595 nm, followed by mixing 2 μL of protein sample and 1 mL of Bradford reagent (IX), transferring to a 96-well plate (200 μL), and measuring absorbance at 595 nm.
Next, a 40 μg sample solution was mixed with sample buffer and reacted in a 95°C water bath for 5 minutes, followed by cooling on ice, and then added to the sample tank for protein separation on 12% SDS-polyacrylamide gel under 80 V. Then, the separated proteins were transferred onto a polyvinylidene fluoride (PVDF) membrane, which was presoaked in methanol for 30 seconds for activation and then immersed in transfer buffer. After transferring at 4°C under 100 V for 1 hour, the PVDF membrane was soaked in blocking buffer containing 5% skim milk and reacted for 1 hour to remove unwanted protein for noise prevention. Then, the Tris-buffered saline with Tween 20 (TBST) buffer solution containing 0.1% Tween 20, 150 mM NaCl, and 10 mM Tris-HCl (pH 8.0) was added for washing three times to remove unattached protein, followed by addition of the primary antibody in an appropriate dilution ratio including cyclin B (1:1,000), P53 (1:1,000), P21 (1:500), CDK (1:2,000), cytochrome C (1:500), and BcL-2 (1:2,500). After reacting at 4°C for overnight, the TBST buffer solution was added for washing three times, and the horseradish peroxidase (HRP)-conjugated secondary antibody (IgG) was added for reaction at room temperature for 1 hour. Then, the TBST buffer solution was added for washing several times, and the ECL reagent was added to produce chemiluminescence through oxidation of luminol for detection by autoradiograph film and measurement of protein expression intensity by a BioSpectrum 500 image analysis system.
Expression of caspase-3, -8, and -9
Cells (2×10⁵) were seeded in a six-well plate and cultured overnight for cell adhesion. Then, the culture medium was removed and replaced with various concentrations of curcuminoid extract or nanoemulsion. After incubation for 24 hours, PBS (4°C) was added for washing, followed by adding 100 μL lysis buffer to each well, scratching cells, and transferring to a tube for reaction for 30 minutes on ice. For caspase-3, 25 μL of the cell medium was added to a 96-well plate and 100 μL of HEPES buffer (IX) containing 2.5 μL of Ac-DEVD-AMC was added for reaction at 37°C for 1 hour, after which the absorbance was measured by a fluorometer with excitation wavelength at 380 nm and emission wavelength at 460 nm. But for caspase-8 and caspase-9, 50 μL of the cell medium was added to a 96-well plate and 50 μL of the reaction buffer (2X) containing 0.5 μL of 1.0 M DTT, 5 μL of 1 mM LEHD-AFC was added for reaction at 37°C for 1 hour, after which the absorbance was measured by a fluorometer with excitation wavelength at 400 nm and emission wavelength at 505 nm.
Statistical analysis
All the determinations were performed at least in triplicates and the data were subjected to analysis of variance (ANOVA) and Duncan’s multiple range test for significance in mean comparison (P<0.05) by using the Statistical Analysis System.19
Ethical statement
The approval for carrying out the entire work was approved by the institutional ethics committee of Fu Jen Catholic University, New Taipei City, Taiwan.
Results and discussion
HPLC analysis of curcuminoids
In several earlier studies, various curcuminoids were quantified by spectrophotometry or thin-layer chromatography.20,21 However, both the methods are less accurate in quantifying bismethoxycurcumin, demethoxycurcumin, and curcumin due to limitation in separating the three curcuminoids with adequate resolution and high purity. Thus, in recent years, many HPLC methods coupled with photodiode array detector (HPLC-DAD) and mass spectrometry (HPLC-MS) were developed to separate and quantify the three curcuminoids with most mobile phases being composed of water–methanol or water–acetonitrile and addition of acid as modifier to reduce peak tailing.17,22 In our study, a gradient mobile phase of water and acetonitrile with 0.1% formic acid as modifier was developed to separate and quantify the three curcuminoids in C. longa extract by HPLC-DAD-MS. Figure 1 shows the HPLC chromatogram of the three curcuminoids and IS. The retention time, absorption, and mass spectra data of bisdemethoxycurcumin, demethoxycurcumin, and curcumin are shown in Table 1. All the three curcuminoids were positively identified through comparison of retention times, absorption spectra, and mass spectra with reference compounds and values reported in the literature.23,24 Quantitation was based on the linear regression equation obtained from each standard calibration curve, with bisdemethoxycurcumin being y=2.2011x+0.0011 (R=0.9995), demethoxycurcumin y=2.2x+0.0023 (R=0.9995), and curcumin y=2.1973x+0.0054 (R=0.9995). The contents of bisdemethoxycurcumin, demethoxycurcumin, and curcumin were 190.2±3.2 μg/mL, 1,147.4±1.7 μg/mL, and 1,714.5±1.0 μg/mL, respectively, in C. longa extract based on duplicate analyses. In a similar study, Li et al17 determined curcuminoids in eight Curcuma species and reported that the content of curcumin ranged from 4.18 to 22.28 mg/g in rhizomes of C. longa, 0.12 to 1.29 mg/g in roots of C. longa, and 0.026 to 0.072 mg/g in rhizomes of Curcuma phaeocaulis. However, no curcumin was detected in the roots of C. phaeocaulis, Curcuma wenyujin, and Curcuma kwangsiensis, demonstrating that the rhizome of C. longa species is the most abundant source of curcumin.17
Figure 1.
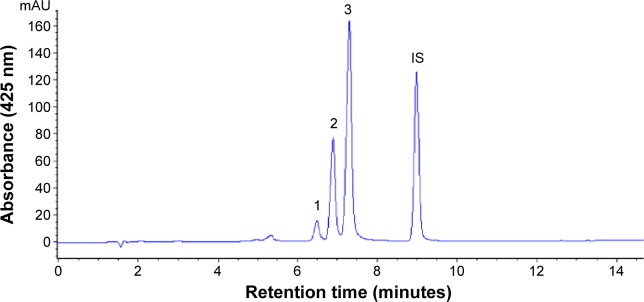
HPLC chromatogram of curcumin from Curcuma longa extract by employing a gradient system of 0.1% formic acid in water and acetonitrile.
Notes: Peak 1, bisdemethoxycurcumin; peak 2, demethoxycurcumin; peak 3, curcumin.
Abbreviations: HPLC, high-performance liquid chromatography; IS, internal standard.
Table 1.
Retention time, UV-VIS, and MS spectral data for curcuminoid in Curcuma longa Linnaeus
| Peak number | Compound | tR (minutes) | λmax (on-line)b | λmax (reported)c | m/z (on-line) | m/z (reported)d |
|---|---|---|---|---|---|---|
| 1 | Bisdemethoxycurcumina | 6.48 | 248, 416 | 248, 416 | 306 [M-H]- | 307 |
| 2 | Demethoxycurcumina | 6.89 | 252, 420 | 252, 422 | 336 [M-H]- | 337 |
| 3 | Curcumina | 7.30 | 262, 424 | 264, 428 | 367 [M-H]- | 367 |
| IS | Methyl red | 8.98 | 502 | – | – |
Notes:
Compound conclusively identified by comparison with authentic standard.
A gradient mobile phase of 0.1% formic acid in water and acetonitrile (from 60:40 v/v to 10:90 v/v) was used.
A gradient mobile phase of 0.1% formic acid in water and acetonitrile (from 82:18 v/v to 15:85, v/v) was used by Karioti et al.24
Based on a reference by Inoue et al.23
Abbreviations: IS, internal standard; MS, mass spectra; UV-VIS, ultraviolet visible.
Preparation of curcuminoid nanoemulsion
As mentioned earlier, due to low aqueous solubility, instability at physiological pH, and low bioavailability, the possibility of developing curcuminoid as a botanic drug remains questionable.25,26 For instance, Lao et al27 reported that the curcuminoid concentration in human serum was 50 ng/mL after oral intake of 10 or 12 g/mL of curcuminoid, revealing the limitation in therapeutic efficiency through blood circulation. However, this drawback can be overcome by preparing curcuminoid nanoemulsion as reported in some other studies.28,29 In our experiment, a crude curcuminoid extract (1.97 mL) was collected and evaporated to dryness under nitrogen, followed by adding 0.24 g of Tween 80 as emulsifier, thoroughly mixing this mixture, adding 2.76 g of deionized water, and stirring again for Tween 80 dispersion in water. Then, this solution was sonicated for 60 minutes to obtain a clear and transparent nanoemulsion (3 mL) containing curcuminoid at a concentration of 2,000 μg/mL.
Characteristics of curcuminoid nanoemulsion
Figure 2A and B show the particle size distribution of curcuminoid nanoemulsion as measured by DLS and TEM, respectively, with an average particle size of 12.6 nm and 13.7 nm, respectively. A homogeneous dispersion of curcuminoids is observed in Figure 2A, while a spherical shape of nanoemulsion particle is observed in Figure 2B. During storage of curcuminoid nanoemulsion at 4°C for 3 months, the average particle size ranged from 11.5 to 12.3 nm as determined by DLS, indicating that a high stability of curcuminoid nanoemulsion was successfully prepared. Also, on the basis of HPLC analysis, only a minor change in contents of bisdemethoxycurcumin, demethoxycurcumin, and curcumin was found over a 3-month storage period, and the encapsulation efficiency was determined to be approximately 75%.
Figure 2.
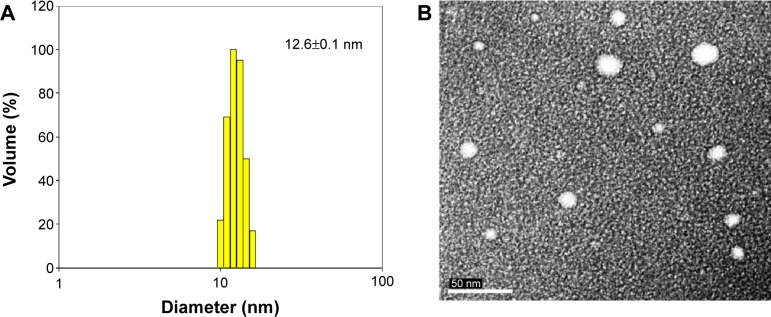
Particle size distribution of curcuminoid nanoemulsions.
Notes: Dynamic light scattering analysis (A) and transmission electron micrograph (B).
In several previous studies, Wang et al30 prepared a nanoemulsion composed of medium chain triglyceride, Tween 20, and water (10:10:80 v/v/v) and compared the effects of different high pressures on particle size and polydispersity. Results showed that after treatment at 600, 1,000, and 1,500 bar, the size was 184.7, 127.0, and 82.1 nm, respectively, implying that higher the pressure, the smaller the size. In another report, a curcuminoid nanoemulsion composed of polyethylene glycol 400 (PEG 400), Tween 80, and propylene glycol) was prepared by Onoue et al31 and the average particle size was determined to be approximately 196 nm by TEM. Similarly, Lin et al32 prepared a curcuminoid nanoemulsion composed of soybean lecithin, soybean oil, and Tween 80, and reported a size distribution of 40–50 nm as well as a high stability over a storage period of 968 days. Comparatively, in our study, a much smaller size of curcuminoid nanoemul-sion could be prepared by sonication instead of high-pressure homogenization. Obviously, the selection of an appropriate emulsifier mixed with water and oil-soluble extract in a suitable proportion is crucial to obtain a stable nanoemulsion with a small size.
Dose effect of solvent and nanoemulsion on lung cancer cells
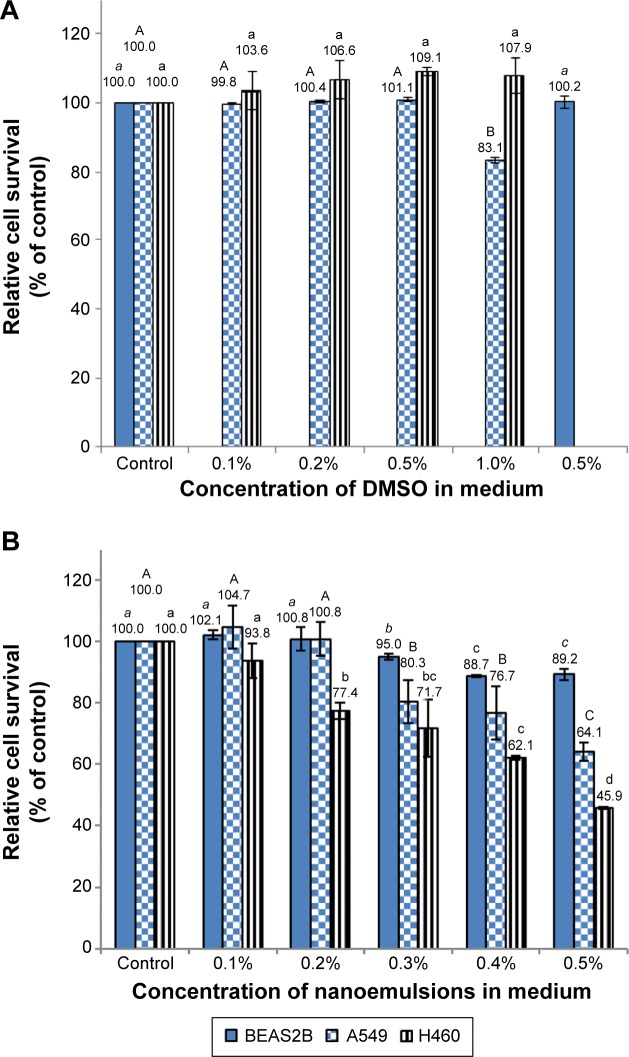
Figure 3 shows the effect of different doses of solvent (DMSO) and nanoemulsion on lung cancer cell lines A549 and H460, as well as on normal bronchus epithelial cell BEAS-2B. With a DMSO concentration range of 0.1%–0.5% in the medium, no significant difference (P>0.05) in cell viability of A549, H460, and BEAS-2B was observed (Figure 3A). However, the cell viability of A549 declined to 83% following a rise in DMSO concentration to 1% (Figure 3A). Thus, the DMSO concentration of 0.5% was used for subsequent experiment. In addition, the effect of blank nanoemulsion (without curcuminoid) on the growth of the three cell lines was determined. Following an increase in nanoemulsion concentration in the medium, the growth of all the three cell lines was affected significantly (P<0.05) (Figure 3B). For example, with a nanoemulsion concentration of 0.3% in the medium, the cell viability of both A549 and BEAS-2B decreased significantly (P<0.05) (Figure 3B). However, when the nanoemulsion concentration in the medium was controlled at 0.1%, there was no significant difference (P>0.05) in the cell viability of the three cell lines (Figure 3B). Therefore, the nanoemulsion concentration of 0.1% was selected for subsequent experiment.
Figure 3.
Relative survival of A549, H460, and BEAS-2B cells.
Notes: Relative survival of the cells as affected by different doses of DMSO (A) and blank nanoemulsions (B) in the medium as determined by MTT assay. Data with different letters in each cell line are significantly different at P<0.05.
Abbreviations: DMSO, dimethyl sulfoxide; MTT, 3-(4,5-dimethylthiazol-2-yl)-2,5-diphenyltetrazolium bromide.
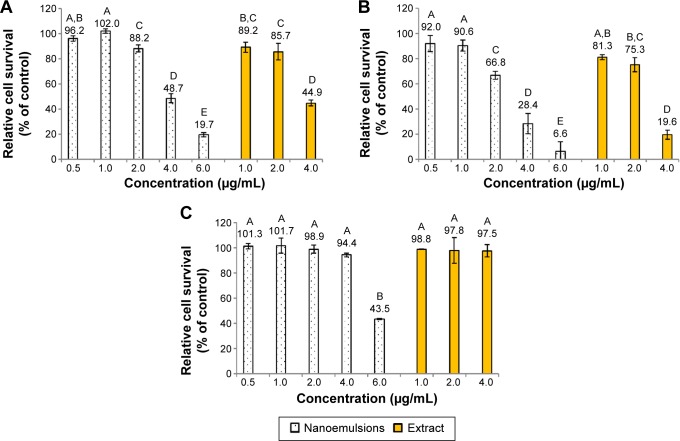
Figure 4 shows the inhibition effect of curcuminoid nanoemulsion and curcuminoid extract on the growth of cell lines A549, H460, and BEAS-2B after 48 hours of treatment. The IC50 values of A549 and H460 were shown to be 3.9 and 2.9 μg/mL for nanoemulsion treatment, respectively, while for the extract treatment, the IC50 values of A549 and H460 were found to be 3.75 and 2.9 μg/mL, respectively. With the nanoemulsion treatment at 2 μg/mL, the cell viability of A549 and H460 declined to 88.2% and 66.8%, respectively, and further dropped to 48.7% and 28.4% at 4 μg/mL, and 19.7% and 6.6% at 6 μg/mL, respectively. For the extract treatment at 4 μg/mL, the cell viability of A549 and H460 decreased to 44.9% and 19.6%, respectively. This outcome implied that both nanoemulsion and extract treatments possessed a higher inhibition effect toward H460 cells than A549 cells. By comparison, both nanoemulsion and extract treatments showed a similar inhibition effect toward A549 and H460 cells (Figure 4), probably caused by the inadequate dose of curcuminoid in the nanoemulsion. It is worth pointing out that with a concentration range from 1 to 4 μg/mL for both nanoemulsion and extract treatments, the growth of BEAS-2B cells remained unaffected. But with the nanoemulsion concentration at 6 μg/mL, the cell viability of BEAS-2B diminished to 43.5%. This result further demonstrated that the most appropriate concentration for both nanoemulsion and extract treatments should be controlled at 4 μg/mL. In addition, we also investigated the inhibition effect of both A549 and H460 cell lines as affected by the nanoemulsion after storage for 90 days (Figure 5). There was only a slight difference between fresh and stored nanoemulsions in inhibiting the growth of A549 and H460. The IC50 values of A549 and H460 cells for the stored nanoemulsion were 3.8 and 2.8 μg/mL, respectively, which were similar to those for the fresh nanoemulsion. This phenomenon further proved that nanoemulsion with high stability was prepared in our experiment.
Figure 4.
Inhibition effect of curcuminoid nanoemulsions and Curcuma longa extract.
Notes: Inhibition effect on the growth of A549 (A), H460 (B), and BEAS-2B (C) cells after 48 hours of treatment as determined by MTT assay. Data with different letters are significantly different at P<0.05.
Abbreviation: MTT, 3-(4,5-dimethylthiazol-2-yl)-2,5-diphenyltetrazolium bromide.
Figure 5.
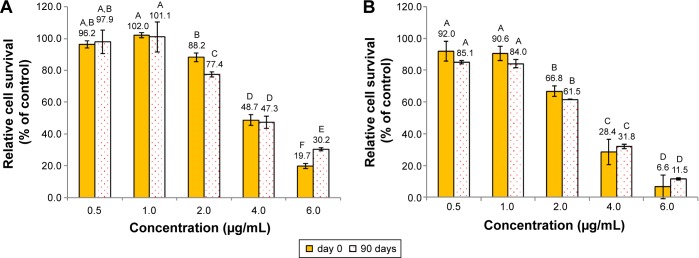
Inhibition effect of curcuminoid nanoemulsions stored for 0 and 90 days.
Notes: Inhibition effect on the growth of A549 (A) and H460 (B) cells after 48 hours treatment as determined by MTT assay. Data with different letters are significantly different at P<0.05.
Abbreviation: MTT, 3-(4,5-dimethylthiazol-2-yl)-2,5-diphenyltetrazolium bromide.
Most published reports used curcumin standard to study its inhibition effect on cancer cells. For instance, Yoon and Lee33 reported that with a curcumin concentration range of 20–100 μM, the cell viability of A549 decreased significantly after 96 hours of treatment. Likewise, a 50% inhibition of A549 cells was observed after curcumin treatment for 48 hours at 16.28 μM.34 A similar outcome was shown for H460 cells after treatment with 5–50 μM curcumin for 24 hours.35 Comparatively, the IC50 values of A549 and H460 cells were much lower in our study than those reported in the literature, which could be due to the presence of bisdemethoxycurcumin, demethoxycurcumin, and curcumin in both nanoemulsion and extract. In other words, a synergistic effect could be responsible for this phenomenon. In addition to lung cancer cells, the IC50 of prostate cancer cells (LNCaP, PC3, Du-145) was shown to be in the range of 20–22.5 μM after the treatment of curcumin-loaded PLGA nanosphere.36 Similarly, a curcumin nanoemulsion composed of glyceryl monooleate and pluronic F-127 as encapsulating agent was found to be efficient in inhibiting various types of cancer cells, including pancreatic cancer (PANC-1, MIA PaCa-2), breast cancer (MCF-7), colon cancer (HCT-116), lung cancer (A549), and leukemia (K562).37 As mentioned earlier, in our study, both nanoemulsion and extract showed a similar inhibition effect on the growth of lung cancer cells A549 and H460. This phenomenon was also observed by Anuchapreeda et al38 who studied the effect of nano-curcumin and non-nano-curcumin on the growth of melanoma cells (B16F10) and leukemia cells (HL60, K562, Molt4, U937), and IC50 was found to be in the range of 22.2–53.7 μM for the nano-curcumin treatment and 3.5–38.7 μM for the non-nano-curcumin treatment. It was postulated that the slow release of curcumin from nanoemulsion might cause this difference.38
Morphological changes of A549 and H460 cells
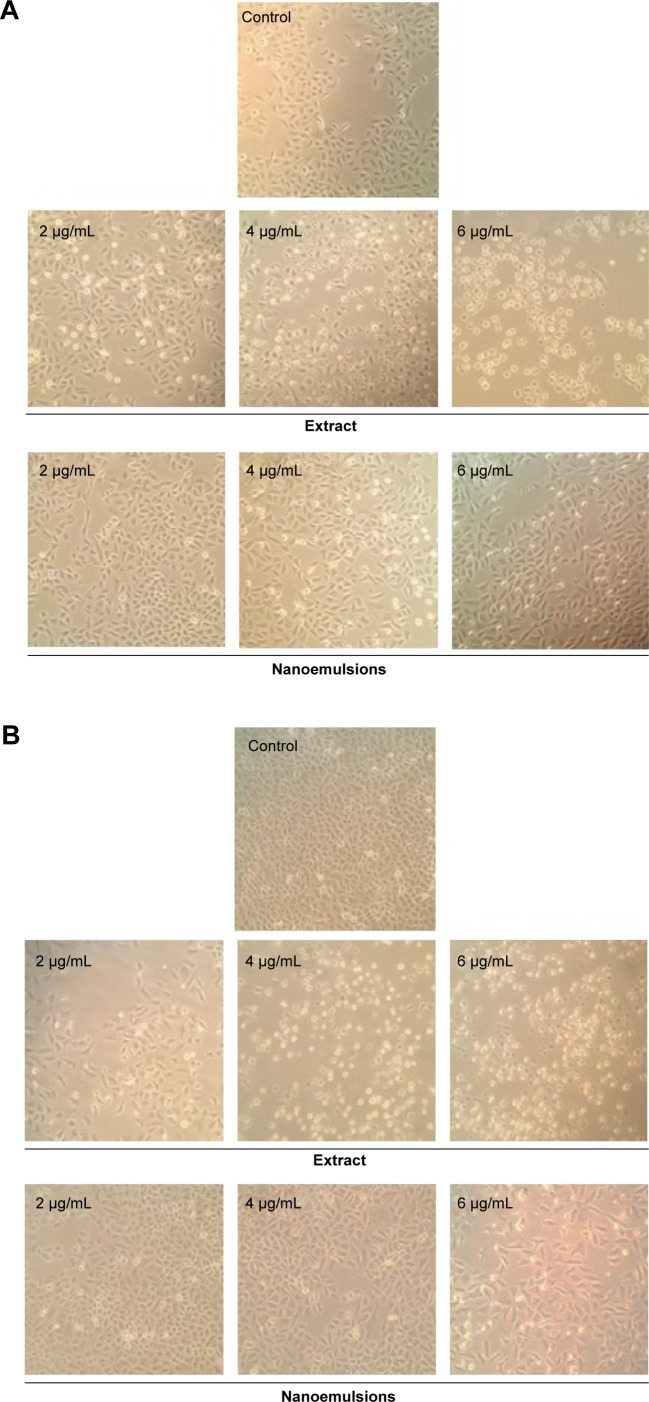
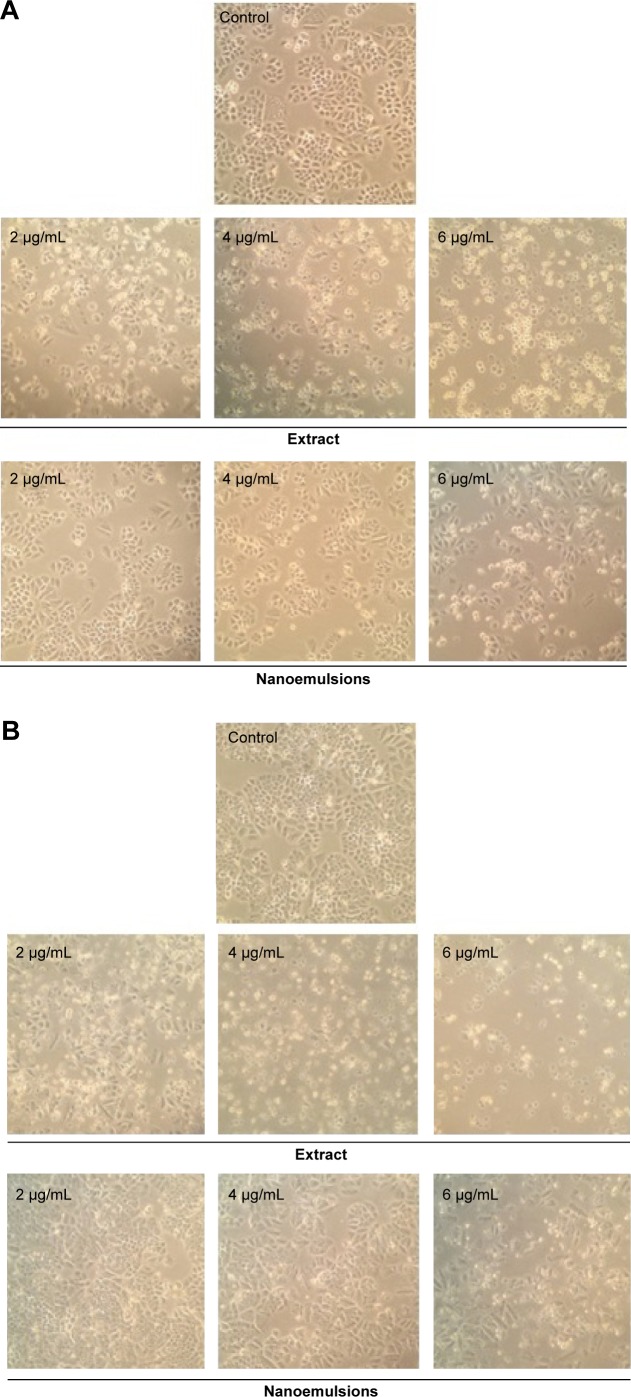
Figures 6 and 7 show the morphological changes of lung cancer cells A549 and H460, respectively, when treated with curcuminoid nanoemulsion and extract for 24 hours (A) and 48 hours (B). After treatment with curcuminoid extract at 2 μg/mL for 24 hours, the phenomenon of cell shrinkage occurred, which became more severe at 6 μg/mL, accompanied by rounded cell appearance, poor cell adhesion, and cell number reduction. However, after treatment with curcuminoid nanoemulsion at 2 and 4 μg/mL for 24 hours, there was no significant change in morphology, but cells became more elongated and shrunk at 6 μg/mL. A similar morphological change was observed for A549 and H460 cells after treatment with curcuminoid extract or nanoemulsion for 48 hours. Comparatively, both nanoemulsion and extract can cause a pronounced morphological alteration in both A549 and H460 cells in a time- and dose-dependent manner. A similar outcome was observed by Lin et al39 and Wu et al35 who studied the morphological changes of A549 and H460 cells after treatment with curcumin standard, respectively.
Figure 6.
Morphological changes in A549 lung cancer cells.
Notes: Change after 24 hours (A), and 48 hours (B) of treatment with curcuminoid nanoemulsions and Curcuma longa extract, as captured using Nikon TS100-F microscope at 10×10 magnification. Control represents the cells incubated with medium only.
Figure 7.
Morphological changes in H460 lung cancer cells.
Notes: Change after 24 hours (A), and 48 hours (B) of treatment with curcuminoid nanoemulsions and Curcuma longa extract, as captured using Nikon TS100-F microscope at 10×10 magnification. Control represents the cells incubated with medium only.
Cell cycle of A549 and H460 cells
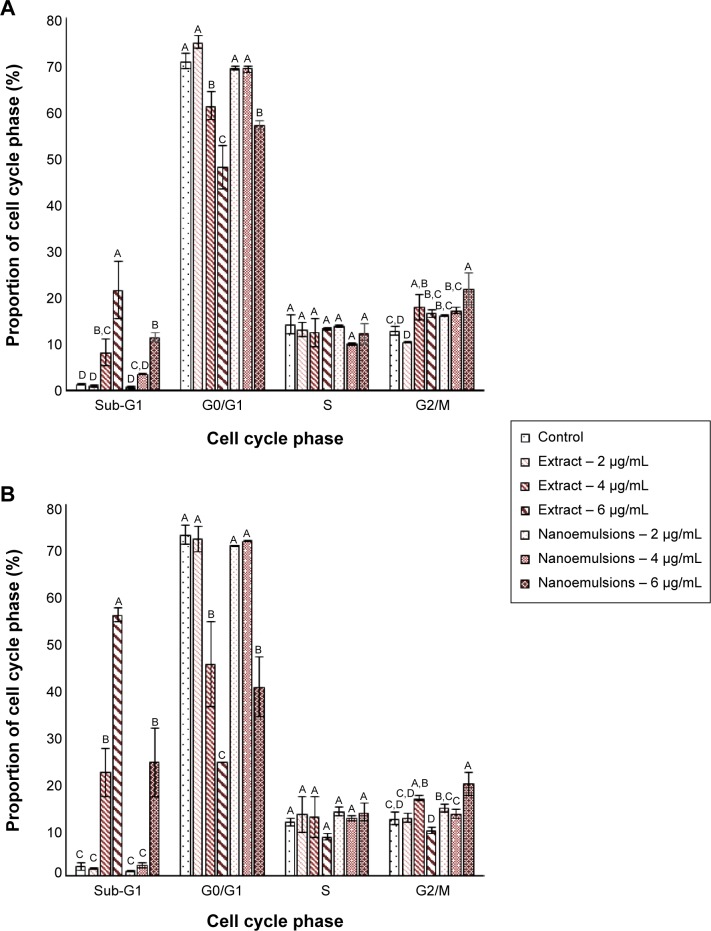
Figure 8 shows the effect of curcuminoid nanoemulsion and extract on cell cycle distribution of A549 and H460 cells. The sub-G1 proportion of both A549 and H460 cells followed a dose-dependent increase after treatment with curcuminoid nanoemulsion and extract. Compared to control, the sub-G1 proportion of A549 was significantly higher after both the treatments at 4 and 6 μg/mL. Conversely, the G0/G1 proportion showed a dose-dependent decrease for both the cell lines after both the treatments. For instance, the G0/G1 proportion of A549 dropped to 47.9% and 57% from 74.8% and 69.2%, respectively, after treatment with curcuminoid extract and nanoemulsion. Compared to control, the G0/G1 proportion of A549 was significantly lower after the extract treatment at 4 and 6 μg/mL and the nanoemulsion treatment at 6 μg/mL. However, there was no significant difference in the S phase ratio of A549 after both the treatments. Similar to sub-G1, the G2/M proportion of A549 showed a dose-dependent rise, but there was no significant difference between 4 and 6 μg/mL after the extract treatment and between 2 and 4 μg/mL after the nanoemulsion treatment. The cell cycle of A549 could be arrested at G2/M phase after treatment with both extract and nanoemulsion. A similar trend was observed for the cell cycle distribution of H460 cells. The sub-G1 proportion followed a dose-dependent increase, while the G0/G1 proportion showed a dose-dependent decrease. But there was no significant difference in the G0/G1 proportion of H460 between 2 and 4 μg/mL after the nanoemulsion treatment. Interestingly, after the extract treatment, there was a rise in the G2/M proportion from 12.5% (2 μg/mL) to 16.7% (4 μg/mL), which dropped to 9.8% (6 μg/mL). As for the nanoemulsion treatment, the G2/M proportion increased from 14.6% (2 μg/mL) to 19.8% (6 μg/mL). Similar to A549 cells, the cell cycle of H460 could be arrested at G2/M phase for induction of apoptosis.
Figure 8.
Cell cycle distribution.
Notes: Distribution of A549 (A) and H460 (B) cell lines as affected by curcuminoid nanoemulsions and Curcuma longa extract. Data are presented as mean ± standard deviation (n=3), different letters within each stage of cell cycle are significantly different at P<0.05.
Similar outcome was reported in several previous studies. Lin et al39 studied the effect of curcumin standard (5–40 μM) on the growth of A549 cells and reported that the cell cycle was arrested at G2/M phase after 48 hours of treatment. Likewise, the G2/M proportion was shown to increase following a rise in curcumin dose (0–10 μM), with the cell cycle of H460 being arrested at G2/M after 24 hours treatment.35 For some other types of cancer cells, the cell cycle was also arrested at G2/M for brain cancer cell,40 liver cancer cell,41 and colon cancer cell.42 However, the cell cycle of breast cancer cell MCF-7 was found to be arrested at G1.43 This outcome implied that the regulation mechanism of cell cycle may be varied for different types of cancer cells.
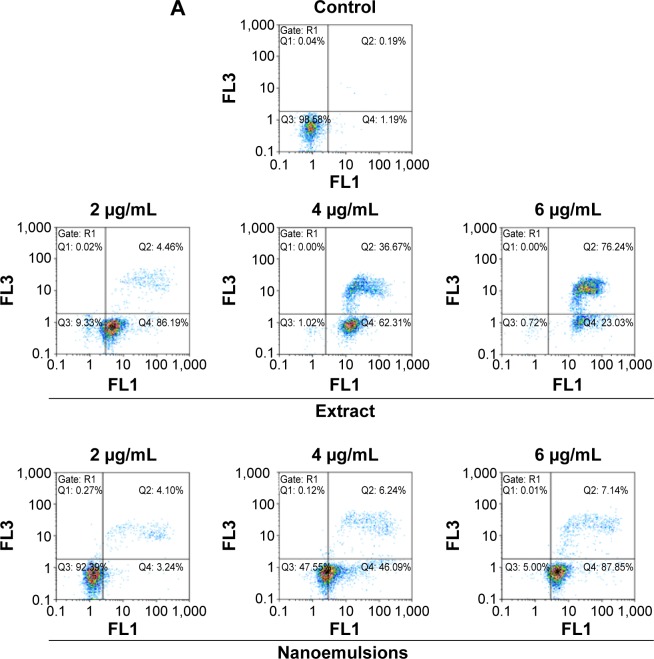
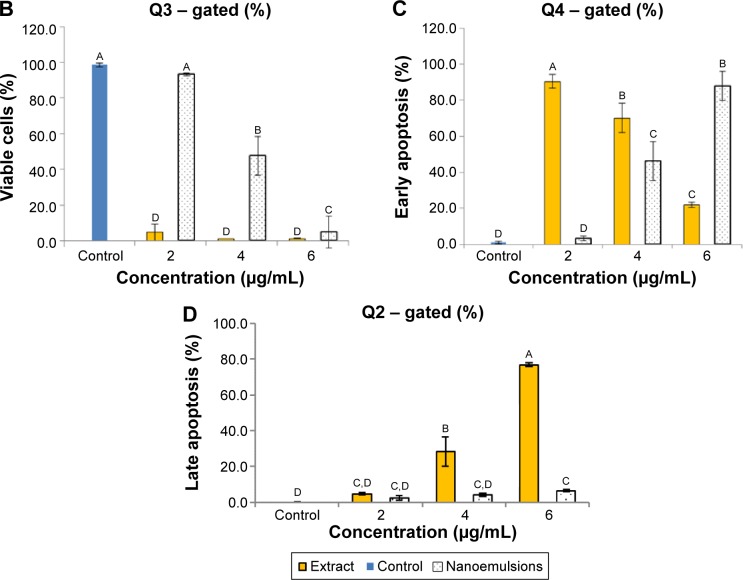
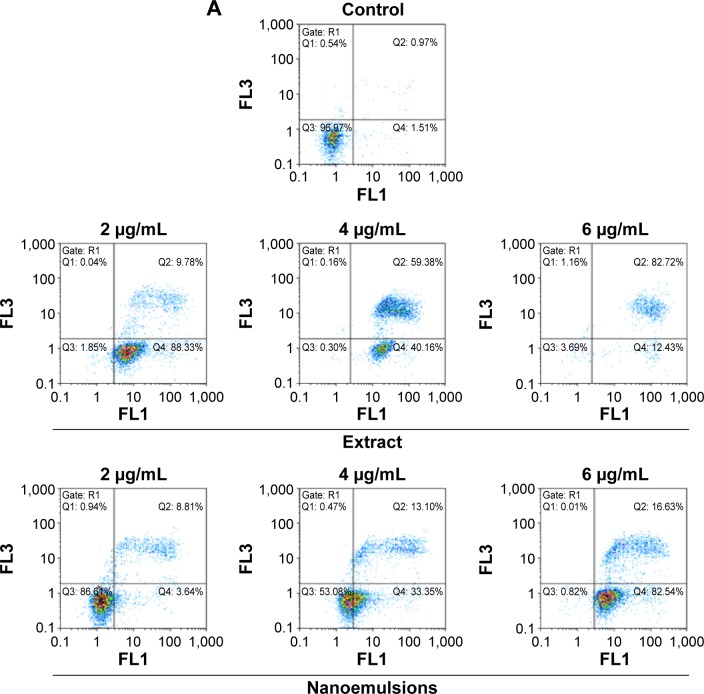
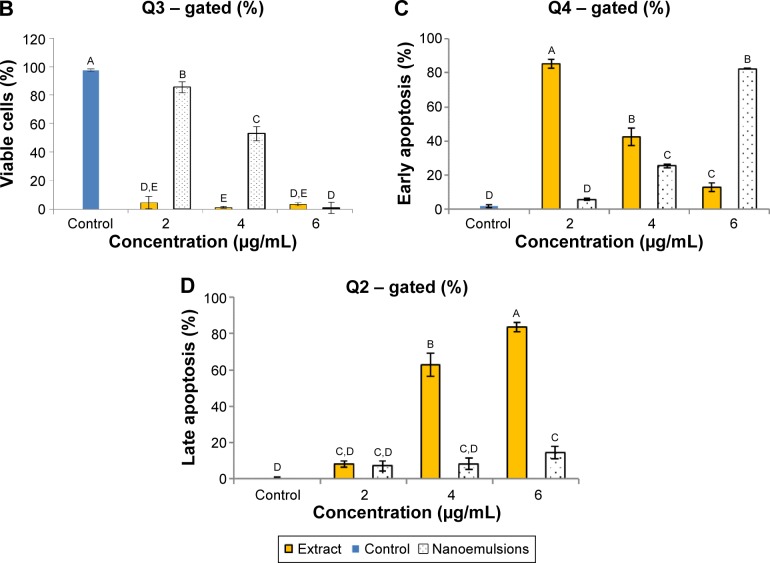
Figures 9 and 10 show the effect of curcuminoid extract and nanoemulsion on apoptosis of A549 and H460 cells, respectively. The early apoptotic cell population (Q4) of A549 was shown to follow a dose-dependent decrease, while the late apoptotic cell population (Q2) followed a dose-dependent increase after treatment with curcuminoid extract for 24 hours. A plateau of late apoptotic population (76.24%) was attained at 6 μg/mL. However, a different tendency was shown for the nanoemulsion treatment as the early apoptotic A549 cell population followed a dose-dependent rise and reached 87.85% after 24 hours of incubation. Though the late apoptotic cell population showed a dose-dependent rise after the nanoemulsion treatment, a slight change occurred, as evident by a maximum of only 7.14% after treatment of A549 cells with 6 μg/mL. It is worth pointing out that the viable cell population of A549 accounted for 9.33% and 92.39% after treatment with the curcuminoid extract and nanoemulsion at 2 μg/mL, respectively, and further declined to 0.72% and 5% at 6 μg/mL, respectively. By comparison, the extract should be more efficient in inhibiting A549 cell growth than the nanoemulsion. A similar tendency was observed for H460 cells (Figure 10), ie, the early apoptotic cell population showed a dose-dependent decline, while the late apoptotic cell population showed a dose-dependent rise after treatment with the curcuminoid extract for 24 hours, with a peak of 82.72% being reached at 6 μg/mL. For the nanoemulsion treatment, a different trend was observed, as shown by a dose-dependent increase of the early apoptotic cell population, with a maximum of 82.54% being reached at 6 μg/mL. Also, the viable cell population accounted for 1.85% and 86.61% after treatment with the curcuminoid extract and nanoemulsion at 2 μg/mL, respectively, but further changed to 3.69% and 0.82% at 6 μg/mL, respectively. Taken together, it may be inferred that both the extract and nanoemulsion treatments can induce apoptosis of A549 and B460 cells for subsequent necrosis.
Figure 9.
Apoptosis of A549 cell line.
Notes: Apoptosis as affected by curcuminoid nanoemulsions and Curcuma longa extract (A) and quantitative analysis of viable cells (Q3) (B), early apoptosis cells (Q4) (C), and late apoptosis cells (Q2) (D). Control represents the cells incubated with medium only. Data with different letters are significantly different at P<0.05.
Figure 10.
Apoptosis of H460 cell line.
Notes: Apoptosis as affected by curcuminoid nanoemulsions and Curcuma longa extract (A) and quantitative analysis of viable cells (Q3) (B), early apoptosis cells (Q4) (C), and late apoptosis cells (Q2) (D). Control represents the cells incubated with medium only. Data with different letters are significantly different at P<0.05.
In some other studies, Chen et al44 reported that after treatment with curcumin (40 μM) for 24 and 48 hours, the early apoptotic cell population of A549 increased to 30.49% and 53.21%, respectively. Also, the A549 cells followed a time-and dose-dependent increase after curcumin treatment.39,45 Likewise, curcumin possessed a similar effect on antiproliferation of some other types of cancer cells. For example, the apoptotic cell population of breast cancer cells MCF-7 and MCF-10A increased to 92.6% and 53.9%, respectively, after curcumin treatment (0–100 μg/mL). Also, the early apoptotic cell population of nasopharyngeal cancer CNE-2z increased to 22% and 52.8% after curcumin treatment at 100 and 200 μM, respectively.46 In a study dealing with the effect of curcumin at 20 and 40 μM on the growth of liver cancer cell SMMC-7721, the early apoptotic cell population increased to 14.23% and 27.38%, respectively.47 All these outcomes are in agreement with our findings in this study, as shown by an early apoptotic cell population of 46.09% and 33.35% for A549 and H460 cells, respectively, after 24 hours of treatment with curcuminoid nanoemulsion.
Expression of proteins associated with cell cycle and apoptosis in A549 and H460 cells
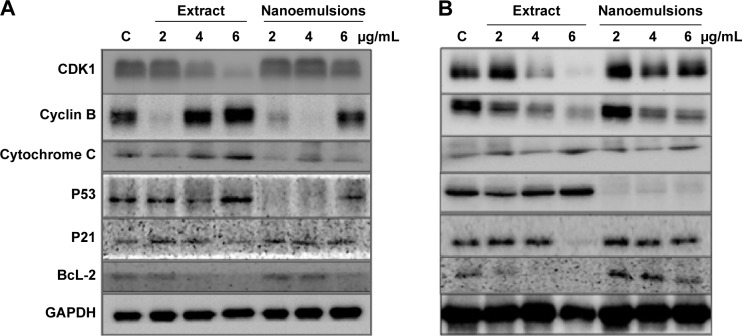
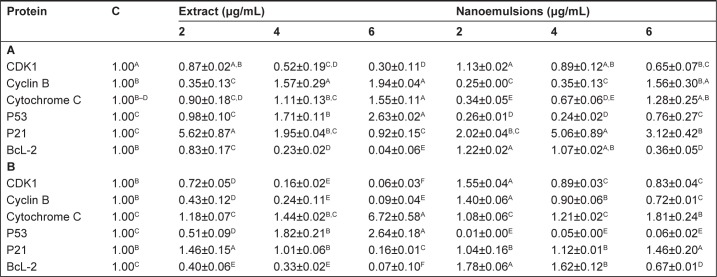
Figure 11A shows the protein expression associated with cell cycle and apoptosis in A549 cell line as affected by curcuminoid extract and nanoemulsion. As mentioned earlier, the cell cycle of A549 was retarded at G2/M after curcuminoid extract or nanoemulsion treatment. As the cell cycle can be regulated through cyclins, CDKs, and some other proteins, the expression of cyclin B, the protein associated with regulation of G2/M phase, was investigated. It was shown that the cyclin B expression followed a dose-dependent increase for both extract and nanoemulsion treatments. However, at the same dose, the extract showed a higher expression of cyclin B than the nanoemulsion. Conversely, the expression of CDK1, the protein conjugated with cyclin B, showed a dose-dependent decrease. By comparison, the extract showed a lower expression of CDK1 than the nanoemulsion.
Figure 11.
Expression of proteins.
Notes: Expression in A549 (A) and H460 (B) cell lines as affected by curcuminoid nanoemulsions and Curcuma longa extract along with data being presented as mean ± standard deviation (n=3) and different letters within each protein indicating significantly different values at P<0.05. C in each protein expression panel represents cells incubated with medium only. Data are expressed as the relative fold of C.
Abbreviations: C, control; GAPDH, glyceraldehyde 3-phosphate dehydrogenase.
Theoretically, cell apoptosis can occur through two pathways: mitochondria pathway (intrinsic pathway) and death receptor pathway (extrinsic pathway). Factors such as genetic damage, hypoxia, high calcium concentration, and oxidative stress can induce apoptosis through the former pathway, resulting in a rise of the outer membrane permeability of mitochondria and subsequent release of proapoptotic proteins such as cytochrome C into cytoplasm for conjugation with Apaf-1 to activate procaspase-9, followed by apoptosome complex formation, and then caspase-3 activation.48 Both the curcuminoid extract and nanoemulsion treatments resulted in a dose-dependent increase of cytochrome C expression, with the former being higher than the latter at the same dose. P53, a vital transcription protein responsible for inhibition of tumor growth, regulation of cell cycle, and apoptosis through mitochondria pathway, can be activated to induce cell cycle arrest for repair of damaged DNA. However, when DNA is seriously damaged, cells will proceed to undergo apoptosis.49 It was shown that the P53 expression followed a dose-dependent increase after treatment with both curcuminoid extract and nanoemulsion, with the former being much higher than the latter at the same dose (Figure 11A). In addition to P53, P21 is also important in regulating cell cycle and apoptosis. P21, a downstream gene activated by P53, can inhibit CDK activity for cell cycle arrest.50 Also, the activation of P21 can affect the expression of cyclin B and CDK1, resulting in a lower activity of cyclin B/CDK1 complex for subsequent cell cycle arrest at G2/M.51 Interestingly, P21 showed a maximum expression at 2 μg/mL for curcuminoid extract and at 4 μg/mL for nanoemulsion. It may be postulated that the decreased expression of P21 is caused by apoptosis. Also, a declined trend may occur after a plateau expression of P21 was reached. BcL-2, a protein responsible for inhibition of cell apoptosis, was shown to follow a dose-dependent decline in expression after treatment with both curcuminoid extract and nanoemulsion, with the former being much lower than the latter. This outcome implied that both extract and nanoemulsion treatments possessed a pronounced effect in inducing A549 cell apoptosis at a high dose (6 μg/mL).
For H460 cell line, with the exception of cyclin B, the expressions of proteins showed a similar trend as A549 cell line (Figure 11B), ie, the expressions of cytochrome C and P53 followed a dose-dependent increase, while those of CDK1 and BcL-2 followed a dose-dependent decline after treatment with both curcuminoid and nanoemulsion. However, a reversed tendency was shown for cyclin B expression. Similarly, P21 showed a maximum expression at 2 μg/mL after the extract treatment, but at 6 μg/mL for the nanoemulsion treatment. It may be inferred that for H460 cell line, P21 activation is dependent on P53 regulation for the extract treatment, while for the nanoemulsion treatment, P21 activation is independent of P53 regulation. Similar outcomes were reported in several previous studies. For example, after treatment of H460 cells with curcumin, the CDK1 expression decreased and resulted in a cell cycle arrest at G2/M phase.35 Likewise, following treatment of A549 cells with curcumin, the expressions of CDK1 and cyclin B1 declined, while those of P53 and P21 increased, leading to cell cycle arrest at G2/M phase.39 In another study, Yang et al52 further pointed out that curcumin could inhibit small lung cancer cell NCI-H446 through inhibition of cyclin B1 expression, arresting cell cycle at G2/M. Similar phenomenon was observed in some other types of cancer cells, including nasopharyngeal cell NPC-TW076,53 tongue squamous cell SCC-4,54 and esophageal cells (KYSE450, OE21, OE33).55 In addition, the expression of cytochrome C was found to increase, while that of BcL-2 decreased for several types of cancer cells.35,41,53,54
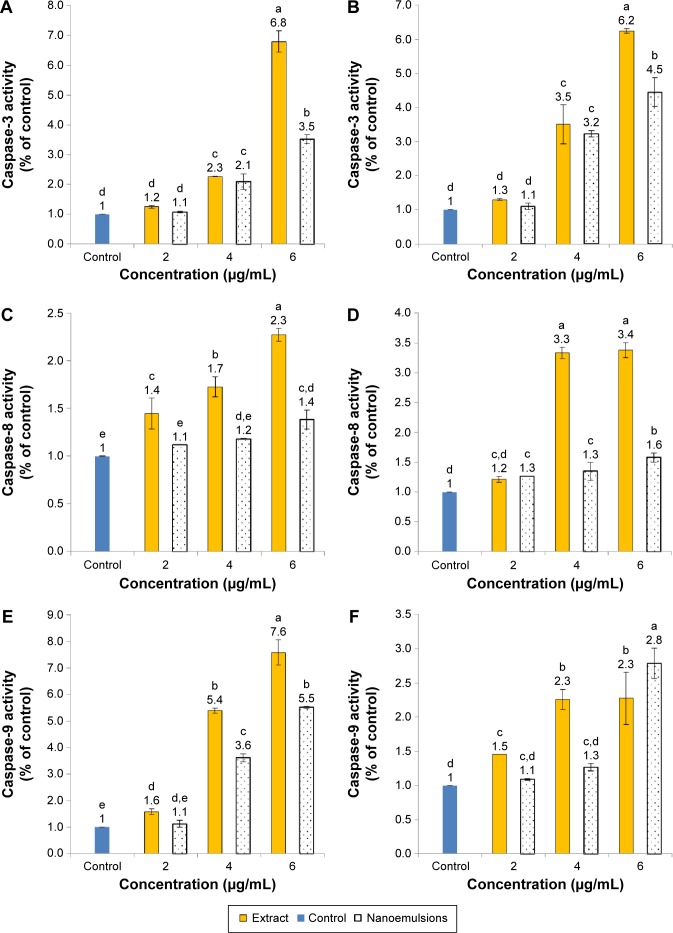
Figure 12 shows expressions of caspase-3, -8, and -9 as affected by curcuminoid extract and nanoemulsion treatments. The expression of caspase-3 followed a dose-dependent increase for both A549 and H460 cells after treatment with both curcuminoid extract and nanoemulsion (Figure 12A and B). Comparatively, the extract treatment showed a more pronounced effect in enhancing the expression of caspase-3 than the nanoemulsion treatment for both A549 and H460 cells. However, at the same dose, a higher expression of caspase-3 in H460 than that in A549 was observed. A similar trend was observed for caspase-8 and caspase-9. However, unlike the curcuminoid extract treatment, only a slight increase in caspase-8 expression in both A549 and H460 cells was observed following an increase of the nanoemulsion dose (Figure 12C and D). Also, at the same dose, the extract treatment, and not the nanoemulsion treatment, induced a higher expression of caspase-3 in H460 cells than in A549 cells. In other words, only a minor difference in caspase-3 expression was observed between H460 and A549 cells after the nanoemulsion treatment. Similar to caspase-3, a dose-dependent increase in caspase-9 expression was observed for both H460 and A549 cells after treatment with both extract and nanoemulsion (Figure 12E and F). However, the extract could result in a higher expression of caspase-9 than the nanoemulsion for A549 cells at 4 and 6 μg/mL, and for H460 cells at 4 μg/mL. But at the same dose of 4 or 6 μg/mL, a higher caspase-9 expression in A549 cells was found than that in H460 cells for both extract and nanoemulsion treatments. On the basis of the findings shown earlier, both extract and nanoemulsion could activate caspase-9 through release of cytochrome C from mitochondria for conjugation with procaspase-9 for cell apoptosis. Nevertheless, as both extract and nanoemulsion could activate caspase-8 as well, both pathways involving mitochondria and death receptor should be responsible for apoptosis of A549 and H460 cells. Likewise, caspase-3 was activated following treatment of A549 and H460 cells with curcumin, as reported by Lin et al39 and Wu et al35 respectively. Also, both the studies showed a time- or dose-dependent increase in caspase-3 activity. The same outcome was observed in some other types of cancer cells, including ovarian cancer,56 liver cancer,41 and kidney cancer.57
Figure 12.
Activities of caspase-3, caspase-8, and caspase-9.
Notes: Activities in A549 (A, C, E) and H460 (B, D, F) cells as affected by curcuminoid nanoemulsions and Curcuma longa extract after 24 hours treatment. Control represents the cells incubated with medium only. Data with different letters are significantly different at P<0.05.
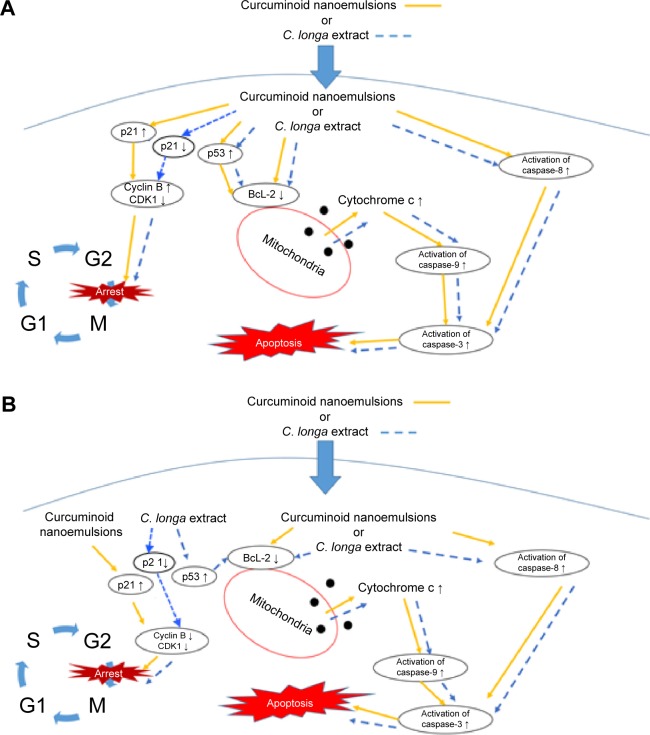
Figure 13 shows the hypothesized signaling pathways of A549 and H460 cells after treatment with both curcuminoid extract and nanoemulsion, respectively. Accordingly, non-small lung cell carcinoma can be divided into lung cell adenocarcinoma, squamous lung cell carcinoma, and large lung cell carcinoma, all of which account for 85% of lung carcinoma. In our study, we demonstrated that the effect of both extract and nanoemulsion treatments on A549 and H460 cells can be different. Comparatively, H460 cells from large lung cell carcinoma were more susceptible to apoptosis than A549 cells from lung adenocarcinoma. It was shown that for A549 cells, the P21 expression was enhanced through elevation of P53 expression after nanoemulsion treatment, resulting in a rise in cyclin B expression and inhibition of CDK1 expression for subsequent cell cycle arrest at G2/M. However, for H460 cells, the increase of P21 expression after nanoemulsion treatment could lead to a decline in the expression of both cyclin B and CDK1 for subsequent cell cycle arrest at G2/M. But for the curcuminoid extract treatment, the increase in P53 expression could result in a decline in P21 expression for both A549 and H460 cells. This outcome revealed that in addition to mitochondria and death receptor, some other pathways may be involved in apoptosis of both A549 and H460 cells after treatment with curcuminoid extract.
Figure 13.
Hypothesized signaling pathways.
Note: Pathways in A549 (A) and H460 (B) cell lines depicting G2/M arrest and apoptosis induced by curcuminoid nanoemulsions or C. longa extract.
Abbreviations: C. longa, Curcuma longa; S, synthesis phase; G1, growth-1/gap-1 phase; G2, growth-2/gap-2 pre-mitotic phase; M, mitosis phase.
In conclusion, an HPLC method was developed to separate and quantify the various curcuminoids in C. longa extract by employing an Eclipse XDB-C18 column (150×4.6 mm ID, 5 μm particle size), including curcumin (1,714.5 μg/mL), demethoxycurcumin (1,147.4 μg/mL), and bisdemethoxycurcumin (190.2 μg/mL). A nanoemulsion composed of curcuminoid extract, 8% Tween 80, and 92% water was prepared with a mean particle size of 12.6 nm, which showed a high stability after 90 days of storage. H460 cells were more susceptible to apoptosis than A549 cells after treatment with both curcuminoid extract and nanoemulsion. Both mitochondria and death receptor pathways may be responsible for apoptosis of A549 and H460 cells. The cell cycle was arrested at G2/M for both extract and nanoemulsion treatments; however, the inhibition pathway may be different. All the activities of caspase-3, caspase-8, and caspase-9 followed a dose-dependent increase for both A549 and H460 cells after treatment with extract and nanoemulsion, accompanied by a dose-dependent rise in cytochrome C expression and a dose-dependent decrease in CDK1 expression. However, for the cyclin B expression, a dose-dependent rise was observed for A549 cells after both the treatments, while a reversed trend was observed for H460 cells.
Acknowledgments
The authors wish to thank Mr Yen-Sheng Wu from Tzong Jao Hang’s Electron Microscope Laboratory, School of Medicine, Fu Jen Catholic University, Taipei, Taiwan, for technical assistance in recording the TEM image.
Footnotes
Disclosure
The authors report no conflicts of interest in this work.
References
- 1.Tsai YM, Jan WC, Chien CF, Lee WC, Lin LC, Tsai TH. Optimized nano-formulation on the bioavailability of hydrophobic polyphenol, curcumin, in freely-moving rats. Food Chem. 2011;127(3):918–925. doi: 10.1016/j.foodchem.2011.01.059. [DOI] [PubMed] [Google Scholar]
- 2.Bar-Sela G, Schaffer M. An evidence-based perspective of Curcuma longa (Turmeric) for cancer patients. In: Cho WCS, editor. Evidence-based Anticancer Materia Medica. the Netherlands: Springer; 2011. pp. 225–243. [Google Scholar]
- 3.Henry BS. Natural food colours. In: Houghton JD, Hendry GAF, editors. Natural Food Colorants. New York, USA: Springer; 1996. pp. 40–79. [Google Scholar]
- 4.Anand P, Kunnumakkara AB, Newman R, Aggarwal BB. Bioavailability of curcumin: problems and promises. Mol Pharm. 2007;4(6):807–818. doi: 10.1021/mp700113r. [DOI] [PubMed] [Google Scholar]
- 5.Ministry of Health . Statistics of Cause of Death. Taipei, Taiwan: Ministry of Health; 2014. [Google Scholar]
- 6.Taiwan Lung Cancer Society . Hundreds of Questions for Lung Cancer. Taipei, Taiwan: Taiwan Lung Cancer Society; 2014. [Google Scholar]
- 7.Herbst RS, Heymach JV, Lippman SM. Lung cancer. N Engl J Med. 2008;359(13):1367–1380. doi: 10.1056/NEJMra0802714. [DOI] [PMC free article] [PubMed] [Google Scholar]
- 8.American Cancer Society . Lung Cancer (Non-Small Cell) Atlanta, Georgia: 2013. (American Joint Committee on Cancer Staging (AJCC-2010)). [Google Scholar]
- 9.Kim DS, Park SY, Kim JK. Curcuminoids from Curcuma longa L. (Zingiberaceae) that protect PC12 rat pheochromocytoma and normal human umbilical vein endothelial cells from betaA(1–42) insult. Neurosci Lett. 2001;303(1):57–61. doi: 10.1016/s0304-3940(01)01677-9. [DOI] [PubMed] [Google Scholar]
- 10.Shishodia S, Amin HM, Lai R, Aggarwal BB. Curcumin (diferuloylmethane) inhibits constitutive NF-KappaB activation, induces G1/S arrest, suppresses proliferation, and induces apoptosis in mantle cell lymphoma. Biochem Pharmacol. 2005;70:700–713. doi: 10.1016/j.bcp.2005.04.043. [DOI] [PubMed] [Google Scholar]
- 11.Lin SS, Lai KC, Hsu SC, et al. Curcumin inhibits the migration and invasion of human A549 lung cancer cells through the inhibition of matrix metalloproteinase-2 and -9 and vascular endothelial growth factor (VEGF) Cancer Lett. 2009;285(2):127–133. doi: 10.1016/j.canlet.2009.04.037. [DOI] [PubMed] [Google Scholar]
- 12.Aggarwal BB, Banerjee S, Bharadwaj U, Sung B, Shishodia S, Sethi G. Curcumin induces the degradation of cyclin E expression through ubiquitin-dependent pathway and up-regulates cyclin-dependent kinase inhibitors p21 and p27 in multiple human tumor cell lines. Biochem Pharmacol. 2007;73(7):1024–1032. doi: 10.1016/j.bcp.2006.12.010. [DOI] [PubMed] [Google Scholar]
- 13.Tharakan ST, Inamoto T, Sung B, Aggarwal BB, Kamat AM. Curcumin potentiates the antitumor effects of gemcitabine in an orthotopic model of human bladder cancer through suppression of proliferative and angiogenic biomarkers. Biochem Pharmacol. 2010;79(2):218–228. doi: 10.1016/j.bcp.2009.08.007. [DOI] [PMC free article] [PubMed] [Google Scholar] [Retracted]
- 14.Kang HJ, Lee SH, Price JE, Kim LS. Curcumin suppresses the paclitaxel-induced nuclear factor-kappaB in breast cancer cells and potentiates the growth inhibitory effect of paclitaxel in a breast cancer nude mice model. Breast J. 2009;15(3):223–229. doi: 10.1111/j.1524-4741.2009.00709.x. [DOI] [PubMed] [Google Scholar]
- 15.Chen YJ, Inbaraj BS, Pu YS, Chen BH. Development of lycopene micelle and lycopene chylomicron and a comparison of bioavailability. Nanotechnology. 2014;25(15):155102. doi: 10.1088/0957-4484/25/15/155102. [DOI] [PubMed] [Google Scholar]
- 16.Huang RFS, Wei YJ, Inbaraj BS, Chen BH. Inhibition of colon cancer cell growth by nanoemulsion carrying gold nanoparticles and lycopene. Int J Nanomedicine. 2015;10:2823–2846. doi: 10.2147/IJN.S79107. [DOI] [PMC free article] [PubMed] [Google Scholar]
- 17.Li R, Xiang C, Ye M, Li HF, Zhang X, Guo DA. Qualitative and quantitative analysis of curcuminoids in herbal medicines derived from Curcuma species. Food Chem. 2011;126(4):1890–1895. doi: 10.1016/j.foodchem.2010.12.014. [DOI] [PubMed] [Google Scholar]
- 18.Bisht S, Feldmann G, Soni S, et al. Polymeric nanoparticle-encapsulated curcumin (“nanocurcumin”): a novel strategy for human cancer therapy. J Nanobiotechnology. 2007;5:3. doi: 10.1186/1477-3155-5-3. [DOI] [PMC free article] [PubMed] [Google Scholar]
- 19.Statistical Analysis System . SAS Procedures and SAS/Graph User’s Guide Version 6. Cary, NC: SAS Institute Inc; 2014. [Google Scholar]
- 20.Barrero MM, Carrero RJ. Pigments evaluation in turmeric cropped in Venezuela. Agron Trop. 1999;49:491–504. [Google Scholar]
- 21.Chempakam B, Leela NK, John SP. Distribution of curcuminoids during rhizome development in turmeric (Curcuma longa L.) Spices Aromat Plants. 2000;15:293–296. [Google Scholar]
- 22.Jiang H, Timmermann BN, Gang DR. Use of liquid chromatography-electrospray ionization tandem mass spectrometry to identify diarylheptanoids in turmeric (Curcuma longa L.) rhizome. J Chromatogr A. 2006;1111:21–31. doi: 10.1016/j.chroma.2006.01.103. [DOI] [PubMed] [Google Scholar]
- 23.Inoue K, Hamasaki S, Yoshimura Y, et al. Validation of LC/Electrospray–MS for determination of major curcuminoids in foods. J Liq Chrom Rel Techniq. 2003;26:53–62. [Google Scholar]
- 24.Karioti A, Fani E, Vincieri FF, Bilia AR. Analysis and stability of the constituents of Curcuma longa and Harpagophytum procumbens tinctures by HPLC-DAD and HPLC-ESI-MS. J Pharm Biomed Anal. 2011;55(3):479–489. doi: 10.1016/j.jpba.2011.02.029. [DOI] [PubMed] [Google Scholar]
- 25.Tonnesen HH. Solubility, chemical and photochemical stability of curcumin in surfactant solutions. Studies of curcumin and curcuminoids, XXVIII. Pharmazie. 2002;57(12):820–824. [PubMed] [Google Scholar]
- 26.Goel A, Jhurani S, Aggarwal BB. Multi-targeted therapy by curcumin: how spicy is it? Mol Nutr Food Res. 2008;52(9):1010–1030. doi: 10.1002/mnfr.200700354. [DOI] [PubMed] [Google Scholar]
- 27.Lao CD, Ruffin MT, Normolle D, et al. Dose escalation of a curcuminoid formulation. BMC Complement Altern Med. 2006;6:10. doi: 10.1186/1472-6882-6-10. [DOI] [PMC free article] [PubMed] [Google Scholar]
- 28.Huang Q, Yu H, Ru Q. Bioavailability and delivery of nutraceuticals using nanotechnology. J Food Sci. 2010;75(1):R50–R57. doi: 10.1111/j.1750-3841.2009.01457.x. [DOI] [PubMed] [Google Scholar]
- 29.Bansal SS, Goel M, Aquil F, Vadhanam MV, Gupta RC. Advanced drug delivery systems of curcumin for cancer chemoprevention. Cancer Prev Res (Phila) 2011;4(8):1158–1171. doi: 10.1158/1940-6207.CAPR-10-0006. [DOI] [PMC free article] [PubMed] [Google Scholar]
- 30.Wang X, Jiang Y, Wang YW, Huang MT, Ho CT, Huang Q. Enhancing anti-inflammation activity of curcumin through O/W nanoemulsions. Food Chem. 2008;108(2):419–424. doi: 10.1016/j.foodchem.2007.10.086. [DOI] [PubMed] [Google Scholar]
- 31.Onoue S, Takahashi H, Kawabata Y, et al. Formulation design and photochemical studies on nanocrystal solid dispersion of curcumin with improved oral bioavailability. J Pharm Sci. 2010;99(4):1871–1881. doi: 10.1002/jps.21964. [DOI] [PubMed] [Google Scholar]
- 32.Lin YL, Liu YK, Tsai NM, et al. A lipo-PEG-PEI complex for encapsu-lating curcumin that enhances its antitumor effects on curcumin-sensitive and curcumin-resistance cells. Nanomedicine. 2012;8(3):318–327. doi: 10.1016/j.nano.2011.06.011. [DOI] [PubMed] [Google Scholar]
- 33.Yoon H, Lee CY. Effect of selected phytochemicals on cell proliferation in A549 lung cancer cells. Food Sci Biotechnol. 2010;19:1063–1068. [Google Scholar]
- 34.Zhang J, Zhang T, Ti X, et al. Curcumin promotes apoptosis in A549/DDP multidrug-resistant human lung adenocarcinoma cells through an miRNA signaling pathway. Biochem Biophys Res Comm. 2010;399:1–6. doi: 10.1016/j.bbrc.2010.07.013. [DOI] [PubMed] [Google Scholar]
- 35.Wu SH, Hang LW, Yang JS, et al. Curcumin induces apoptosis in human non-small cell lung cancer NCI-H460 cells through ER stress and caspase cascade- and mitochondrial-dependent pathways. Anticancer Res. 2010;30(6):2125–2133. [PubMed] [Google Scholar]
- 36.Mukerjee A, Vishwanatha JK. Formulation, characterization and evaluation of curcumin-loaded PLGA nanospheres for cancer therapy. Anticancer Res. 2009;29(10):3867–3875. [PubMed] [Google Scholar]
- 37.Mohanty C, Sahoo SK. The in vitro stability and in vivo pharmacokinetics of curcumin prepared as an aqueous nanoparticulate formulation. Biomaterials. 2010;31(25):6597–6611. doi: 10.1016/j.biomaterials.2010.04.062. [DOI] [PubMed] [Google Scholar]
- 38.Anuchapreeda S, Fukumori Y, Okonogi S, Ichikawa H. Preparation of lipid nanoemulsion incorporating curcumin for cancer therapy. J Nanotechnol. 2012;2012:1–11. [Google Scholar]
- 39.Lin SS, Huang HP, Yang JS, et al. DNA damage and endoplasmic reticulum stress mediated curcumin-induced cell cycle arrest and apoptosis in human lung carcinoma A-549 cells through the activation caspases cascade- and mitochondrial-dependent pathway. Cancer Lett. 2008;272:77–90. doi: 10.1016/j.canlet.2008.06.031. [DOI] [PubMed] [Google Scholar]
- 40.Su CC, Wang MJ, Chiu TL. The anti-cancer efficacy of curcumin scrutinized through core signaling pathways in glioblastoma. Int J Mol Med. 2010;26(2):217–224. doi: 10.3892/ijmm_00000455. [DOI] [PubMed] [Google Scholar]
- 41.Cheng CY, Lin YH, Su CC. Curcumin inhibits the proliferation of human hepatocellular carcinoma J5 cells by inducing endoplasmic reticulum stress and mitochondrial dysfunction. Int J Mol Med. 2010;26(5):673–678. doi: 10.3892/ijmm_00000513. [DOI] [PubMed] [Google Scholar]
- 42.Van Erk MJ, Teuling E, Staal YC, et al. Time- and dose-dependent effect of curcumin on gene expression in human colon cancer cells. J Carcinog. 2004;3(1):8. doi: 10.1186/1477-3163-3-8. [DOI] [PMC free article] [PubMed] [Google Scholar]
- 43.Li HQ, Jin LJ, Wu FF, et al. Effect of curcumin on proliferation, cell cycle, and caspases and MCF-7 cells. Afr J Pharm Pharmacol. 2012;6(12):864–870. [Google Scholar]
- 44.Chen QY, Shi JG, Yao QH, et al. Lysosomal membrane permeabilization is involved in curcumin-induced apoptosis of A549 lung carcinoma cells. Mol Cell Biochem. 2012;359(1–2):389–398. doi: 10.1007/s11010-011-1033-9. [DOI] [PubMed] [Google Scholar]
- 45.Chen Q, Wang Y, Xu K, et al. Curcumin induces apoptosis in human lung adenocarcinoma A549 cells through a reactive oxygen species-dependent mitochondrial signaling pathway. Oncol Rep. 2010;23:397–403. [PubMed] [Google Scholar]
- 46.Wu Q, Hou YL, Sun B, Zhuang K, Zhang HC, Jin DJ. Curcumin induce apoptosis of CNE-2z cells via caspase-dependent mitochondrial intrinsic pathway. Afr J Pharm Pharmacol. 2011;7(5):1748–1756. [Google Scholar]
- 47.Yu J, Zhou XM, He XS, Dai MH, Zhang Q. Curcumin induces apoptosis involving bax/bcl-2 in human hepatoma SMMC-7721 cells. Asian Pac J Cancer Prev. 2011;12:1925–1929. [PubMed] [Google Scholar]
- 48.Daniel NN, Korsmeyer SJ. Cell death: critical control points. Cell. 2004;116(2):205–219. doi: 10.1016/s0092-8674(04)00046-7. [DOI] [PubMed] [Google Scholar]
- 49.Vousden KH, Lane DP. p53 in health and disease. Nat Rev Mol Cell Biol. 2007;8(4):275–283. doi: 10.1038/nrm2147. [DOI] [PubMed] [Google Scholar]
- 50.Shu KX, Li B, Wu LX. The p53 network: p53 and its downstream genes. Colloids Surf B Biointerfaces. 2007;55(1):10–18. doi: 10.1016/j.colsurfb.2006.11.003. [DOI] [PubMed] [Google Scholar]
- 51.Lin YL, Su YT, Chen BH. A study on inhibition mechanism of breast cancer cells by bis-type triaziquone. Eur J Pharmacol. 2010;637(1–3):1–10. doi: 10.1016/j.ejphar.2010.03.034. [DOI] [PubMed] [Google Scholar]
- 52.Yang CL, Liu YY, Ma YG, et al. Curcumin blocks small cell lung cancer cells migration, invasion, angiogenesis, cell cycle and neoplasia through Janus kinase-STAT3 signalling pathway. PLoS One. 2012;7(5):e37960. doi: 10.1371/journal.pone.0037960. [DOI] [PMC free article] [PubMed] [Google Scholar]
- 53.Kuo CL, Wu SY, Ip SW, et al. Apoptotic death in curcumin-treated NPC-TW 076 human nasopharyngeal carcinoma cells is mediated through the ROS, mitochondrial depolarization and caspase-3-dependent signaling responses. Int J Oncol. 2011;39(2):319–328. doi: 10.3892/ijo.2011.1057. [DOI] [PubMed] [Google Scholar]
- 54.Ip SW, Wu SY, Yu CC, et al. Induction of apoptotic death by curcumin in human tongue squamous cell carcinoma SCC-4 cells is mediated through endoplasmic reticulum stress and mitochondria-dependent pathways. Cell Biochem Funct. 2011;29(8):641–650. doi: 10.1002/cbf.1800. [DOI] [PubMed] [Google Scholar]
- 55.O’Sullivan-Coyne G, O’Sullivan GC, O’Donovan TR, Piwocka K, McKenna SL. Curcumin induces apoptosis-independent death in oesophageal cancer cells. British J Cancer. 2009;101(9):1585–1595. doi: 10.1038/sj.bjc.6605308. [DOI] [PMC free article] [PubMed] [Google Scholar]
- 56.Weir NM, Selvendiran K, Kutala VK, et al. Curcumin induces G2/M arrest and apoptosis in cisplatin-resistant human ovarian cancer cells by modulating Akt and p38 MAPK. Cancer Biol Ther. 2007;6(2):178–184. doi: 10.4161/cbt.6.2.3577. [DOI] [PMC free article] [PubMed] [Google Scholar]
- 57.Woo JH, Kim YH, Choi YJ, et al. Molecular mechanisms of curcumin-induced cytotoxicity: induction of apoptosis through generation of reactive oxygen species, down-regulation of Bcl-XL and IAP, the release of cytochrome c and inhibition of Akt. Carcinogenesis. 2003;24(7):1199–1208. doi: 10.1093/carcin/bgg082. [DOI] [PubMed] [Google Scholar]


