

Abstract
Transcription factors that mediate neuronal defenses against diverse stresses were quantified in plasma neural-derived exosomes of Alzheimer’s disease or frontotemporal dementia patients and matched controls. Exosomal levels of low-density lipoprotein receptor-related protein 6, heat-shock factor-1, and repressor element 1-silencing transcription factor all were significantly lower in Alzheimer’s disease patients than controls (P < 0.0001). In frontotemporal dementia, the only significant difference was higher levels of repressor element 1-silencing transcription factor than in controls. Exosomal transcription factors were diminished 2–10 years before clinical diagnosis of Alzheimer’s disease. Low exosomal levels of survival proteins may explain decreased neuronal resistance to Alzheimer’s disease neurotoxic proteins.
Introduction
Deficiencies of transcription factors that protect neurons from diverse stresses have been implicated in progression and severity of Alzheimer’s disease (AD).1,2 Repressor element 1-silencing transcription factor (REST) is expressed at high levels in aging human brain, where it maintains factors that enhance neuronal resistance to stresses and apoptosis.1,3 Nuclear levels of REST and its recognition motif, termed RE1, are lower in autopsy brain tissues of patients with AD than cognitively normal controls.1 A complex of low-density lipoprotein receptor-related protein 6 (LRP6) and Frizzled receptors bind Wnt ligands and thereby evoke nuclear translocation of β-catenin that activates genes encoding survival factors such as REST.4–6 As for REST, LRP6-Wnt signaling is decreased in autopsy brain tissue from AD patients and deletion of the Lrp6 gene selectively in mouse forebrain neurons enhances AD-like pathology.2 The heat-shock factor-1 (HSF1) maintains neuronal defenses by increasing expression of heat-shock family chaperones and cytoskeletal-protective calcium-sensing proteins, but has not been adequately studied in human neurodegenerative diseases.7–9
Recent analyses of proteins extracted from immunochemically isolated neurally derived plasma exosomes have shown significantly higher levels of pathogenic P-T181-tau, P-S396-tau and Aβ1–42, as well as altered levels of phosphorylated forms of the insulin receptor proximal signaling protein, termed insulin receptor substrate (IRS) in AD as contrasted with controls.10,11 Plasma neurally derived exosomal levels of P-T181-tau, P-S396-tau, Aβ1–42, and phosphorylated forms of IRS were significantly different in preclinical AD (AP) than for controls up to 10 years before appearance of neurological signs.10 Here, we demonstrate significant differences between AD patients and controls in neural exosomal contents of transcription factors mediating neuronal resistance to diverse stresses.
Patients and Methods
Experimental design and patient evaluation
We identified 24 patients for cross-sectional studies (one blood sample at the National Institute on Aging [NIA]) and 16 patients for longitudinal studies (one blood sample at diagnosis [longitudinal AD set] and another 2–10 years earlier [longitudinal AP set] at the Mayo Clinic or the University of Kentucky) (Table1). Samples from the longitudinal study were analyzed without knowledge of any clinical data. Amnestic mild cognitive impairment (MCI) and dementia from AD were diagnosed as described, using established criteria.10–17 Ten patients with the behavioral variant of frontotemporal dementia (FTD) were from the Memory and Aging Center of the Department of Neurology of the University of California, San Francisco. Their diagnosis and assignment to mild or moderate dementia groups (Table1) were based on standard criteria.18,19 Cognitively normal control subjects for FTD (FTC) and both AD sets (AC) were from the NIA (28/50) or the Jewish Home of San Francisco (22/50) and were matched by age, gender, and race to FTD and AD patients in cross-sectional and longitudinal studies.
Table 1.
Characteristics of patients and control subjects
| Diagnosis | Total | Neurological Subgroup | |||||||
|---|---|---|---|---|---|---|---|---|---|
| n | Male/female | Ages Mean ± SD (range) | n | MMSE scores Mean ± SEM | n | MMSE scores Mean ± SEM | n | MMSE scores Mean ± SEM | |
| (A) Cross-sectional studies | |||||||||
| MCI | Dementia | Normal | |||||||
| AD | 24 | 12/12 | 75.7 ± 7.59 (62–92) | 16 | 27.1 ± 0.51 | 8 | 23.8 ± 0.59** | 0 | |
| AC | 24 | 12/12 | 75.1 ± 7.18 (62–92) | 0 | 0 | 24 | 29.2 ± 0.36 | ||
| Mild dementia | Moderate dementia | Normal | |||||||
| FTD | 10 | 7/3 | 64.5 ± 9.13 (52–74) | 6 | 26.8 ± 2.14 | 4 | 17.4 ± 2.72* | 0 | |
| FTC | 10 | 7/3 | 64.2 ± 8.76 (52–74) | 0 | 0 | 10 | 28.5 ± 0.72 | ||
| (B) Longitudinal studies | |||||||||
| MCI | Dementia | Normal | |||||||
| AP | 16 | 7/9 | 78.2 ± 6.44 (68–88) | 0 | 0 | 16 | 29.0 ± 0.31 | ||
| AD | 16 | 7/9 | 83.8 ± 7.54 (71–97) | 7 | 24.0 ± 0.90 | 9 | 21.3 ± 1.53** | 0 | |
| AC | 16 | 7/9 | 78.3 ± 5.99 (68–88) | 0 | 0 | 16 | 28.7 ± 0.47 | ||
The significance of differences in MMSE values between AD dementia and MCI (parts A and B), and between FTD moderate dementia and mild dementia (part A) were calculated by an unpaired t test. MMSE, Mini-Mental State Examination; n, number of subjects; AD, Alzheimer’s disease; MCI, mild cognitive impairment; FTD, frontotemporal dementia.
P < 0.01 and
P < 0.001.
Each subject and some patient designates signed consent forms approved with the protocol at each institution. Thirty milliliter of venous blood were drawn into 100 U/mL of heparin and centrifuged for 15 min at 2000g. Plasmas were stored in 0.5 mL aliquots at −80°C.
Isolation of plasma exosomes for extraction and Enzyme-Linked Immunosorbent Assay (ELISA) quantification of exosome proteins
Two hundred fifty microliters of plasma were incubated with 0.10 mL of thromboplastin-D (Fisher Scientific, Inc., Hanover Park, IL) followed by addition of 0.15 mL of calcium- and magnesium-free Dulbecco’s balanced salt solution (DBS−2) with three-times the recommended concentrations of protease inhibitor cocktail (Roche Applied Sciences, Inc., Indianapolis, IN) and phosphatase inhibitor cocktail (Pierce Halt; Thermo Scientific, Inc., Rockford, IL).10,11 ExoQuick (EXOQ; System Biosciences, Inc., Mountainview, CA) was added to 3000g supernates to precipitate total exosomes, that were re-suspended for immunochemical enrichment of exosomes from neural sources.10,11
Exosomes absorbed by mouse anti-human CD171 (L1 cell adhesion molecule [L1CAM] neural adhesion protein) biotinylated antibody (clone 5G3; eBioscience, San Diego, CA) and Streptavidin-Plus UltraLink resin (Pierce-Thermo Scientific, Inc.) were released into 50 μL of 0.05 mol/L acetic acid (pH 2.5) followed by addition to 3000g supernates of 42 μL of 3% bovine serum albumin (BSA), 8 μL of 1 mol/L Tris-HCl (pH 8.0) and 0.40 mL of M-PER mammalian protein extraction reagent (Thermo Scientific, Inc.).10,11
Neural exosomal proteins neuron-specific enolase (NS-enolase) (R&D Systems, Inc., Minneapolis, MN), type 1 neural cell adhesion molecule (NCAM-1) (Raybiotech, Inc., Norcross, GA) and tetraspanning exosome marker human CD81 (Cusabio-American Research Products, Inc., Waltham, MA) were quantified in the linear range of ELISAs. Transcription factors were quantified by ELISAs for HSF1 (Enzo Life Sciences, Inc., Farmingdale, NY), REST (Cusabio, American Research Products, Inc.), and LRP6 (USCN Life Science, Inc., American Research Products, Inc.). Neural exosomal levels of CD81 (mean ± SEM, n = 40) were 5.98 ± 0.76 ng/mL for AD patients and 5.44 ± 0.82 ng/mL for AC controls, indicating the same total amount of exosomes.
The mean value for all determinations of CD81 in each assay group was set at 1.00 and the relative values for each sample used to normalize their exosomal content. A neural origin and enrichment of neural exosomes by anti-L1CAM antibody absorption were supported by enhanced content of NCAM-1 and NS-enolase (Table S1).20
Statistical analyses
The statistical significance of differences between means for each patient group and their respective control group was determined with an unpaired t test including a Bonferroni correction (GraphPad Prism 6, La Jolla, CA). For longitudinal analyses, the significance of differences between AP and AD values was calculated with a paired t test (GraphPad). Discriminant classification modeling and receiver operating characteristic (ROC) analyses of proteins in the AD versus AC cross-sectional groups were conducted as described.10,11
Results
Transcription factor levels of plasma neural exosomes were significantly lower for AD patients than AC control subjects in the cross-sectional study (Fig.1). The mean ± SEM levels of LRP6, HSF1, and REST for AD patients (483 ± 49.9, 102 ± 3.96, and 47.4 ± 8.16 pg/mL, respectively) were significantly lower than those for AC controls (1028 ± 64.7, 319 ± 32.0, and 667 ± 140 pg/mL) (all P < 0.0001). In contrast, there were no significant differences in LRP6 or HSF1 between the FTD (857 ± 96.2 and 274 ± 51.0 pg/mL, respectively) and FTC (1104 ± 94 and 341 ± 51.4 pg/mL) groups (Fig.1). The REST level was significantly higher for FTD patients (2065 ± 162 pg/mL) than FTC controls (691 ± 123 pg/mL) (P < 0.0001), in contrast to earlier findings of lower values in brain tissues.1 There were no differences between levels of the transcription factors in AD patients with MCI and those with dementia (Table S2). ROC analyses of all analytes correctly classified 79% of AC subjects and 92% of AD patients (Fig. S1), as had primary pathogenic proteins.10
Figure 1.
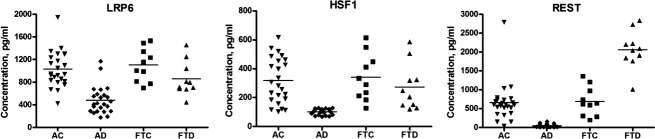
Levels of neural-derived plasma exosomal proteins in patients with Alzheimer’s disease (AD), frontotemporal dementia (FTD), and matched cognitively normal case controls (AC, FTC). The horizontal line in each cluster here and in Figure2 depicts the mean for that set.
The results of longitudinal studies were confirmatory, as each of the plasma neural-derived exosomal protein levels for AD patients 2–10 years before (AP group) and at the time of diagnosis (AD group) were significantly lower than for AC control subjects (Fig.2). The mean ± SEM levels of LRP6, HSF1, and REST for the AD group (568 ± 26.3, 140 ± 9.75, and 13.8 ± 1.87 pg/mL, respectively) and for the AP group (689 ± 23.6, 183 ± 9.95, and 30.7 ± 5.37 pg/mL) were significantly lower than those for AC controls (1028 ± 64.7, 319 ± 32.0, and 667 ± 140 pg/mL) (all P < 0.0001). The respective levels for the AD group all were significantly lower than those for the AP group (P values of 0.0019, 0.0034, and 0.0066). Thus, levels of these transcription factors were significantly low years before appearance of clinical signs of AD and there was continued declination with time. There were no differences between levels of any of the transcription factors in AP samples obtained 2–5 years before and 6–10 years before diagnosis.
Figure 2.
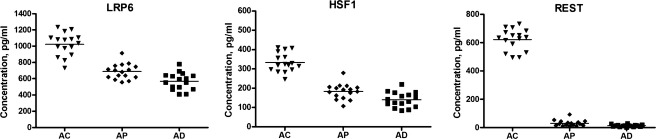
Sequential levels of neural-derived plasma exosomal proteins in patients with AD measured first at a time of normal cognition (preclinical, AP) and later at the time of development of MCI or dementia (AD), as contrasted with cognitively normal control subjects (AC) matched to AP individuals. AD, Alzheimer’s disease; MCI, mild cognitive impairment.
Discussion
It is difficult to assign distinct contributions to each of the pathogenic mechanisms and deficient neuronal defenses involved in AD. However, the low neural exosomal levels of critical survival factors in AD reported here (Figs.2) are of a degree similar to that of the increases in neural exosomal pathogenic proteins10,11 and suggest a loss of resistance to neurotoxic proteins that is likely to increase susceptibility to development of AD. It also is possible to conclude that the extent of deficiency of these survival factors detected in neural plasma exosomes is similar to those found in human brain tissues from patients with AD at autopsy and analogous to those in mouse models with targeted deletions that result in earlier and more severe AD-like disease.1,2
The Wnt signaling pathway regulates neurogenesis and diverse neurodevelopmental processes, as well as a variety of synaptic functions.4 Of the transcriptional factors here found to be deficient in AD, LRP6 is a mediator of Wnt signaling and REST is a Wnt signal target.1,2,5,6 Thus, a deficiency in LRP6 which diminishes Wnt signaling may contribute to reduced nuclear localization and activation of REST.
Major survival factor deficiencies 2–10 years before appearance of diagnostic clinical signs of AD (Fig.2) suggest a possible early pathogenic contribution of increased neuronal susceptibility to neurotoxic proteins in AD beyond higher levels of the pathogenic proteins.10,11 Validation of this platform will require larger studies analyzing profiles of these factors for individual patients and correlating results with those of cerebral bioimaging and pathology.
Acknowledgments
The authors are grateful to Lynn Kane (JHSF), Anna Karydas (UCSF MAC), Dana Swenson-Dravis and Matthew Miller (Mayo Clinic), Sonya Anderson (University of Kentucky), and Melissa Swaby (NIA) for organizing and distributing clinical materials and data. We thank Judith H. Goetzl for expert preparation of graphic illustrations.
Author Contributions
E. J. G. developed analytical methodology, performed laboratory benchwork, analyzed data, wrote, and edited manuscript. A. B. evaluated patients, analyzed data, edited manuscript. J. B. S. analyzed data, wrote, and edited manuscript. E. L. A. evaluated patients, analyzed data, edited manuscript. R. C. P. evaluated patients, analyzed data, edited manuscript. B. L. M. evaluated patients, analyzed data, edited manuscript. O. D. C. analyzed data, edited manuscript. M. M. performed laboratory benchwork, analyzed data, edited manuscript. D. K. evaluated patients, analyzed data, performed statistical analyses, edited manuscript.
Conflict of Interest
Three authors report possible conflicts of interest. Dr. Petersen is chair of the Data Monitoring Committee Pfizer, Inc. and Janssen Alzheimer Immunotherapy, and a consultant for Merck, Inc., Roche, Inc. and Genentech, Inc. Dr. Boxer declares that outside the submitted studies he has grants from NIH/NIA, grants from Tau Research Consortium, grants from Corticobasal Degeneration Solutions, grants, personal fees and nonfinancial support from Archer Biosciences, grants from Allon Therapeutics, personal fees from Acetylon, personal fees from Ipierian, grants from Genentech, grants from Bristol Myers Squibb, grants from TauRx, grants from Alzheimer’s Association, grants from Bluefield Project to Cure FTD, grants from Association for Frontotemporal Degeneration, grants from Alzheimer’s Drug Discovery Foundation, grants from EnVivo, grants from C2N Diagnostics, grants from Pfizer, and grants from Eli Lilly. Dr. Goetzl has filed a provisional application with the U.S. Patent Office for the platform and methodologies described in this report.
Supporting Information
Additional Supporting Information may be found in the online version of this article:
Figure S1. ROC plots depicting distinctions between AD and AC. Discriminant classifier analysis attained a Wilk’s Lambda of 0.395 and an exact F of 34.417 (P < 0.0001), and correctly classified 79% of AC subjects and 92% of AD patients. Of the proteins assessed, all had asymptotic significance <0.001 and achieved excellent classification in a rank order of REST (area under the curve [AUC] 0.944), HSF1 (AUC 0.944), and LRP6 (AUC 0.924).
Table S1. Immunochemical enrichment of neuronal markers in plasma exosomes. Each pg/mL value is the mean ± SEM of determinations for five plasma samples from AD patients or matched AC controls after normalization for CD81 content. NCAM-1, type 1 neural cell adhesion molecule; L1CAM, L1 cell adhesion molecule; NS-enolase, neuron-specific enolase. As a mean of ∼8% of total precipitated plasma exosomes are neurally derived10,20 this mean 10-fold enrichment suggests that up to 80% of the “neural set” studied are of neural origin.
Table S2. Levels of serum exosome proteins in relation to severity of dementia in AD. All values are mean ± SEM, pg/mL. None of the differences between values for the MCI and dementia groups was significant.
References
- Lu T, Aron L, Zullo J, et al. REST and stress resistance in ageing and Alzheimer’s disease. Nature. 2014;507:448–454. doi: 10.1038/nature13163. [DOI] [PMC free article] [PubMed] [Google Scholar]
- Liu CC, Tsai CW, Deak F, et al. Deficiency in LRP6-mediated Wnt signaling contributes to synaptic abnormalities and amyloid pathology in Alzheimer’s disease. Neuron. 2014;84:63–77. doi: 10.1016/j.neuron.2014.08.048. [DOI] [PMC free article] [PubMed] [Google Scholar]
- Schoenherr CJ, Anderson DJ. The neuron-restrictive silencer factor (NRSF): a coordinate repressor of multiple neuron-specific genes. Science. 1995;267:1360–1363. doi: 10.1126/science.7871435. [DOI] [PubMed] [Google Scholar]
- Niehrs C. The complex world of WNT receptor signalling. Nat Rev Mol Cell Biol. 2012;13:767–779. doi: 10.1038/nrm3470. [DOI] [PubMed] [Google Scholar]
- Liu CC, Kanekiyo T, Roth B, Bu G. Tyrosine-based signal mediates LRP6 receptor endocytosis and Desensitization of Wnt/beta-catenin pathway signaling. J Biol Chem. 2014;289:27562–27570. doi: 10.1074/jbc.M113.533927. [DOI] [PMC free article] [PubMed] [Google Scholar]
- Willert J, Epping M, Pollack JR, et al. A transcriptional response to Wnt protein in human embryonic carcinoma cells. BMC Dev Biol. 2002;2:8. doi: 10.1186/1471-213x-2-8. [DOI] [PMC free article] [PubMed] [Google Scholar]
- Hsu AL, Murphy CT, Kenyon C. Regulation of aging and age-related disease by DAF-16 and heat-shock factor. Science. 2003;300:1142–1145. doi: 10.1126/science.1083701. [DOI] [PubMed] [Google Scholar]
- Fujimoto M, Takaki E, Hayashi T, et al. Active HSF1 significantly suppresses polyglutamine aggregate formation in cellular and mouse models. J Biol Chem. 2005;280:34908–34916. doi: 10.1074/jbc.M506288200. [DOI] [PubMed] [Google Scholar]
- Baird NA, Douglas PM, Simic MS, et al. HSF-1-mediated cytoskeletal integrity determines thermotolerance and life span. Science. 2014;346:360–363. doi: 10.1126/science.1253168. [DOI] [PMC free article] [PubMed] [Google Scholar]
- Fiandaca MS, Kapogiannis D, Mapstone M, et al. Identification of preclinical Alzheimer’s disease by a profile of pathogenic proteins in neurally derived blood exosomes: a case-control study. Alzheimers Dement. 2015 doi: 10.1016/j.jalz.2014.06.008. in press; doi 10.1016/j.jalz.2014.06.008. [DOI] [PMC free article] [PubMed] [Google Scholar]
- Kapogiannis D, Boxer A, Schwartz JB, et al. Dysfunctionally phosphorylated type 1 insulin receptor substrate in neural-derived blood exosomes of preclinical Alzheimer’s disease. FASEB J. 2015;29:589–596. doi: 10.1096/fj.14-262048. [DOI] [PMC free article] [PubMed] [Google Scholar]
- Petersen RC. Mild cognitive impairment as a diagnostic entity. J Intern Med. 2004;256:183–194. doi: 10.1111/j.1365-2796.2004.01388.x. [DOI] [PubMed] [Google Scholar]
- Sperling RA, Aisen PS, Beckett LA, et al. Toward defining the preclinical stages of Alzheimer’s disease: recommendations from the National Institute on Aging-Alzheimer’s Association workgroups on diagnostic guidelines for Alzheimer’s disease. Alzheimers Dement. 2011;7:280–292. doi: 10.1016/j.jalz.2011.03.003. [DOI] [PMC free article] [PubMed] [Google Scholar]
- Dubois B, Feldman HH, Jacova C, et al. Research criteria for the diagnosis of Alzheimer’s disease: revising the NINCDS-ADRDA criteria. Lancet Neurol. 2007;6:734–746. doi: 10.1016/S1474-4422(07)70178-3. [DOI] [PubMed] [Google Scholar]
- McKhann G, Drachman D, Folstein M, et al. Clinical diagnosis of Alzheimer’s disease: report of the NINCDS-ADRDA Work Group under the auspices of Department of Health and Human Services Task Force on Alzheimer’s Disease. Neurology. 1984;34:939–944. doi: 10.1212/wnl.34.7.939. [DOI] [PubMed] [Google Scholar]
- Irizarry MC, Webb DJ, Bains C, et al. Predictors of placebo group decline in the Alzheimer’s disease Assessment Scale-cognitive subscale (ADAS-Cog) in 24 week clinical trials of Alzheimer’s disease. J Alzheimers Dis. 2008;14:301–311. doi: 10.3233/jad-2008-14304. [DOI] [PubMed] [Google Scholar]
- Cano SJ, Posner HB, Moline ML, et al. The ADAS-cog in Alzheimer’s disease clinical trials: psychometric evaluation of the sum and its parts. J Neurol Neurosurg Psychiatry. 2010;81:1363–1368. doi: 10.1136/jnnp.2009.204008. [DOI] [PubMed] [Google Scholar]
- Rascovsky K, Hodges JR, Knopman D, et al. Sensitivity of revised diagnostic criteria for the behavioural variant of frontotemporal dementia. Brain. 2011;134(Pt 9):2456–2477. doi: 10.1093/brain/awr179. [DOI] [PMC free article] [PubMed] [Google Scholar]
- Gorno-Tempini ML, Hillis AE, Weintraub S, et al. Classification of primary progressive aphasia and its variants. Neurology. 2011;76:1006–1014. doi: 10.1212/WNL.0b013e31821103e6. [DOI] [PMC free article] [PubMed] [Google Scholar]
- Goetzl EJ, Boxer A, Schwartz JB, et al. Altered lysosomal proteins in neural-derived plasma exosomes in preclinical Alzheimer’s disease. Neurology. 2015 doi: 10.1212/WNL.0000000000001702. In press. [DOI] [PMC free article] [PubMed] [Google Scholar]
Associated Data
This section collects any data citations, data availability statements, or supplementary materials included in this article.
Supplementary Materials
Figure S1. ROC plots depicting distinctions between AD and AC. Discriminant classifier analysis attained a Wilk’s Lambda of 0.395 and an exact F of 34.417 (P < 0.0001), and correctly classified 79% of AC subjects and 92% of AD patients. Of the proteins assessed, all had asymptotic significance <0.001 and achieved excellent classification in a rank order of REST (area under the curve [AUC] 0.944), HSF1 (AUC 0.944), and LRP6 (AUC 0.924).
Table S1. Immunochemical enrichment of neuronal markers in plasma exosomes. Each pg/mL value is the mean ± SEM of determinations for five plasma samples from AD patients or matched AC controls after normalization for CD81 content. NCAM-1, type 1 neural cell adhesion molecule; L1CAM, L1 cell adhesion molecule; NS-enolase, neuron-specific enolase. As a mean of ∼8% of total precipitated plasma exosomes are neurally derived10,20 this mean 10-fold enrichment suggests that up to 80% of the “neural set” studied are of neural origin.
Table S2. Levels of serum exosome proteins in relation to severity of dementia in AD. All values are mean ± SEM, pg/mL. None of the differences between values for the MCI and dementia groups was significant.