

Abstract
Background and Aims
HIV-infected adults have increased risk of several individual micronutrient deficiencies. However, the prevalence and risk factors of concurrent and multiple micronutrient deficiencies and whether micronutrient concentrations change after antiretroviral therapy (ART) initiation have not been well described. The objective of this study was to determine the prevalence and risk factors of individual, concurrent and multiple micronutrient deficiencies among ART-naïve HIV-infected adults from nine countries and assess change in micronutrient status 48 weeks post-ART initiation.
Methods
A random sub-cohort (n=270) stratified by country was selected from the multinational PEARLS clinical trial (n=1571 ART-naïve, HIV-infected adults). We measured serum concentrations of vitamins A, D (25-hydroxyvitamin), E, carotenoids and selenium pre-ART and 48 weeks post-ART initiation, and measured vitamins B6, B12, ferritin and soluble transferrin receptor at baseline only. Prevalence of single micronutrient deficiencies, concurrent (2 coexisting) or conditional (a deficiency in one micronutrient given a deficiency in another) and multiple (≥3) were determined using defined serum concentration cutoffs. We assessed mean changes in micronutrient concentrations from pre-ART to week 48 post-ART initiation using multivariable random effects models.
Results
Of 270 participants, 13.9%, 29.2%, 24.5% and 32.4% had 0, 1, 2 and multiple deficiencies, respectively. Pre-ART prevalence was the highest for single deficiencies of selenium (53.2%), vitamin D (42.4%), and B6 (37.3%) with 12.1% having concurrent deficiencies of all three micronutrients. Deficiency prevalence varied widely by country. 48 weeks post-ART initiation, mean vitamin A concentration increased (p<0.001) corresponding to a 9% decrease in deficiency. Mean concentrations also increased for other micronutrients assessed 48 weeks post-ART (p<0.001) but with minimal change in deficiency status.
Conclusions
Single and multiple micronutrient deficiencies are common among HIV-infected adults pre-ART initiation but vary between countries. Importantly, despite increases in micronutrient concentrations, prevalence of individual deficiencies remains largely unchanged after 48 weeks on ART. Our results suggest that ART alone is not sufficient to improve micronutrient deficiency.
Keywords: HIV, multiple micronutrients, micronutrient deficiency, antiretroviral therapy, cohort studies, vitamins
Introduction
Micronutrients, including vitamins A, B (B6, B12 and others), D, E, iron, and selenium, have important roles in immunity, oxidative stress and general health. Furthermore, deficiencies of these micronutrients can adversely affect the health status of individuals, thus contributing to global morbidity and mortality (1, 2). Individual deficiencies of many of these micronutrients are common in HIV-infected people (2), especially in low and middle income countries potentially due to inadequate diet and high inflammation (2, 3). Micronutrient deficiencies pose a special risk among immune suppressed HIV-infected adults resulting in an accelerated disease progression and greater treatment failure while on antiretroviral therapy (ART); some of these adverse outcomes have been reduced by multiple micronutrient supplementations (2).
Most prior studies among HIV-infected individuals have focused on single micronutrients (2) but a description of prevalence of concurrent and multiple micronutrients are lacking. Assessing concurrent deficiencies could be important as coexisting deficiencies of two micronutrients may result in worse outcomes than with a single micronutrient deficiency alone as observed with anemia (4). Deficiency prevalence of multiple (≥ 3 deficiencies) micronutrients and to what degree this varies by factors such as country, gender, CD4 count, body mass index (BMI) and viral load is not well studied. Lastly, how micronutrient status changes post-ART initiation has also not been well described. Few studies have reported micronutrient concentrations among adults already on ART but with either no comparison group or having only used a control group comprised of other adults not on ART (2); longitudinal analyses of micronutrient status among individuals pre and post-ART initiation is much needed.
To address these issues, we selected a geographically diverse sub-cohort comprised of ART-naïve adults with advanced HIV infection from the multinational AIDS Clinical Trials Group (ACTG) Prospective Evaluation of Antiretrovirals in Resource Limited Settings (PEARLS) trial (5). We describe the pre-ART prevalence of single, concurrent and multiple micronutrient deficiencies using a comprehensive panel of micronutrients and explore changes after ART initiation.
Materials and Methods
Study population and design
The sub-cohort used for this analysis was selected from ACTG PEARLS A5175 study (clinicaltrials.gov NCT00084136), a randomized clinical trial of ART among 1571 ART-naïve, HIV-infected adults (≥18 years old) with a CD4+ T-cell count less than 300 cells/mm3. The methods and procedures of the PEARLS trial have been described in detail elsewhere (5). In brief, the study was conducted from May 2005 to May 2010 and enrolled participants from nine countries: Brazil (n=231), Haiti (n=100), India (n=255), Malawi (n=221), Peru (n=134), South Africa (n=210), Thailand (n=100), United States (n=210) and Zimbabwe (n=110). Exclusion criteria included pregnancy, acute illness or other co-morbidities. One of three different ART regimens were randomly allocated with equal probability among the participants: 1) efavirenz plus twice-daily lamivudine-zidovudine; 2) once-daily atazanavir plus didanosine EC and emtricitabine; or 3) once-daily efarivenz plus emtricitabine-tenofovir-DF.
For this analysis, we selected a stratified random sample (N=270) of 30 participants from each of the nine countries. To evaluate pre-ART and post-ART micronutrient concentration and deficiency status, serum samples were obtained from the sub-cohort prior to ART initiation and at 48 weeks on ART. All available samples were stored at −80° C until the time of testing, and collection and storage of samples were standardized across different sites. Quantified micronutrients included retinol, α-carotene, β-carotene, β-cryptoxanthin, lutein, zeaxanthin, lycopene, vitamin B6, vitamin B12, vitamin D, α-tocopherol, transferrin receptor, ferritin, C-reactive protein (CRP), and selenium. From our random cohort of 270 ART-naïve HIV-infected adults, we were able to measure micronutrient concentrations in 252 individuals after accounting for missing samples due to low plasma volume or regulatory complications with exporting samples from India (unable to export approximately 40% of samples from India). Measured concentrations of these micronutrients were used to estimate prevalence of single and multiple micronutrient deficiencies among the sub-cohort prior to ART initiation and to assess changes in micronutrient status at 48 weeks on ART.
Ethics statement
We received approval from this study from the ethics committees and institutional review board from Johns Hopkins School of Medicine and each participating institution. We also obtained written informed consent from all participants and followed guidelines for human experimentation from the United States Department of Health and Human Services.
Laboratory analysis
Commercial enzyme-linked immunosorbent assay (ELISA) kits were used to measure concentrations of plasma C-reactive protein (CRP) (R & D Systems), serum soluble transferrin receptor (R & D Systems), and serum ferritin (ALPCO). Total (vitamin D2 and D3) serum 25-hydroxyvitamin was measured using a radioimmunoassay (DiaSorin, Stillwater, MN) as previously described (6). Serum vitamin B12 concentration was measured using Abbott AxSYM (Abbott Laboratories), an automated immunochemical analyzer. Serum vitamin B6 was measured using high-performance liquid chromatography (HPLC) with fluorescence detection (7). Serum retinol (vitamin A), α-carotene, β-carotene, β-cryptoxanthin, lutein, zeaxanthin, lycopene and α-tocopherol (vitamin E) were measured using HPLC as previously described (8). A Perkins-Elmer AAnalyst 600 graphite furnace atomic absorption spectrometer was used to measure serum selenium concentrations (9). Retinol, α-carotene, β-carotene, β-cryptoxanthin, lutein, zeaxanthin, lycopene, α-tocopherol, selenium and vitamin D concentrations were measured at baseline and at week 48 post-ART. Vitamin B12, vitamin B6, ferritin and soluble transferrin receptor concentrations were measured only at baseline.
Micronutrient deficiency definitions
Individual micronutrient deficiencies were defined based on cutoff values of serum concentrations used in previous studies as follows: vitamin A deficiency (retinol < 1.05 μmol/L); vitamin B6 deficiency (vitamin B6 < 19 nmol/L); vitamin B12 deficiency (vitamin B12 < 148 pmol/L); vitamin D deficiency (vitamin D <30 ng/mL); vitamin E (α-tocopherol <9.3 μmol/L); and selenium deficiency (selenium <85 μg/L) (10–15). Iron deficiency (ID) was defined by either transferrin receptor concentration (> 8.3 mg/L) (16) or ferritin concentration (ferritin < 12 μg/L if CRP ≤5 mg/L or ferritin < 30 μg/L if CRP >5 mg/L) (17). Concentrations of α-carotene, β-carotene, β-cryptoxanthin, lutein, zeaxanthin and lycopene were added per individual to calculate total carotenoids. In the absence of a generally accepted cutoff value, low total carotenoids was defined as the lowest quartile measured pre-ART (<0.81 μmol/L). Concurrent deficiencies were defined as coexisting deficiencies is any two micronutrients. Conditional deficiency was defined as among people with a given deficiency of one micronutrient, the percent of people with a second micronutrient deficiency. Multiple micronutrient deficiencies were defined as 3 or more deficiencies when considering deficiencies of vitamin A, B6, B12, D, E, selenium, iron and low total carotenoids. High inflammation is defined as elevated CRP with concentrations ≥ 5 mg/L.
Statistical analyses
Median concentration (interquartile range) and prevalence (95% confidence intervals (CI)) of deficiency were estimated for each micronutrient. Multivariable logistic regression was used to determine the risk factors for individual and multiple micronutrient deficiencies. Multivariable random effects generalized models were used to estimate the mean change in micronutrient status from week 0 to 48 weeks. Baseline micronutrient concentrations, gender, age, country, BMI, treatment regimen, CD4 count, and viral load were adjusted for in the models. Prevalence, risk factors and change post-ART in vitamin D status has already been described elsewhere (18, 19), so we will limit vitamin D analysis for concurrent, conditional and multiple micronutrient deficiency analysis. STATA version 13.0 (StataCorp) was used for all statistical analyses.
Results
Study population
The median age of our study population was 35.0 years and 50.0% of the cohort were female. 12.4% of the population had a low BMI (<18.5 kg/m2) and 20.6% had high BMI (>25 kg/m2). Baseline median CD4 count was 178.5 cells/mm3 and median log viral load was 5.1 copies/mL. Only 13.9% of cohort had no micronutrient deficiency. The prevalence of having only one micronutrient deficiency was 29.2%, and the prevalence of any two, three, four, or five or more deficiencies was 24.5%, 17.6%, 10.2% and 4.6%, respectively (data not shown).
Pre-ART prevalence and risk factors of micronutrient deficiencies
Individual micronutrient deficiency prevalence and risk factors
Using our defined cutoffs, single micronutrient deficiency prevalence was as follows: vitamin A was 17.1%, vitamin B12 was 9.0%, vitamin B6 was 37.3%, ID was 11.6% and vitamin E was 0 % (Figure 1). And as previously described by our group, deficiency of selenium was 53.2% (20). Risk factors associated with individual micronutrient deficiencies were assessed in multivariable models including covariates of gender, country, BMI, CD4 count and viral load. Country was the most common risk factor associated with most micronutrient deficiencies. Risk factors for vitamin A deficiency was female gender (aOR: 11.73, 95% CI: 3.65–37.74), low BMI (aOR: 6.79, CI: 1.31–35.18) (relative to normal BMI), high inflammation (reference: CRP < 5 mg/L) (aOR: 9.21, CI: 3.29–25.80) and being from Malawi (aOR: 22.19, CI: 2.24–219.71), the USA (aOR: 18.34, CI: 1.49–226.55) or Zimbabwe (aOR:21.34, CI: 2.07–220.08) (relative to Thailand) (Figure 2A). Independent risk factors for vitamin B6 were high inflammation (aOR: 3.41, CI: 1.80–6.48) and being from Brazil (aOR: 4.80, CI: 1.18–19.54) or Zimbabwe (aOR: 7.20, CI: 1.86–27.86) (relative to South Africa) (Figure 2B).
Figure 1. Pre-ART initiation micronutrient concentrations and prevalence of individual deficiencies in HIV-infected adults.
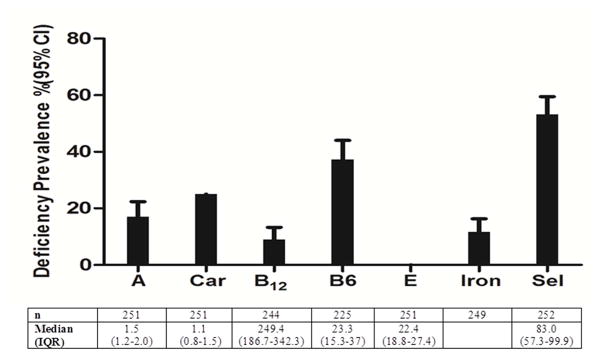
Number (n), median and the interquartile range (IQR), and the prevalence of deficiency (%) and 95% confidence interval (CI) is presented for vitamin A (A), total carotenoids (Car), vitamin B12 (B12), vitamin B6 (B6), vitamin E (E), iron and slenium (Sel) measured pre-ART initiation. The total sample size (n) varies due to insufficient serum for analysis or missing data. Cutoff values for deficiency include: <1.05 μmol/L for retinol (vitamin A), <19 nmol/L for vitamin B6, <148 pmol/L for vitamin B12, <9.3 μmol/L for α-tocopherol (vitamin E) and <85 μg/L for selenium. Iron deficiency (ID) was defined by either transferrin receptor concentration (> 8.3 mg/L) or ferritin concentration (ferritin < 12 μg/L if CRP ≤5 mg/L or ferritin < 30 μg/L if CRP >5 mg/L).
Figure 2. Risk factors for individual and multiple micronutrient deficiencies pre-ART initiation.
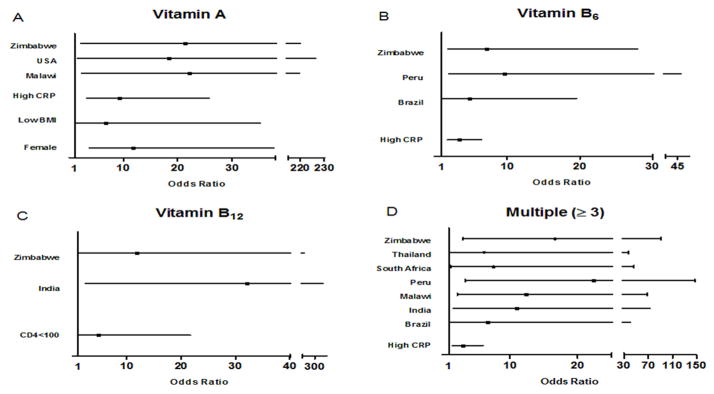
Independent risk factors for vitamin A, B6, B12 and multiple (≥3 concurrent deficiencies) micronutrient deficiencies. Odds ratio (■) with 95% confidence intervals (CI) are shown only for variables with significant (based on CI) odds of deficiency in multivariable logistic regression models adjusting for gender, country, BMI, CD4 count, log viral load and CRP. Multiple micronutrient deficiencies were defined as deficiency in three or more micronutrients when considering vitamins A, B6, B12, D, E, selenium, iron and low total carotenoids. High CRP is defined as CRP levels ≥5 mg/L with low CRP as the reference group. Low body mass index (BMI) is defined as BMI <18.5 kg/m2 with normal BMI (18.5–25 kg/m2) as the reference group. CD4 categories with counts of 200–300 cells/mm3 were the reference group for CD4 count and viral load categories with log viral load less than 4 copies/mL were the reference group for viral load. For vitamin A, B6, B12 and multiple deficiencies, the reference countries were Thailand, South Africa, Peru and Haiti, respectively. The country with the lowest non-zero prevalence of deficiency was chosen as the reference country for each micronutrient. Deficiencies are based on cutoffs used in Table 1.
Risk factors for vitamin B12 deficiency was CD4 count less than 100 cells/mm3 (aOR: 4.82, CI: 1.07–21.70) (relative to CD4 count 200–300) and being from India (aOR: 32.14, CI: 2.34–440.72) and Zimbabwe (aOR: 11.78, CI: 1.09–126.96) (relative to Peru) (Figure 2C). Independent risk factors for ID was female gender (aOR: 27.48, CI: 4.79–157.63) (data not shown). Risk factors for selenium deficiency were previously described (20) and were female gender, high inflammation, CD4 count less than 100 cells/mm3 and being from Brazil, India, Malawi, Peru, South Africa and Thailand (relative to Haiti).
Concurrent, conditional and multiple micronutrient deficiencies
Concurrent, conditional and multiple micronutrient deficiencies were common, especially involving micronutrients with high prevalence of individual deficiency such as vitamin B6, vitamin D and selenium. Among all possible combinations of two concurrent micronutrient deficiencies, vitamin D-selenium (21.2%), vitamin B6-selenium (25.3%), and vitamin D-vitamin B6 (17.4%) had the highest prevalence (Table 1).
Table 1.
Prevalence of 2 concurrent micronutrient deficiencies at pre-ART initiation
| Carotenoids | Vitamin B12 | Vitamin B6 | Vitamin D | Iron | Selenium | |
|---|---|---|---|---|---|---|
| Vitamin A | 5.6 | 1.2 | 9.3 | 8.4 | 4.0 | 14.3 |
| Carotenoids | 4.1 | 12.5 | 11.7 | 1.2 | 14.8 | |
| Vitamin B12 | 5.5 | 4.1 | 0.4 | 4.9 | ||
| Vitamin B6 | 17.4 | 5.8 | 25.3 | |||
| Vitamin D | 6.5 | 21.2 | ||||
| Iron | 6.8 |
The percent of people (prevalence) with 2 concurrent micronutrient deficiencies. Prevalence is shown for all possible combinations of micronutrients with an established cutoff. Cutoffs values for deficiency are defined in Table 1.
Among participants with at least one micronutrient deficiency, conditional deficiency of vitamin B6, vitamin D and selenium was also common (Table 2). The prevalence of concurrent selenium-vitamin D-vitamin B6 deficiency was 12.1% (data not shown).
Table 2.
Prevalence of conditional deficiencies pre-ART initiation
| Conditional Deficiency (%)
|
|||||||||
|---|---|---|---|---|---|---|---|---|---|
| N | Deficiency n (%) | Vitamin A | Carotenoids | Vitamin B12 | Vitamin B6 | Vitamin D | Iron | Selenium | |
| Vitamin A | 251 | 43 (17.1) | - | 32.6 | 7.1 | 53.9 | 50.0 | 23.8 | 83.7 |
| Carotenoids | 250 | 63 (25.2) | 22.2 | - | 16.7 | 56.0 | 46.0 | 4.8 | 58.7 |
| Vitamin B12 | 244 | 22 (9.0) | 13.6 | 45.5 | - | 57.1 | 45.5 | 4.6 | 54.6 |
| Vitamin B6 | 225 | 84 (37.3) | 25.0 | 33.3 | 14.6 | - | 46.4 | 15.7 | 67.9 |
| Vitamin D | 250 | 106 (42.4) | 20.0 | 27.9 | 10.0 | 40.2 | - | 15.1 | 50.0 |
| Iron | 252 | 29 (11.7) | 34.5 | 10.3 | 3.7 | 46.4 | 55.2 | - | 58.6 |
| Selenium | 252 | 134 (53.2) | 27.1 | 28.0 | 9.3 | 46.3 | 40.1 | 13.0 | - |
The number (n) of people with an individual micronutrient deficiency, the prevalence (%) of individual micronutrient deficiency and the conditional deficiencies are presented for each micronutrient. Conditional deficiency is defined as: given a deficiency in one micronutrient, the percent of people (prevalence) with another micronutrient deficiency. Cutoffs values for deficiency are defined in Table 1.
Multiple micronutrient deficiencies of any three or more micronutrients were common in India (prevalence of 40%), Malawi (50%), Peru (53%), South Africa (35%) and Zimbabwe (50%) but less common in Brazil (24%), Haiti (7%), Thailand (27%) and USA (21%). Independent risk factors for multiple micronutrient deficiencies were having high inflammation (aOR: 3.04, 95% CI: 1.53–6.02) and being from Brazil (aOR: 6.70, 95% CI: 1.11–40.39), India (aOR: 10.93, 95% CI: 1.65–72.61), Malawi (aOR: 12.36, 95% CI: 2.23–68.39), Peru (aOR: 22.37, 95% CI: 3.40–147.05), South Africa (aOR: 7.58, 95% CI: 1.25–46.09), Thailand (aOR: 6.22, 95% CI: 1.04–37.27) and Zimbabwe (aOR: 16.68, 95% CI: 3.05–91.17) (relative to being from Haiti) (Figure 2D).
Change in micronutrient status post ART initiation
Compared to pre-ART measurements, mean micronutrient concentrations (except for vitamin E) changed significantly by 48 weeks on ART. Table 3 shows the median concentration and prevalence of deficiency for the micronutrients at week 48 on ART. In addition, the mean change adjusted for covariates at week 48 compared to baseline is also shown. By 48 weeks on ART, mean concentrations increased for: vitamin A (mean change: 0.21 μmol/L, 95% CI: 0.14–0.28), total carotenoid (mean change: 0.18 μmol/L, CI: 0.09–0.27), vitamin E (mean change: 0.75 μmol/L, CI: −0.04–1.53) and selenium (mean change: 3.97 μg/L, CI: 2.15–5.79) (Table 3). However, corresponding changes in the prevalence of individual micronutrient deficiencies were minimal, including the prevalence of vitamin E deficiency (0% at both time points), selenium deficiency (53.2% to 50.0%) and low total carotenoids (25.0% to 20.4%) (Table 3). More substantial change was observed vitamin A deficiency prevalence, which decreased from 17.1% to 8.1%.
Table 3.
Micronutrient status at 48 weeks post-ART initiation
| Week 48
|
Mean change from baseline β(95% CI) | |||
|---|---|---|---|---|
| n | Median(IQR) | Deficiency %(95%CI) | ||
| Vitamin A (μmol/L) | 222 | 1.72(1.43–2.19) | 8.1(4.9–12.5) | 0.21(0.14–0.28) |
| Total Carotenoids (μmol/L) | 221 | 1.30(0.85–1.77) | 20.4(15.3–26.3) | 0.18(0.09–0.27) |
| Vitamin E (μmol/L) | 221 | 23.39(19.41–26.6) | 0.0 | 0.75(−0.04–1.53) |
| Selenium (μg/L) | 222 | 85.11(61.05–105.12) | 50.0(43.2–56.8) | 3.97(2.15–5.79) |
Table showing number (n), median and interquartile range (IQR) and prevalence of deficiency (and 95% CI) of micronutrients at 48 weeks post-ART. In addition, mean change (95% CI) in micronutrient concentrations at week 48 compared to week 0 were obtained from multivariable random effects models adjusting for baseline micronutrient concentrations, gender, age, country, treatment, BMI, CD4 count and log viral load. Data are shown for vitamin A, total carotenoids, vitamin E and selenium but not for vitamin B6, vitamin B12 and iron as there were not measured at 48 weeks.
Discussion
This study is among the first to comprehensively assess the pre-ART prevalence and risk factors of multiple micronutrient deficiencies among adults with advanced HIV disease from diverse geographical settings while exploring longitudinal changes in micronutrient concentrations on ART among the same cohort. Overall, our analysis indicates that individual and multiple micronutrient deficiencies are common among ART-naïve HIV-infected adults, particularly involving vitamin B6, vitamin D and selenium, but range widely between countries. After ART initiation, our analysis identified significant changes in mean concentration among all micronutrients assessed at 48 weeks on ART. However, corresponding changes in deficiency prevalence were minimal, except for decreased vitamin A deficiency, which suggests ART alone is not enough to improve micronutrient deficiency states.
Previous studies have assessed individual micronutrient deficiencies among ART-naïve, HIV-infected populations. Based on historical data from HIV-uninfected people, our results are consistent with several studies and suggest that concentrations of vitamin A, vitamin B12, vitamin E, and selenium are lower in ART-naïve, HIV-infected people than HIV-uninfected people (21–23), whereas concentrations of the carotenoids, vitamin B6 and iron are similar among HIV-infected and uninfected people (21–26). Higher prevalence of some micronutrient deficiencies among HIV-infected adults could be due to reduced intake, increased micronutrient losses through altered mucosal immunity and gut permeability, increased inflammation and interference of metabolic pathways that could potentially result from the infection (2, 3).
While our study had similar concentrations of vitamin A compared to studies of ART-naïve HIV-infected adults in Thailand and USA (21, 22, 26), two other studies conducted in Tanzania and France had higher concentrations but were conducted among children and pregnant women (23, 27). Carotenoids, vitamin B6, vitamin B12 and vitamin E levels were similar between our study and other studies (21–26). Range of concentrations of selenium and ferritin varied greatly between studies and are to be expected given the well-known differences by country and race (21–26).
The wide variation in micronutrient deficiencies by country is expected given country-based differences in diet, income and other factors. Notably, income status (high versus low income status) of the country does not reliably predict deficiency patterns. For example, USA has a relatively high prevalence of vitamin B6 deficiency (30%) while there is a lack of vitamin B12 deficiency in Malawi. Thus, when considering worldwide supplementation such as for PEPFAR programs, it is essential to determine the deficiency status for each country and likely for specific populations (e.g. children, non-pregnant women, pregnant women, adult males). Given the risk of negative effects of overconsumption of micronutrients in an already sufficient population (2), different plans might be needed for different countries and populations.
There is often clustering of micronutrient deficiencies, especially in resource-limited settings where food sources are lacking in more than one micronutrient. We are not aware of any other study that has estimated the prevalence of concurrent, conditional and multiple micronutrient deficiencies in ART-naïve HIV infected people. We observed high prevalence of concurrent and multiple micronutrient deficiencies with high deficiencies of vitamin B6, vitamin D and selenium. Diets poor in common sources of vitamin B6, vitamin D and selenium, such as meat (vitamin B6 and selenium) or nuts (selenium and vitamin B6), could contribute to clustering of these deficiencies. Although comparisons with healthy populations remain scarce, a study of pregnant women in Nepal (14) reported lower prevalence of concurrent vitamin D and vitamin B6 (7.1%) deficiencies compared to our study (19.6%). Among people with any micronutrient deficiency, conditional vitamin B6 deficiency was likely, which is consistent with our results, but conditional vitamin D deficiency was lower (<20%) than in our study (40–55%). Our population from diverse races and countries as well as changes occurring during HIV infection or pregnancy might contribute to the different vitamin D findings between the studies. Persons with high inflammation and persons from certain countries were more likely to have multiple concurrent deficiencies and might benefit from multiple micronutrient supplementations, but this remains to be proven.
We observed increases in most micronutrients by 48 weeks on ART compared to pre-ART values. However, most of these increases were relatively small. Importantly, only vitamin A change resulted in a substantial reduction in proportion with deficiency. Thus it appears that despite effective ART, most with baseline deficiencies remain deficient after 1 year on ART. The increases (albeit small) in micronutrient concentrations could be explained by increased appetite after ART initiation resulting in greater food intake and increased weight (28). In addition, with control of viral replication, the direct effects of the virus on micronutrient status could also be altered, including reduced inflammation, improved gut permeability and reduced interference with metabolic pathways. Vitamin A deficiency might have decreased from baseline due to better absorption of fat-soluble vitamins after viral control during treatment (29). Another reason might be that retinol is as an acute phase reactant and controlling for HIV infection might have reduced the acute phase response (15).
There is a lack of studies that have prospectively followed ART-naïve individuals to assess the change in micronutrient status post-ART. Cross-sectional studies assessing micronutrient concentrations in people already on ART show similar vitamin A deficiency and concentrations of carotenoids compared to post-ART individuals in our study (15, 29). Concentrations and prevalence of vitamin E deficiency post-ART were also similar between our study and others studies (29, 30). As described with pre-ART levels, selenium concentrations varied widely between countries as is expected due to variations between soil selenium content and food sources by country(20).
Strengths of this study include the estimates of multiple micronutrient deficiencies, as well as the longitudinal follow-up of the same cohort of individuals pre- and post-ART. One weakness of our study is the use of serum concentrations to define micronutrient deficiency although serum concentrations might not always represent true deficiency. However, serum-based cutoffs are commonly used and here we report a summary of serum-based cutoffs of deficiency with adjustment for confounders such as inflammation in risk factor analysis. The lack of HIV-uninfected control group due to its nesting within a randomized controlled trial of HIV-infected people is also a limitation. However historical data from other studies were available for comparison purposes. Another limitation was that data on nutrient supplementation was missing in the parent trial. Although supplementation use was likely low in most sites, this information would have been useful. Finally, our sample size for each country though low was based on a random stratified sample so prevalence estimation could be performed.
In summary, multiple micronutrient deficiencies were common prior to ART initiation and after ART initiation. This suggests that ART alone may not correct many micronutrient deficiencies. For deficiencies associated with adverse treatment outcomes, supplementation should be considered but only in settings with deficiencies.
Acknowledgments
The authors thank the PEARLS study participants for volunteering their time and efforts.
Funding Sources
Thomas B Campbell is an advisory board member for Gilead Sciences. Amita Gupta has received grant funding from Gilead Foundation. This work was supported by the AIDS Clinical Trials Group and the US National Institute of Allergy and Infectious Diseases [AI68636, AI069450]; and the US National Institutes of Health [R01 AI45462 to AG]. The parent trial A5175 was also supported in part by Boehringer-Ingelheim, Bristol-Myers Squibb, Gilead Sciences, and GlaxoSmithKline. The funders had no role in study design, data collection and analysis, decision to publish, or manuscript preparation.
List of abbreviations
- ART
Antiretroviral therapy
- HIV
Human immunodeficiency virus
- CRP
C-reactive protein
- ID
Iron deficiency
- vitamin D
25-hydroxyvitamin D
Footnotes
Conflict of Interest
All authors declare no conflicts of interest.
Author’s contributions and statement of authorship
RS conducted the data analysis and wrote the primary version of the manuscript. PC contributed to study design, data interpretation and manuscript review. WY and NG contributed to data interpretation and manuscript review. NW, CK, SP, WS, BS, SP, ST, CR, SB, JRL, SWC and PS contributed to data collection and manuscript review. AT contributed to data interpretation and manuscript review. RDS contributed to study design, laboratory testing and review of manuscript. TBC contributed to study design, data collection, oversight of study implementation and manuscript review. AG obtained funding and contributed to study design, manuscript writing and review. Criteria for authorship are met by all authors as recommended by the International Committee of Medical Journal Editors (ICMJE). They were fully responsible for all aspects of manuscript development.
Publisher's Disclaimer: This is a PDF file of an unedited manuscript that has been accepted for publication. As a service to our customers we are providing this early version of the manuscript. The manuscript will undergo copyediting, typesetting, and review of the resulting proof before it is published in its final citable form. Please note that during the production process errors may be discovered which could affect the content, and all legal disclaimers that apply to the journal pertain.
Contributor Information
Rupak Shivakoti, Email: rshivak1@jhmi.edu.
Parul Christian, Email: pchrist1@jhu.edu.
Wei-Teng Yang, Email: weiteng.yang@gmail.com.
Nikhil Gupte, Email: nikhil_jhumit@yahoo.com.
Noluthando Mwelase, Email: tmwelase@witshealth.co.za.
Cecilia Kanyama, Email: ckanyama@unclilongwe.org.
Sandy Pillay, Email: Pillay@ukzn.ac.za.
Wadzanai Samaneka, Email: wsamaneka@uzcrc.co.zw.
Breno Santos, Email: breno@ghc.com.br.
Selvamuthu Poongulali, Email: poongulali@yrgcare.org.
Srikanth Tripathy, Email: directorjalma@gmail.com.
Cynthia Riviere, Email: criviere@gheskio.org.
Sima Berendes, Email: sima.berendes@googlemail.com.
Javier R. Lama, Email: jrlama@impactaperu.org.
Sandra W. Cardoso, Email: sandra.wagner@ipec.fiocruz.br.
Patcharaphan Sugandhavesa, Email: patcharaphan@rihes-cmu.org.
Alice M. Tang, Email: Alice.Tang@tufts.edu.
Richard D. Semba, Email: rdsemba@jhmi.edu.
Thomas B. Campbell, Email: Thomas.Campbell@ucdenver.edu.
Amita Gupta, Email: agupta25@jhmi.edu.
References
- 1.Mamede AC, Tavares SD, Abrantes AM, Trindade J, Maia JM, Botelho MF. The role of vitamins in cancer: a review. Nutrition and cancer. 2011;63(4):479–94. doi: 10.1080/01635581.2011.539315. Epub 2011/05/05. [DOI] [PubMed] [Google Scholar]
- 2.Drain PK, Kupka R, Mugusi F, Fawzi WW. Micronutrients in HIV-positive persons receiving highly active antiretroviral therapy. The American journal of clinical nutrition. 2007;85(2):333–45. doi: 10.1093/ajcn/85.2.333. Epub 2007/02/08. [DOI] [PubMed] [Google Scholar]
- 3.Brenchley JM, Price DA, Schacker TW, Asher TE, Silvestri G, Rao S, et al. Microbial translocation is a cause of systemic immune activation in chronic HIV infection. Nature medicine. 2006;12(12):1365–71. doi: 10.1038/nm1511. Epub 2006/11/23. [DOI] [PubMed] [Google Scholar]
- 4.Suharno D, West CE, Muhilal, Karyadi D, Hautvast JG. Supplementation with vitamin A and iron for nutritional anaemia in pregnant women in West Java, Indonesia. Lancet. 1993;342(8883):1325–8. doi: 10.1016/0140-6736(93)92246-p. Epub 1993/11/27. [DOI] [PubMed] [Google Scholar]
- 5.Campbell TB, Smeaton LM, Kumarasamy N, Flanigan T, Klingman KL, Firnhaber C, et al. Efficacy and safety of three antiretroviral regimens for initial treatment of HIV-1: a randomized clinical trial in diverse multinational settings. PLoS medicine. 2012;9(8):e1001290. doi: 10.1371/journal.pmed.1001290. Epub 2012/09/01. [DOI] [PMC free article] [PubMed] [Google Scholar]
- 6.Lai H, Detrick B, Fishman EK, Gerstenblith G, Brinker JA, Hollis BW, et al. Vitamin D deficiency is associated with the development of subclinical coronary artery disease in African Americans with HIV infection: a preliminary study. Journal of investigative medicine: the official publication of the American Federation for Clinical Research. 2012;60(5):801–7. doi: 10.231/JIM.0b013e318250bf99. Epub 2012/04/07. [DOI] [PMC free article] [PubMed] [Google Scholar]
- 7.Kimura M, Kanehira K, Yokoi K. Highly sensitive and simple liquid chromatographic determination in plasma of B6 vitamers, especially pyridoxal 5′-phosphate. Journal of chromatography A. 1996;722(1–2):295–301. doi: 10.1016/0021-9673(95)00354-1. Epub 1996/01/26. [DOI] [PubMed] [Google Scholar]
- 8.Sowell AL, Huff DL, Yeager PR, Caudill SP, Gunter EW. Retinol, alpha-tocopherol, lutein/zeaxanthin, beta-cryptoxanthin, lycopene, alpha-carotene, trans-beta-carotene, and four retinyl esters in serum determined simultaneously by reversed-phase HPLC with multiwavelength detection. Clinical chemistry. 1994;40(3):411–6. Epub 1994/03/01. [PubMed] [Google Scholar]
- 9.Semba RD, Ricks MO, Ferrucci L, Xue QL, Guralnik JM, Fried LP. Low serum selenium is associated with anemia among older adults in the United States. European journal of clinical nutrition. 2009;63(1):93–9. doi: 10.1038/sj.ejcn.1602889. Epub 2007/09/07. [DOI] [PMC free article] [PubMed] [Google Scholar]
- 10.Holick MF, Binkley NC, Bischoff-Ferrari HA, Gordon CM, Hanley DA, Heaney RP, et al. Evaluation, treatment, and prevention of vitamin D deficiency: an Endocrine Society clinical practice guideline. The Journal of clinical endocrinology and metabolism. 2011;96(7):1911–30. doi: 10.1210/jc.2011-0385. Epub 2011/06/08. [DOI] [PubMed] [Google Scholar]
- 11.Baeten JM, Mostad SB, Hughes MP, Overbaugh J, Bankson DD, Mandaliya K, et al. Selenium deficiency is associated with shedding of HIV-1--infected cells in the female genital tract. J Acquir Immune Defic Syndr. 2001;26(4):360–4. doi: 10.1097/00126334-200104010-00013. Epub 2001/04/24. [DOI] [PubMed] [Google Scholar]
- 12.Baum MK, Shor-Posner G, Lai S, Zhang G, Lai H, Fletcher MA, et al. High risk of HIV-related mortality is associated with selenium deficiency. Journal of acquired immune deficiency syndromes and human retrovirology: official publication of the International Retrovirology Association. 1997;15(5):370–4. doi: 10.1097/00042560-199708150-00007. Epub 1997/08/15. [DOI] [PubMed] [Google Scholar]
- 13.Campa A, Shor-Posner G, Indacochea F, Zhang G, Lai H, Asthana D, et al. Mortality risk in selenium-deficient HIV-positive children. Journal of acquired immune deficiency syndromes and human retrovirology: official publication of the International Retrovirology Association. 1999;20(5):508–13. doi: 10.1097/00042560-199904150-00015. Epub 1999/05/04. [DOI] [PubMed] [Google Scholar]
- 14.Jiang T, Christian P, Khatry SK, Wu L, West KP., Jr Micronutrient deficiencies in early pregnancy are common, concurrent, and vary by season among rural Nepali pregnant women. The Journal of nutrition. 2005;135(5):1106–12. doi: 10.1093/jn/135.5.1106. Epub 2005/05/04. [DOI] [PubMed] [Google Scholar]
- 15.Semba RD, Graham NM, Caiaffa WT, Margolick JB, Clement L, Vlahov D. Increased mortality associated with vitamin A deficiency during human immunodeficiency virus type 1 infection. Archives of internal medicine. 1993;153(18):2149–54. Epub 1993/09/27. [PubMed] [Google Scholar]
- 16.Grant FK, Martorell R, Flores-Ayala R, Cole CR, Ruth LJ, Ramakrishnan U, et al. Comparison of indicators of iron deficiency in Kenyan children. The American journal of clinical nutrition. 2012;95(5):1231–7. doi: 10.3945/ajcn.111.029900. Epub 2012/03/30. [DOI] [PMC free article] [PubMed] [Google Scholar]
- 17.Kupka R, Msamanga GI, Mugusi F, Petraro P, Hunter DJ, Fawzi WW. Iron status is an important cause of anemia in HIV-infected Tanzanian women but is not related to accelerated HIV disease progression. The Journal of nutrition. 2007;137(10):2317–23. doi: 10.1093/jn/137.10.2317. Epub 2007/09/22. [DOI] [PubMed] [Google Scholar]
- 18.Havers F, Smeaton L, Gupte N, Detrick B, Bollinger R, Hakim J, et al. 25-Hydroxyvitamin D Insufficiency and Deficiency is Associated with HIV Disease Progression and Virological Failure Post-Antiretroviral Therapy Initiation in Diverse Multinational Settings. The Journal of infectious diseases. 2014 doi: 10.1093/infdis/jiu259. Epub 2014/05/07. [DOI] [PMC free article] [PubMed] [Google Scholar]
- 19.Havers FP, Detrick B, Cardoso SW, Berendes S, Lama JR, Sugandhavesa P, et al. Change in vitamin d levels occurs early after antiretroviral therapy initiation and depends on treatment regimen in resource-limited settings. PloS one. 2014;9(4):e95164. doi: 10.1371/journal.pone.0095164. Epub 2014/04/23. [DOI] [PMC free article] [PubMed] [Google Scholar]
- 20.Shivakoti R, Gupte N, Yang WT, Mwelase N, Kanyama C, Tang AM, et al. Pre-Antiretroviral Therapy Serum Selenium Concentrations Predict WHO Stages 3, 4 or Death but not Virologic Failure Post-Antiretroviral Therapy. Nutrients. 2014;6(11):5061–78. doi: 10.3390/nu6115061. Epub 2014/11/18. [DOI] [PMC free article] [PubMed] [Google Scholar]
- 21.Baum MK, Shor-Posner G, Lu Y, Rosner B, Sauberlich HE, Fletcher MA, et al. Micronutrients and HIV-1 disease progression. AIDS. 1995;9(9):1051–6. doi: 10.1097/00002030-199509000-00010. Epub 1995/09/01. [DOI] [PubMed] [Google Scholar]
- 22.Beach RS, Mantero-Atienza E, Shor-Posner G, Javier JJ, Szapocznik J, Morgan R, et al. Specific nutrient abnormalities in asymptomatic HIV-1 infection. AIDS. 1992;6(7):701–8. doi: 10.1097/00002030-199207000-00013. Epub 1992/07/01. [DOI] [PubMed] [Google Scholar]
- 23.Periquet BA, Jammes NM, Lambert WE, Tricoire J, Moussa MM, Garcia J, et al. Micronutrient levels in HIV-1-infected children. AIDS. 1995;9(8):887–93. doi: 10.1097/00002030-199508000-00009. Epub 1995/08/01. [DOI] [PubMed] [Google Scholar]
- 24.Hamill MM, Ward KA, Pettifor JM, Norris SA, Prentice A. Bone mass, body composition and vitamin D status of ARV-naive, urban, black South African women with HIV infection, stratified by CD(4) count. Osteoporosis international: a journal established as result of cooperation between the European Foundation for Osteoporosis and the National Osteoporosis Foundation of the USA. 2013;24(11):2855–61. doi: 10.1007/s00198-013-2373-y. Epub 2013/05/31. [DOI] [PMC free article] [PubMed] [Google Scholar]
- 25.Lan Y, Kumwenda N, Taha TE, Chiphangwi JD, Miotti PG, Mtimavalye L, et al. Carotenoid status of pregnant women with and without HIV infection in Malawi. East African medical journal. 1999;76(3):133–7. Epub 1999/08/12. [PubMed] [Google Scholar]
- 26.Phuapradit W, Chaturachinda K, Taneepanichskul S, Sirivarasry J, Khupulsup K, Lerdvuthisopon N. Serum vitamin A and beta-carotene levels in pregnant women infected with human immunodeficiency virus-1. Obstetrics and gynecology. 1996;87(4):564–7. doi: 10.1016/0029-7844(95)00459-9. Epub 1996/04/01. [DOI] [PubMed] [Google Scholar]
- 27.Mehta S, Spiegelman D, Aboud S, Giovannucci EL, Msamanga GI, Hertzmark E, et al. Lipid-soluble vitamins A, D, and E in HIV-infected pregnant women in Tanzania. European journal of clinical nutrition. 2010;64(8):808–17. doi: 10.1038/ejcn.2010.76. Epub 2010/06/03. [DOI] [PMC free article] [PubMed] [Google Scholar]
- 28.de Pee S, Semba RD. Role of nutrition in HIV infection: review of evidence for more effective programming in resource-limited settings. Food and nutrition bulletin. 2010;31(4):S313–44. Epub 2011/01/11. [PubMed] [Google Scholar]
- 29.Tang AM, Smit E, Semba RD, Shah N, Lyles CM, Li D, et al. Improved antioxidant status among HIV-infected injecting drug users on potent antiretroviral therapy. J Acquir Immune Defic Syndr. 2000;23(4):321–6. doi: 10.1097/00126334-200004010-00006. Epub 2000/06/03. [DOI] [PubMed] [Google Scholar]
- 30.Jones CY, Tang AM, Forrester JE, Huang J, Hendricks KM, Knox TA, et al. Micronutrient levels and HIV disease status in HIV-infected patients on highly active antiretroviral therapy in the Nutrition for Healthy Living cohort. J Acquir Immune Defic Syndr. 2006;43(4):475–82. doi: 10.1097/01.qai.0000243096.27029.fe. Epub 2006/10/05. [DOI] [PubMed] [Google Scholar]