

Abstract
Epistasis—the non-additive interactions between different genetic loci—constrains evolutionary pathways, blocking some and permitting others1–8. For biological networks such as transcription circuits, the nature of these constraints and their consequences are largely unknown. Here we describe the evolutionary pathways of a transcription network that controls the response to mating pheromone in yeasts9. A component of this network, the transcription regulator Ste12, has evolved two different modes of binding to a set of its target genes. In one group of species, Ste12 binds to specific DNA binding sites, while in another lineage it occupies DNA indirectly, relying on a second transcription regulator to recognize DNA. We show, through the construction of various possible evolutionary intermediates, that evolution of the direct mode of DNA binding was not directly accessible to the ancestor. Instead, it was contingent on a lineage-specific change to an overlapping transcription network with a different function, the specification of cell type. These results show that analyzing and predicting the evolution of cis-regulatory regions requires an understanding of their positions in overlapping networks, as this placement constrains the available evolutionary pathways.
Pathways of evolution are highly dependent on their starting points, a phenomenon often referred to as historical contingency1–3. For example, studies of protein evolution have shown that initial permissive mutations are often required before a second mutation causes an evolutionary shift in function4. Without the initial mutation, the second mutation could be deleterious. The structural requirements for protein folding and function underlie such behavior and are a common source of epistasis5–7.
Considerably less is known about historical contingency in the evolution of transcription networks, which often comprise several transcription regulators and many target genes. It has been suggested that epistasis is prevalent in the evolution of regulatory networks8,10, but detailed examples documenting its underlying causes are largely lacking. Here, we studied the effects of contingency in the evolution of a transcription network in yeast that has diversified over several hundred million years. We found that network-level changes altered the evolutionary pathways available to individual cis-regulatory regions as these changes occurred at the intersection of two different but overlapping networks.
The transcription regulator Ste12 controls the response to mating pheromone in the budding yeast Saccharomyces cerevisiae11 (Fig. 1a). When cells sense pheromone of the opposite mating type, Ste12 is activated by phosphorylation and transcriptionally upregulates many genes involved in mating12. This function of Ste12 is conserved in the dairy yeast, Kluyveromyces lactis13 (Fig. 1b–c and Extended Data Fig. 1), a species that diverged from S. cerevisiae ~100 million years ago14, and in the more distantly related pathogen of humans, Candida albicans15,16. Thus, many aspects of pheromone-activated gene expression (including the DNA sequence recognized by Ste12) have been conserved across the ~200 million years separating these three species from their common ancestor.
Figure 1. Evolution of the pheromone response in budding yeast.

a, During mating, cells sense a peptide pheromone (brown molecule) and transmit this signal to the transcription factor Ste12. b, K. lactis a cells were induced with 10μg/mL synthetic α-factor pheromone, and gene expression was measured by quantitative RT-qPCR over time. Shown are mean values of three independent genetic isolates +/− s.d. c, Conserved pheromone responsive genes were scored for the presence of Ste12 cis-regulatory motifs in their upstream regulatory regions. The track indicates the −log10(P) for the enrichment of the Ste12 motif in each set of genes in each species, by hypergeometric distribution. The genes were divided into a-specific genes and general pheromone-activated genes. The general pheromone-activated genes were used to independently generate the Ste12 cis-regulatory motif in each of four clades using MEME.
The genes induced by pheromone-activated Ste12 can be classified into two distinct sets, those genes specific to either the a or the α cell types (5–12 genes, depending on the species), and the general pheromone-activated genes (~100 genes), which are induced in both cell types. The three yeast species described above all have two mating cell types, a and α, that express complementary sets of genes allowing them to mate with the opposite mating type17. This study focuses on the a-specific genes (asgs), so named because they are expressed and respond to pheromone in a cells but not in α cells.
Using bioinformatics approaches, we quantified the number of Ste12 cis-regulatory sequences upstream of the asgs and the general pheromone-activated genes in the genomes of 40 yeasts. For the general pheromone-activated genes, Ste12 binding sites were significantly enriched (relative to the rest of the genome) across the Candida, Kluyveromyces, and Saccharomyces clades. Given the central, conserved role of Ste12 in the pheromone-response, this enrichment was expected. However, the asgs showed enrichment for Ste12 binding sites only in the Saccharomyces clade (Fig. 1c and Extended Data Fig. 2). Although the asgs respond to pheromone across all three clades, they appeared to lack Ste12 cis-regulatory sequences in the Kluyveromyces and Candida clades. We considered three scenarios for how Ste12 activates the asgs in clades where these genes lack Ste12 cis-regulatory sequences: (1) Ste12 could bind to DNA sites in the asgs that are sufficiently degenerate that they fall below our threshold of detection; (2) Ste12 could be recruited through protein-protein interactions with a second transcription regulator18 that binds directly to other cis-regulatory sites upstream of the asgs; or (3) Ste12 could act “upstream” by activating another regulator that binds to and activates the asgs directly.
We distinguished among these models (or a combination of them) by identifying the regulatory regions bound by Ste12 in K. lactis by chromatin immunoprecipitation followed by sequencing (ChIP-seq). As in S. cerevisiae9, K. lactis Ste12 was bound to the upstream regions of the asgs (Fig. 2a, b) as well as to the general pheromone-activated genes (Fig. 2c). Thus, K. lactis Ste12 is recruited to the promoters of the asgs and activates them in response to pheromone in the absence of recognizable Ste12 binding sites.
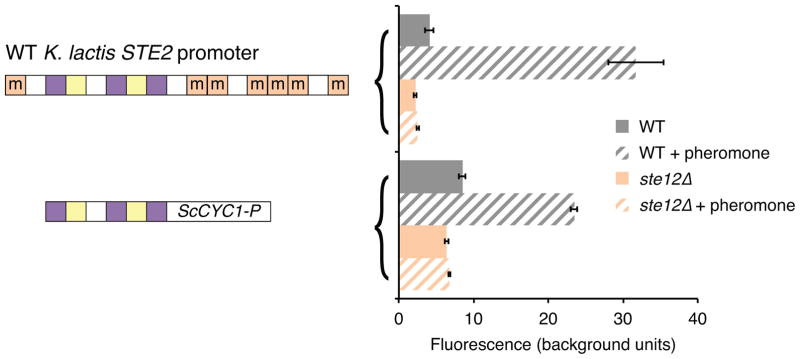
Figure 2. Ste12 is recruited to asg promoters in K. lactis without its binding site.

a–c, Chromatin immunoprecipitation of Ste12-myc using anti-myc antibodies (orange tracks) and an untagged control (gray track). The y-axis indicates sequencing read coverage. Matches to the Ste12 binding site are shown as orange stars, and matches to the a2-Mcm1 binding site are shown as pink rectangles. Shown are two conserved a-specific genes (a, b), one general pheromone-activated genes (c). d, At left, organization of the K. lactis STE2 regulatory region. cis-regulatory sites for a2, Mcm1, and Ste12 are shown in pink, green, and orange, respectively. Sites marked with an “m” reflect DNA sequences that contain a one-basepair mismatch to the 7-basepair consensus Ste12 cis-regulatory site. At right, the K. lactis STE2 regulatory region was fused to GFP and fluorescence was measured by flow cytometry. Shown is the mean fluorescence of three independent genetic isolates +/− s.d. Bottom, the construct contains two point mutations in each of the mismatched Ste12 cis-regulatory sites that should destroy any residual Ste12 binding to these sites. Although this construct is pheromone-inducible, we note that the basal expression of the K. lactis promoter increased when the mismatched Ste12 sites were mutated, probably through the creation of a binding site for another activator. One asterisk, P < 0.05, three asterisks, P < 0.001, by ANOVA followed by Tukey’s honest significant difference; for clarity, only the most relevant relationships are shown.
We considered the possibility that Ste12 is recruited to the asgs in K. lactis through a series of low-affinity cis-regulatory sequences or “mismatched” sequences, a situation that has been documented for certain other transcription regulators19,20. In our case, the mismatched Ste12 sites are ubiquitous across the K. lactis genome (Extended Data Fig. 3); by mutating these mismatched sites, we showed they are not required for induction of the asgs by Ste12 (Fig. 2d,e; Extended Data Fig. 4).
Three experimental results show that, in the K. lactis lineage, Ste12 is indirectly recruited to the asgs by association with the transcription regulator a2. a2 is encoded by the MATa2 gene in the a mating-type locus; it is thus expressed in a cells (but not in α cells), where it activates transcription of the asgs21. (1) The Ste12 ChIP peaks at the asgs were positioned over the cis-regulatory motif for a2 (Fig. 2a, b). (2) Deletion of the MATa2 gene impairs pheromone-induction of the asgs (Fig. 3b, c). (3) The cis-regulatory sequence for a2 is sufficient to mediate pheromone induction when moved into a naïve promoter. a2 always works with a ubiquitously expressed regulator, Mcm121 (Extended Data Fig. 5), so we kept the cis-regulatory sites of these regulators together for the purpose of this experiment. The a2-Mcm1 site, when inserted into a test reporter, activated GFP in response to pheromone (Fig. 3d and Extended Data Fig. 6). No Ste12 cis-regulatory sites (even mismatched ones) were present in the DNA added to the reporter construct, and the reporter itself was not pheromone-inducible. ChIP-seq was performed in a K. lactis strain that contained this reporter, and the a2-Mcm1 site was sufficient for efficient recruitment of Ste12 in the presence of pheromone (Fig. 3e). We can rule out the possibility that Mcm1 alone recruits Ste12 from the fact that Mcm1 binds to hundreds of genes in K. lactis and none of these are pheromone-inducible except those also bound by a222,23. Thus, the majority of the specificity for recruitment of Ste12 must come from a2. We also note that Ste12 did not bind to the promoter region of the MATa2 gene (not shown), ruling out the possibility that during the pheromone response, Ste12 acts as an upstream activator of a2, which then activates the asgs.
Figure 3. a2 mediates the a-specific gene pheromone response in K. lactis.

a, Diagram of asg cell-type-specific regulation in K. lactis. b, c, Induction of the asgs in response to pheromone in WT and MATa2Δ strains. Expression is shown as mean for three independent genetic isolates +/− s.d. for a-specific genes (b) and general pheromone-activated genes (c). Ste2 is shown as a general pheromone-activated gene because in this strain, its promoter was replaced by the SST2 promoter. The differences between WT and MATa2Δ pheromone induction are significant in b, P < 0.01, but not in c P > 0.05, by ANOVA. d, The a2-Mcm1 sites were moved into the S. cerevisiae CYC1ΔUAS promoter and expression was measured in K. lactis in uninduced (solid bars) and pheromone-induced (striped bars) conditions. Shown is mean fluorescence of three independent genetic isolates +/− s.d. Three asterisks, P < 0.001, by ANOVA followed by Tukey’s honest significant difference. e, Ste12-myc ChIP-Seq signal for the genome-integrated reporter construct. Symbols are described in Figure 2.
We now turn to the question of how the two different recruitment modes of Ste12 (direct and indirect) arose. Prior experiments in several species16,21 combined with the phylogenetic distribution of Ste12 (Fig. 1c) and a216 binding sites indicate that indirect recruitment by a2 at the asgs was ancestral, and that the Ste12 sites were gained in the Saccharomyces clade. At the general pheromone-activated genes, Ste12 is directly bound to DNA by cis-regulatory sequences in all three clades, providing an explanation for why Ste12 has retained the same DNA-binding specificity.
To understand why Ste12 cis-regulatory sites were gained at the asgs in the Saccharomyces clade and not other clades, we introduced these sites into an ancestral-like promoter (STE2 of K. lactis) and observed the effect on asg expression (Fig. 4a). Introducing strong Ste12 sites by point-mutating mismatched sites in the regulatory region increased the expression in a cells, but it also resulted in mis-expression of the gene in α cells. Expression of asgs in α cells interferes with sexual reproduction because the cells respond to their own pheromones and eventually become insensitive to both a- and α-pheromone24. Thus, we conclude—in the absence of other changes—that the evolution of high-affinity Ste12 sites disrupts the function of the ancestral form of regulation, causing mis-expression of the asgs in α cells that would result in a loss of mating.
Figure 4. Repression by α2 is necessary for the gain of Ste12 sites.

a, Expression of the K. lactis STE2 reporter in the absence of pheromone. Expression is shown as mean for three independent isolates +/− s.d. Three asterisks, P < 0.001; two asterisks, P < 0.01, by ANOVA followed by Tukey’s honest significant difference; for clarity, only the most relevant relationships are shown b, Diagram of the cis-regulatory sites in the L. kluyveri STE2 promoter. c, The STE2 gene promoter from L. kluyveri was fused to GFP and integrated into the L. kluyveri genome. Ste12 and α2 binding sites were introduced by point mutation, and each construct was measured in four independent genetic isolates by flow cytometry. Shown is the mean fluorescence for four independent isolates +/− s.d. Statistical tests shown as in panel a. d, Constructs with added Ste12 binding sites were tested for the ability to compensate for the deletion of the MATa2 gene in K. lactis. Shown as in panel a.
These results indicate that a prior permissive change in asg regulation was likely necessary for Ste12 sites to be gained in the Saccharomyces clade. In the Saccharomyces lineage, after the split from Kluyveromyces, the activator of the asgs (a2) was replaced by an α cell-type-specific repressor, α223. To test whether this change permitted the Ste12 cis-regulatory sites to be gained upstream of the asgs, we performed an experiment in Lachancea kluyveri (Fig. 4b), a species in which all of the asgs are activated by a2, and (in contrast to K. lactis) two of them are also repressed by α223. In other words, we chose a species in which both a2 and α2 are active. We used the L. kluyveri STE2 regulatory region, which is normally regulated by a2 but not α2, to test the effects of introducing the Ste12 and α2 cis-regulatory sites. Introducing Ste12 cis-regulatory sites by point mutation again resulted in ectopic expression of the asg in α cells, as we observed for K. lactis (Fig. 4c). However, this mis-expression could be mitigated by adding cis-regulatory sequences for the repressor α2 (Fig. 4c), the situation found naturally in S. cerevisiae24,25. These results indicate that the switch from a2-mediated activation to α2-mediated repression of the asgs was permissive for the gain of Ste12 cis-regulatory sequences in this lineage.
α2 repression was gained in the common ancestor of Kluyveromyces and Saccharomyces clades23, and the Ste12 cis-regulatory sites were gained millions of years later, in the Saccharomyces clade (Fig. 5a). These observations indicate that, while the gain of α2 repression was permissive for the subsequent gain of Ste12 sites, it did not directly cause it. The gain of Ste12 sites did occur, however, at roughly the same time as another evolutionary event, the loss of the activator MATa221, suggesting that the gain of Ste12 sites may have permitted the loss of this gene (Fig. 5a). To test this possibility, we observed the expression of the K. lactis STE2 reporter in the absence of a2 (Fig. 4d and Extended Data Fig. 7). Adding the Ste12 cis-regulatory sites could indeed compensate for the deletion of MATa2 in both basal and pheromone-activated gene expression (Fig. 4c, d). If we assume that loss of MATa2—on its own—would have been deleterious, it is likely that at least some Ste12 sites were gained first, thus mitigating the potentially deleterious effects of losing MATa2.
Figure 5. Summary of key events in the evolution of asg regulation .

a, The gain of α2 repression occurred before the gain of Ste12 cis-regulatory sites, whereas the loss of MATa2 occurred on the same branch as the gain of Ste12 sites. b, Summary of the events that allowed and prohibited the gain of Ste12 cis-regulatory sequences upstream of the a-specific genes. Thick arrows indicate pathways that maintained regulation, and thin arrows those that would have disrupted it.
Gene regulatory regions are shaped by evolutionary forces including selection and drift, each of which leave distinct patterns in the cis-regulatory regions of genes26. To further understand the forces that shaped the evolution of asg cis-regulatory regions, we employed two independent approaches27,28. Both methods suggested that Ste12 cis-regulatory sites in the asgs are maintained by purifying selection in the Saccharomyces clade, but, as predicted, the “mismatched” Ste12 sites in both the Saccharomyces and Kluyveromyces clades are not (Extended Data Fig. 8, 9). In particular, in the Saccharomyces clade, Ste12 sites were conserved with respect to the rest of the intergenic regions [P = 1.40e-06 by likelihood ratio test (LRT)], while mismatched sites were not (P = 1 by LRT). In the Kluyveromyces clade, neither Ste12 sites (P = 0.26 by LRT) nor mismatched sites (P = 1 by LRT) show significant conservation in the asgs.
Our previous studies have shown how the transcription network controlling cell-type identity in yeast evolved16,21,23. Here, we have shown how the evolutionary history of this network affected the evolution of an overlapping but distinct transcription network controlling the response to mating pheromone. The two networks overlap by virtue of sharing a common set of target genes. The genes at the intersection of these two networks (the asgs) were constrained in the evolutionary pathways available to them. In the ancestral state, the gain of Ste12 cis-regulatory sites were not allowed, as this would lead to cell-type mis-expression. The evolution of α2 repression, which occurred in the ancestor of the S. cerevisiae clade, made the gain of these sites possible, and the loss of the MATa2 gene at a much later time necessitated the maintenance of the Ste12 sites and prevented a return to the ancestral mode of regulation (Fig. 5b).
In protein evolution, neutral mutations can alter the effect of subsequent mutations, suggesting that evolution depends on chance events2. Although we do not know whether the gain of α2 repression was strictly neutral, it did not change the overall asg expression pattern. However, it did permit changes in the overlapping circuit responsible for pheromone induction. Stated another way, changes in the asg circuitry altered the effect of introducing Ste12 sites to the asgs. Such epistatic interactions are the source of the historical contingency we observed in the asg regulatory network, effects that are well documented for individual proteins4.
Studies of enhancers across species have indicated that many molecular solutions are possible for a given output16,23,29,30. Our results show that not all solutions are accessible, and those that are accessible are contingent on the functional interactions between overlapping transcription networks. These constraints are not apparent from observation of the individual components of networks (e.g. a single enhancer), but only arise from complex interactions between networks. We propose that understanding the evolution of cis-regulatory regions (and predicting their behavior) requires an understanding of the network structures in which they function.
Methods
Distribution of Ste12 cis-regulatory sites
Conserved, highly pheromone-induced genes were identified by comparing previously published expression data from S. cerevisiae and C. albicans15,31. We combined results from three independent ortholog maps22,32,33 to find pheromone response genes that were present in most hemiascomycete yeast species. General pheromone-activated genes were defined as genes that were among the top ten most highly pheromone-activated genes in S. cerevisiae or C. albicans, present in the genomes of most hemiascomycete species, and are not an asg in S. cerevisiae, K. lactis, or C. albicans. The asgs were defined as showing differential expression between a and α cells in S. cerevisiae, K. lactis, or C. albicans. The protein sequences of these genes were used as a psi-blast query to identify orthologs in species whose genomes were not included in any of the ortholog maps. Mfa1 genes, which encode for the a-factor pheromone, are too short to be annotated by automated bioinformatics techniques, so they were identified manually in most species using tblastn.
Ste12 motifs were generated from general pheromone response gene intergenic regions pooled from all the species in a given clade. Each intergenic region was considered up to 600bp upstream of the start codon, a distance that is likely to capture functional Ste12 cis-regulatory sites34. The program MEME was used to find overrepresented sequences in these sets of intergenic regions, under conditions assuming zero to one binding site per intergenic region. Because the motifs generated for Ste12 from the Kluyveromyces, Saccharomyces, and Candida clades were highly similar, we pooled intergenic regions from all three clades and generated a 7bp motif to score individual gene regulatory regions across the hemiascomycetes. The upstream 600bp of intergenic regions were scored as described35 for the number of Ste12 motifs above a given cutoff. For “consensus” sites, the cutoff only accepted a single sequence: TGAAACA. For mismatched sites, the cutoff allowed deviation from the consensus sequence of a single nucleotide in any position in the motif. For genes that were duplicated in a species (i.e. contained more than one copy) the copy with the largest number of Ste12 sites was taken, because this was the most stringent criterion to test our hypothesis that the a-specific genes lacked Ste12 sites in the Kluyveromyces and Candida clades. Mfa1 genes often are found in multiple copies in each species (i.e. Mfa1 and Mfa2) so two copies were included when present.
Ste12 motifs were also enumerated in the rest of the intergenic regions in each species. Enrichment of the Ste12 motif in either the a-specific genes or the general pheromone response genes with respect to the rest of the genome was calculated using the hypergeometric distribution at all possible cutoffs of number of Ste12 motifs. The cutoff giving the most significant p-value was chosen, because this represented the most stringent test of our hypothesis that the a-specific genes lacked Ste12 sites in the Kluyveromyces and Candida clades.
Sequence data were obtained from the Yeast Gene Order Browser (YGOB) and the Joint Genomes Institute (JGI) websites (http://ygob.ucd.ie and http://genome.jgi.doe.gov, respectively).
Strain Construction
Constructs for gene disruption, epitope tagging, and promoter replacement were generated by fusion PCR36. Three to five individual PCR components were amplified using ExTaq (Takara), and 50 ng of each were combined into a single 50 μL reaction along wth 0.5 μL ExTaq, 0.4 μL 25 mM dNTPs, 0.1 μL of each 100 μM primer. The reactions were incubated in a thermocycler: 95°C 3:00, [95° 0:30, 55° 0:30, 72° 1:00/kb] x 4, [95° 0:30, 58–72° 0:30 (depending on the annealing temperature of the primers), 72° 1:00/kb] x 30, 72° 10:00.
The GFP reporters for K. lactis, L. kluyveri, and S. cerevisiae were constructed from the original vector that was made for use in K. lactis. pTS12 was made from a 5-piece fusion PCR, digested with KasI and HindIII (New England Biolabs) and ligated into pUC19 using Fast-Link ligase (Epicentre Biotechnologies). Vectors were treated with Antarctic phosphatase (New England Biolabs) for 30 minutes prior to ligation. The reporter consisted of the upstream flanking region of the K. lactis TRP1 gene, the S. cerevisiae TRP1 gene, the entire S. cerevisiae CYC1 upstream intergenic region, the caGFP and Act1 terminator37, and the downstream flanking region of K. lactis TRP1. The S. cerevisiae TRP1 gene was replaced with the hygromycin resistance marker from pFA6-HTB-hphMX438 by digestion with BsiWI and PmlI and ligated to make pTS16. The CYC1 promoter UAS was deleted by digestion with XhoI. DNA oligos with sites for NotI and BamHI sites were annealed in Fast-link ligase buffer (Epicentre Biotechnologies) and ligated in a 50:1 insert to vector ratio to make pTS26. This vector was used to make the other reporters for use in K. lactis by ligating annealed oligos or digested PCR products into the NotI and XhoI sites. Vectors incorporating an entire intergenic region of a gene were constructed by ligating digested PCR products the sites SacI and AgeI. The L. kluyveri reporter was made by cloning upstream and downstream homology to the TRP1 locus into the NgoMIV/BstEII and BlpI/HindIII sites, respectively. These homology regions were then swapped out for homology to the URA3 locus to improve the efficiency of integration of the reporter by selection with 5-FOA. The altered regions of the L. kluyveri STE2 promoter were cloned as with the K. lactis reporter. The S. cerevisiae reporter was made by cloning the STE2 promoter fused to GFP into a centromeric reporter, pRS412, using the KpnI and SacI sites.
To measure the pheromone response in a strain that lacks MATa2, we replaced the promoter of STE2 with that of a general pheromone response gene that is not dependent on a2. Strain yTS43 in which the STE2 promoter was replaced by the SST2 promoter was made in the MATa2Δ background. This replacement construct consisted of a 4-piece fusion PCR that contained 5′ homology, the URA3 marker, the SST2-promoter, and 3′ homology.
K. lactis and L. kluyveri were transformed with 1 μg DNA according to published protocols39,40, and S. cerevisiae was transformed using a standard lithium acetate protocol. Yeast were grown for 1 day on YEPD then replica plated onto selective media.
RT-Quantitative PCR
K. lactis cells were grown overnight for ~14h, then starved in SD medium lacking phosphate as previously described22. Cells were induced after 6h with 6.25 μM α-factor pheromone (WSWITLRPGQPIF >95% purity, 100mg/mL in 100% DMSO; Genemed Synthesis) or an equivalent amount of DMSO. Cells were removed at several time points and were pelleted, washed, and frozen in liquid nitrogen. Mutant strains were harvested at 4h, the final time point. Each experiment was performed in triplicate a single time. RNA was extracted using the RiboPure RNA Purification kit (Ambion). The RNA was reverse transcribed into cDNA using Superscript II as described previously41. Transcript levels were measured using SYBR green on a StepOnePlus RT PCR machine (Applied Biosystems). Transcripts were normalized to that of Vps4, a gene that was found to be highly consistent across conditions in previous expression experiments42. Statistics were performed using an ANOVA.
Chromatin Immunoprecipitation
Strains yTS314 and yTS315 were grown using a phosphate starvation protocol modified from our previously published protocol22. Yeast were grown overnight for ~14h, then pelleted, resuspended in phosphate starvation media, then diluted in 100–200mL phosphate starvation media to OD600 = 0.25 – 0.3. These cultures were grown for 2h, then 13-mer α-factor pheromone was added to 6.25 μM, and the cultures were grown for an additional 2h. Cells were crosslinked with 1% Formaldehyde for 15 minutes, quenched with glycine, pelleted, washed, and frozen in liquid nitrogen. Cells were lysed in 300–700μL lysis buffer (50mM HEPES/KOH pH 7.5, 140mM NaCl, 1mM EDTA, 1% Triton X-100, 0.1% Na-Deoxycholate) with added EDTA-free protease inhibitor tablet (Roche). Cells were transferred to a fresh tube with 500μL 0.4mm glass beads, and were lysed for ~45min on a vortex genie with tube adaptor (LabRepCo). Lysate was recovered by centrifugation, and sonicated 3–4X on a Diagenode Bioruptor (level 5, 30s on, 1min off). Lysate was cleared by centrifugation at max speed in a table-top centrifuge at 4 °C. Immunoprecipitation was carried out overnight with 300μL cleared lysate, 200μL fresh lysis buffer, and 10μL 200μg/mL anti-c-myc antibody (Invitrogen). 50μL of washed Protein G sepharose beads 50% slurry was added and incubated for 2h. The beads were washed and eluted as previously described43. Crosslinking was reversed by incubating 16h at 65 °C, and immunoprecipitated DNA was recovered using the MinElute kit (Qiagen). ChIP-Seq libraries were prepared using the NEBNext ChIP-Seq Library Prep kit for Illumina (New England Biolabs) and AMPure XP magnetic beads (Beckman Coulter, Inc). Size distribution of the libraries was determined with a BioAnalyzer 2100 (Agilent). Libraries were pooled and sequenced on a HiSeq 2500 (Illumina) through the UCSF Center for Advanced Technology (cat.ucsf.edu). Quality of reads was checked using FastQC (http://www.bioinformatics.babraham.ac.uk/projects/fastqc/). Reads were indexed and aligned to the genome using Bowtie 244. File types were manipulated using SAMtools45, and peaks were called using MACS46. Coverage and peak calls were visualized in MochiView47. The ChIP experiment was performed with a total of three replicates on two separate days, and a single replicate was performed of the untagged control.
Reporter Assays
K. lactis reporter strains were grown as 1mL cultures in SD medium overnight for ~14h in a 96 well plate. Cells were pelleted, resuspended in phosphate starvation medium, and diluted to OD600 = 0.25. Cells were grown 6h, then induced with 6.25μM α-factor (or DMSO for control cells) for 4h. Cells were diluted 10-fold into the same media before measuring GFP fluorescence on a BD LSR II Flow Cytometer. A total of 10,000 cell measurements were taken for each strain. Cells were gated to exclude debris and the mean of the cell population was used for further analysis. The autofluorescence level of a cell containing no reporter was subtracted from each reporter strain, and the standard deviation of each reporter strain was added to the standard deviation of the autofluorescence strain. Values were divided by the mean autofluorescence to give an indication of the signal relative to noise. Multiple independent isolates were tested for each reporter strain, and each experiment was performed separately two or more times. In rare cases where one isolate displayed a drastic difference in expression from the others, it was tested to see whether it was a statistical outlier, and if so, was removed for subsequent experimental repetitions. Statistics for the reporter assays were conducted using an ANOVA followed by Tukey’s HSD test.
Selection on Ste12 cis-regulatory sites
The intergenic sequences for the a-specific genes were obtained from YGOB for the species S. cerevisiae, S. paradoxus, S. mikatae, S. uvarum, and S. kudriavzevii. 19 K. lactis strains were obtained from the Phaff Yeast Culture Collection (Davis, California). From these and 3 additional K. lactis strains, a-specific gene intergenic sequences were amplified from both directions using ExTaq (Takara) and Sanger sequenced. The intergenic regions from the Saccharomyces sensu stricto and K. lactis species complex were then analyzed separately as follows. For each species or isolate, the a-specific gene intergenic regions were scored for the presence of strong and weak Ste12 cis-regulatory regions. The intergenic regions were aligned with MUSCLE48, and concatenated for tree building. The appropriate nucleotide evolution model was selected as previously described49; the HKY+G model was selected for the sensu stricto species, and the GTR+G model was selected for K. lactis. These models output the estimated evolutionary rate for each site in the alignment and each site was categorized as being part of a consensus or mismatched Ste12 cis-regulatory site in at least one species, or no site at all. Then, the trees generated by this method were used as input to test for different evolutionary rates among the different categories using the RPHAST package. The null model was generated using phyloFit on the intergenic regions lacking mismatched and consensus Ste12 sites using the “HKY85” model for the sensu stricto species and the “REV” model for K. lactis. Then, the mismatched and consensus Ste12 sites were tested for increased conservation in comparison the null model using phyloP.
Extended Data
Extended Data Figure 1. Conservation of Ste12 function.

Expression of the asg STE2 and the general pheromone-activated gene FUS3 in the presence of K. lactis Ste12, in the absence of Ste12, and in the presence of S. cerevsiae Ste12. Expression under uninduced and pheromone-induced conditions are shown as mean fluorescence of three independent genetic isolates +/− s.d.
Extended Data Figure 2. Distribution of Ste12 cis-regulatory sites.

Individual a-specific genes and general pheromone-activated genes were scored for the presence of Ste12 cis-regulatory motifs in their upstream regulatory regions. Shown is the number of consensus Ste12 sites within 600bp of the translation start site. Orthologs that could not be identified in a given species are shown in gray. The enrichment for the Ste12 motif in each set of genes in each species is shown in Figure 1c.
Extended Data Figure 3. Distribution of mismatched Ste12 cis-regulatory sites.

asgs were scored for the presence of weak Ste12 binding sites in their upstream regulatory regions. The enrichment of the Ste12 site in the asgs in each species is shown in the bottom row.
Extended Data Figure 4. Ste12 sites are required in S. cerevisiae asgs.
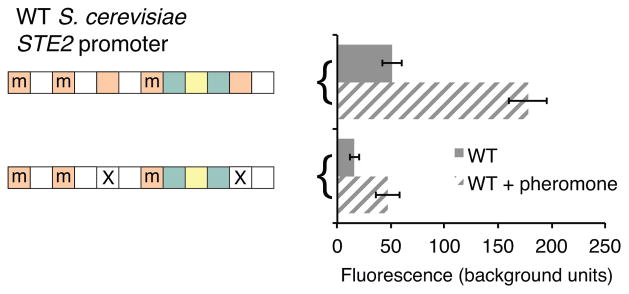
The S. cerevisiae STE2 promoter was fused to GFP and the role of Ste12 cis-regulatory sites in expression. Expression under uninduced and pheromone-induced conditions are shown as mean fluorescence of three independent genetic isolates +/− s.d.
Extended Data Figure 5. a2 sites are sufficient for pheromone activation.

The K. lactis STE2 GFP reporter and heterologous reporter containing the a2-Mcm1 binding site were transformed into wild type and ste12Δ cells. Shown is mean fluorescence of three independent genetic isolates +/− s.d.
Extended Data Figure 6. Mcm1 sites are required in K. lactis asgs.
The K. lactis STE2 GFP reporter was tested with a mutated Mcm1 cis-regulatory site. Shown is mean fluorescence of three independent genetic isolates +/− s.d.
Extended Data Figure 7. Mcm1 sites do not compensate for the loss of a2.

a, The presence of the Mcm1 binding site is unchanged across the Candida, Kluyveromyces, and Saccharomyces clades 22,24. asgs were scored for the strength of the Mcm1 binding site in their upstream regulatory regions. The enrichment of the strength of the Mcm1 site in the asgs in each species is shown in the bottom row. b, A construct with increased Mcm1 binding site strength was tested for its ability to compensate for the deletion of a2. Shown is the mean fluorescence of three independent genetic isolates +/− s.d.
Extended Data Figure 8. Loss of Ste12 sites decreased in the Saccharomyces clade.

The yeast phylogeny along with the number of Ste12 binding sites in extant species was used to estimate the gain and loss rate of the sites over evolutionary time. The Saccharomyces clade was allowed to have different rates (orange) (X2 = 49.33, df = 2, P = 1.94e-11). The gain and loss rate units are cis-regulatory sites per amino acid substitution in the species phylogeny.
Extended Data Figure 9. Saccharomyces Ste12 binding sites evolve under purifying selection.

The evolutionary rate of nucleotides in Ste12 binding sites was compared to rates in the rest of the upstream regulatory regions of the a-specific genes, shown as violin plots. Promoters between closely related species were aligned and the evolutionary rate of each basepair in the alignment was determined after model selection.
Acknowledgments
We thank S. Coyle, I. Nocedal, C. Dalal, C. Britton, C. Baker, and V. Hanson-Smith for valuable comments on the manuscript. We also thank K. Pollard, E. Mancera, C. Nobile, and Q. Mitrovich for advice and assistance with experiments and analysis. We thank Kyria Boundy-Mills of the Phaff Yeast Culture Collection, University of California, Davis for the K. lactis isolates. The work was supported by grant R01 GM037049 from the National Institutes of Health. T.R.S. was supported by a Graduate Research Fellowship from the National Science Foundation.
Footnotes
Author Contributions
T.R.S performed gene expression experiments, reporter assays, ChIP-Seq, and bioinformatics analyses. L.N.B. obtained and sequenced the asg promoters of the K. lactis isolates. B.B.T. conceived of, designed, and performed a preliminary analysis of the phylogenetic distribution of Ste12 sites across the asgs. T.R.S., L.N.B., and A.D.J. designed and interpreted experiments and edited the manuscript. T.R.S. and A.D.J. wrote the manuscript.
ChIP-Seq data has been deposited at the Gene Expression Omnibus (GEO) repository under accession number GSE65792.
The authors declare no competing financial interests.
References
- 1.Blount ZD, Borland CZ, Lenski RE. Historical contingency and the evolution of a key innovation in an experimental population of Escherichia coli. Proceedings of the National Academy of Sciences. 2008;105:7899–7906. doi: 10.1073/pnas.0803151105. [DOI] [PMC free article] [PubMed] [Google Scholar]
- 2.Harms MJ, Thornton JW. Nature. 2014. Historical contingency and its biophysical basis in glucocorticoid receptor evolution. [DOI] [PMC free article] [PubMed] [Google Scholar]
- 3.Mohrig JR, et al. Importance of historical contingency in the stereochemistry of hydratase-dehydratase enzymes. Science. 1995;269:527–529. doi: 10.1126/science.7624773. [DOI] [PubMed] [Google Scholar]
- 4.Harms MJ, Thornton JW. Evolutionary biochemistry: revealing the historical and physical causes of protein properties. Nat Rev Genet. 2013;14:559–571. doi: 10.1038/nrg3540. [DOI] [PMC free article] [PubMed] [Google Scholar]
- 5.Ortlund EA, Bridgham JT, Redinbo MR, Thornton JW. Crystal structure of an ancient protein: evolution by conformational epistasis. Science. 2007;317:1544–1548. doi: 10.1126/science.1142819. [DOI] [PMC free article] [PubMed] [Google Scholar]
- 6.Bershtein S, Segal M, Bekerman R, Tokuriki N, Tawfik DS. Robustness-epistasis link shapes the fitness landscape of a randomly drifting protein. Nature. 2006;444:929–932. doi: 10.1038/nature05385. [DOI] [PubMed] [Google Scholar]
- 7.Bloom JD, Labthavikul ST, Otey CR, Arnold FH. Protein stability promotes evolvability. Proc Natl Acad Sci USA. 2006;103:5869–5874. doi: 10.1073/pnas.0510098103. [DOI] [PMC free article] [PubMed] [Google Scholar]
- 8.Gerke J, Lorenz K, Cohen B. Genetic interactions between transcription factors cause natural variation in yeast. Science. 2009;323:498–501. doi: 10.1126/science.1166426. [DOI] [PMC free article] [PubMed] [Google Scholar]
- 9.Ren B, et al. Genome-wide location and function of DNA binding proteins. Science. 2000;290:2306–2309. doi: 10.1126/science.290.5500.2306. [DOI] [PubMed] [Google Scholar]
- 10.Payne JL, Wagner A. Constraint and contingency in multifunctional gene regulatory circuits. PLoS Comput Biol. 2013;9:e1003071. doi: 10.1371/journal.pcbi.1003071. [DOI] [PMC free article] [PubMed] [Google Scholar]
- 11.Dolan JW, Kirkman C, Fields S. The yeast STE12 protein binds to the DNA sequence mediating pheromone induction. Proc Natl Acad Sci USA. 1989;86:5703–5707. doi: 10.1073/pnas.86.15.5703. [DOI] [PMC free article] [PubMed] [Google Scholar]
- 12.Herskowitz I. MAP kinase pathways in yeast: for mating and more. Cell. 1995;80:187–197. doi: 10.1016/0092-8674(95)90402-6. [DOI] [PubMed] [Google Scholar]
- 13.Coria R, et al. The pheromone response pathway of Kluyveromyces lactis. FEMS Yeast Res. 2006;6:336–344. doi: 10.1111/j.1567-1364.2005.00022.x. [DOI] [PubMed] [Google Scholar]
- 14.Kensche PR, Oti M, Dutilh BE, Huynen MA. Conservation of divergent transcription in fungi. Trends Genet. 2008;24:207–211. doi: 10.1016/j.tig.2008.02.003. [DOI] [PubMed] [Google Scholar]
- 15.Bennett RJ, Uhl MA, Miller MG, Johnson AD. Identification and characterization of a Candida albicans mating pheromone. Mol Cell Biol. 2003;23:8189–8201. doi: 10.1128/MCB.23.22.8189-8201.2003. [DOI] [PMC free article] [PubMed] [Google Scholar]
- 16.Tsong AE, Tuch BB, Li H, Johnson AD. Evolution of alternative transcriptional circuits with identical logic. Nature. 2006;443:415–420. doi: 10.1038/nature05099. [DOI] [PubMed] [Google Scholar]
- 17.Herskowitz I. A regulatory hierarchy for cell specialization in yeast. Nature. 1989;342:749–757. doi: 10.1038/342749a0. [DOI] [PubMed] [Google Scholar]
- 18.Borneman AR, et al. Divergence of transcription factor binding sites across related yeast species. Science. 2007;317:815–819. doi: 10.1126/science.1140748. [DOI] [PubMed] [Google Scholar]
- 19.Ramos AI, Barolo S. Low-affinity transcription factor binding sites shape morphogen responses and enhancer evolution. Philos Trans R Soc Lond, B, Biol Sci. 2013;368:20130018. doi: 10.1098/rstb.2013.0018. [DOI] [PMC free article] [PubMed] [Google Scholar]
- 20.Crocker J, et al. Low Affinity Binding Site Clusters Confer Hox Specificity and Regulatory Robustness. Cell. 2014 doi: 10.1016/j.cell.2014.11.041. [DOI] [PMC free article] [PubMed] [Google Scholar]
- 21.Tsong AE, Miller MG, Raisner RM, Johnson AD. Evolution of a combinatorial transcriptional circuit: a case study in yeasts. Cell. 2003;115:389–399. doi: 10.1016/s0092-8674(03)00885-7. [DOI] [PubMed] [Google Scholar]
- 22.Tuch BB, Galgoczy DJ, Hernday AD, Li H, Johnson AD. The evolution of combinatorial gene regulation in fungi. PLoS Biol. 2008;6:e38. doi: 10.1371/journal.pbio.0060038. [DOI] [PMC free article] [PubMed] [Google Scholar]
- 23.Baker CR, Booth LN, Sorrells TR, Johnson AD. Protein modularity, cooperative binding, and hybrid regulatory States underlie transcriptional network diversification. Cell. 2012;151:80–95. doi: 10.1016/j.cell.2012.08.018. [DOI] [PMC free article] [PubMed] [Google Scholar]
- 24.Strathern J, Hicks J, Herskowitz I. Control of cell type in yeast by the mating type locus. The alpha 1-alpha 2 hypothesis. J Mol Biol. 1981;147:357–372. doi: 10.1016/0022-2836(81)90488-5. [DOI] [PubMed] [Google Scholar]
- 25.Galgoczy DJ, et al. Genomic dissection of the cell-type-specification circuit in Saccharomyces cerevisiae. Proc Natl Acad Sci USA. 2004;101:18069–18074. doi: 10.1073/pnas.0407611102. [DOI] [PMC free article] [PubMed] [Google Scholar]
- 26.Wray GA, et al. The evolution of transcriptional regulation in eukaryotes. Mol Biol Evol. 2003;20:1377–1419. doi: 10.1093/molbev/msg140. [DOI] [PubMed] [Google Scholar]
- 27.Otto W, et al. Measuring transcription factor-binding site turnover: a maximum likelihood approach using phylogenies. Genome Biol Evol. 2009;2009:85–98. doi: 10.1093/gbe/evp010. [DOI] [PMC free article] [PubMed] [Google Scholar]
- 28.Hubisz MJ, Pollard KS, Siepel A. PHAST and RPHAST: phylogenetic analysis with space/time models. Brief Bioinformatics. 2011;12:41–51. doi: 10.1093/bib/bbq072. [DOI] [PMC free article] [PubMed] [Google Scholar]
- 29.Hare EE, Peterson BK, Iyer VN, Meier R, Eisen MB. Sepsid even-skipped enhancers are functionally conserved in Drosophila despite lack of sequence conservation. PLoS Genet. 2008;4:e1000106. doi: 10.1371/journal.pgen.1000106. [DOI] [PMC free article] [PubMed] [Google Scholar]
- 30.Swanson CI, Schwimmer DB, Barolo S. Rapid evolutionary rewiring of a structurally constrained eye enhancer. Curr Biol. 2011;21:1186–1196. doi: 10.1016/j.cub.2011.05.056. [DOI] [PMC free article] [PubMed] [Google Scholar]
- 31.Tirosh I, Weinberger A, Bezalel D, Kaganovich M, Barkai N. On the relation between promoter divergence and gene expression evolution. Mol Syst Biol. 2008;4:159. doi: 10.1038/msb4100198. [DOI] [PMC free article] [PubMed] [Google Scholar]
- 32.Wapinski I, Pfeffer A, Friedman N, Regev A. Natural history and evolutionary principles of gene duplication in fungi. Nature. 2007;449:54–61. doi: 10.1038/nature06107. [DOI] [PubMed] [Google Scholar]
- 33.Gordon JL, et al. Evolutionary erosion of yeast sex chromosomes by mating-type switching accidents. Proc Natl Acad Sci USA. 2011;108:20024–20029. doi: 10.1073/pnas.1112808108. [DOI] [PMC free article] [PubMed] [Google Scholar]
- 34.Lusk RW, Eisen MB. Spatial promoter recognition signatures may enhance transcription factor specificity in yeast. PLoS ONE. 2013;8:e53778. doi: 10.1371/journal.pone.0053778. [DOI] [PMC free article] [PubMed] [Google Scholar]
- 35.D’haeseleer P. What are DNA sequence motifs? Nat Biotechnol. 2006;24:423–425. doi: 10.1038/nbt0406-423. [DOI] [PubMed] [Google Scholar]
- 36.Wach A. PCR-synthesis of marker cassettes with long flanking homology regions for gene disruptions in S. cerevisiae. Yeast. 1996;12:259–265. doi: 10.1002/(SICI)1097-0061(19960315)12:3%3C259::AID-YEA901%3E3.0.CO;2-C. [DOI] [PubMed] [Google Scholar]
- 37.Cormack BP, et al. Yeast-enhanced green fluorescent protein (yEGFP): a reporter of gene expression in Candida albicans. Microbiology (Reading, Engl) 1997;143(Pt 2):303–311. doi: 10.1099/00221287-143-2-303. [DOI] [PubMed] [Google Scholar]
- 38.Tagwerker C, et al. HB tag modules for PCR-based gene tagging and tandem affinity purification in Saccharomyces cerevisiae. Yeast. 2006;23:623–632. doi: 10.1002/yea.1380. [DOI] [PubMed] [Google Scholar]
- 39.Kooistra R, Hooykaas PJJ, Steensma HY. Efficient gene targeting in Kluyveromyces lactis. Yeast. 2004;21:781–792. doi: 10.1002/yea.1131. [DOI] [PubMed] [Google Scholar]
- 40.Gojkovic Z, Jahnke K, Schnackerz KD, Piskur J. PYD2 encodes 5,6-dihydropyrimidine amidohydrolase, which participates in a novel fungal catabolic pathway. J Mol Biol. 2000;295:1073–1087. doi: 10.1006/jmbi.1999.3393. [DOI] [PubMed] [Google Scholar]
- 41.Mitrovich QM, Tuch BB, Guthrie C, Johnson AD. Computational and experimental approaches double the number of known introns in the pathogenic yeast Candida albicans. Genome Res. 2007;17:492–502. doi: 10.1101/gr.6111907. [DOI] [PMC free article] [PubMed] [Google Scholar]
- 42.Booth LN, Tuch BB, Johnson AD. Intercalation of a new tier of transcription regulation into an ancient circuit. Nature. 2010;468:959–963. doi: 10.1038/nature09560. [DOI] [PMC free article] [PubMed] [Google Scholar]
- 43.Borneman AR, et al. Target hub proteins serve as master regulators of development in yeast. Genes Dev. 2006;20:435–448. doi: 10.1101/gad.1389306. [DOI] [PMC free article] [PubMed] [Google Scholar]
- 44.Langmead B, Salzberg SL. Fast gapped-read alignment with Bowtie 2. Nat Methods. 2012;9:357–359. doi: 10.1038/nmeth.1923. [DOI] [PMC free article] [PubMed] [Google Scholar]
- 45.Li H, et al. The Sequence Alignment/Map format and SAMtools. Bioinformatics. 2009;25:2078–2079. doi: 10.1093/bioinformatics/btp352. [DOI] [PMC free article] [PubMed] [Google Scholar]
- 46.Zhang Y, et al. Model-based analysis of ChIP-Seq (MACS) Genome Biol. 2008;9:R137. doi: 10.1186/gb-2008-9-9-r137. [DOI] [PMC free article] [PubMed] [Google Scholar]
- 47.Homann OR, Johnson AD. MochiView: versatile software for genome browsing and DNA motif analysis. BMC Biol. 2010;8:49. doi: 10.1186/1741-7007-8-49. [DOI] [PMC free article] [PubMed] [Google Scholar]
- 48.Edgar RC. MUSCLE: multiple sequence alignment with high accuracy and high throughput. Nucleic Acids Res. 2004;32:1792–1797. doi: 10.1093/nar/gkh340. [DOI] [PMC free article] [PubMed] [Google Scholar]
- 49.Posada D, Crandall KA. Selecting models of nucleotide substitution: an application to human immunodeficiency virus 1 (HIV-1) Mol Biol Evol. 2001;18:897–906. doi: 10.1093/oxfordjournals.molbev.a003890. [DOI] [PubMed] [Google Scholar]