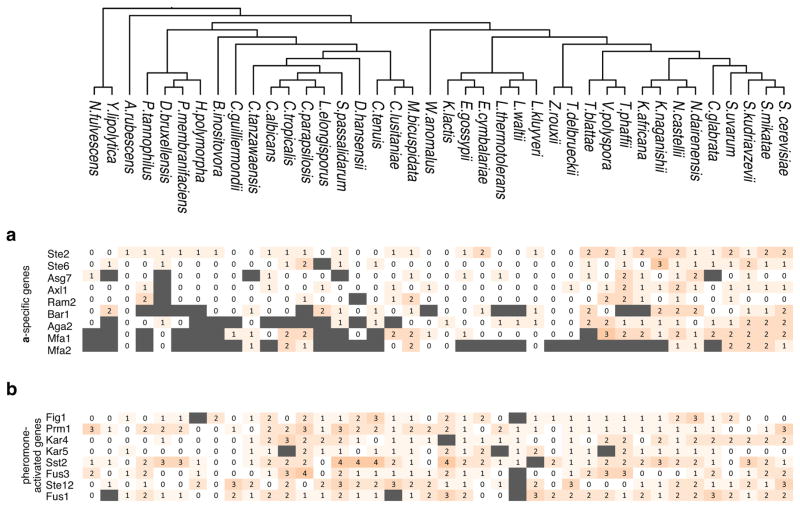
Extended Data Figure 2. Distribution of Ste12 cis-regulatory sites.
Individual a-specific genes and general pheromone-activated genes were scored for the presence of Ste12 cis-regulatory motifs in their upstream regulatory regions. Shown is the number of consensus Ste12 sites within 600bp of the translation start site. Orthologs that could not be identified in a given species are shown in gray. The enrichment for the Ste12 motif in each set of genes in each species is shown in Figure 1c.

