

Article first published online 28 August 2014.
Supplemental Digital Content is Available in the Text.
Key Words: microarray, methylation, colon, inflammatory bowel disease
Background:
Mucosal abnormalities are potentially important in the primary pathogenesis of ulcerative colitis (UC). We investigated the mucosal transcriptomic expression profiles of biopsies from patients with UC and healthy controls, taken from macroscopically noninflamed tissue from the terminal ileum and 3 colonic locations with the objective of identifying abnormal molecules that might be involved in disease development.
Methods:
Whole-genome transcriptional analysis was performed on intestinal biopsies taken from 24 patients with UC, 26 healthy controls, and 14 patients with Crohn's disease. Differential gene expression analysis was performed at each tissue location separately, and results were then meta-analyzed. Significantly, differentially expressed genes were validated using quantitative polymerase chain reaction. The location of gene expression within the colon was determined using immunohistochemistry, subcellular fractionation, electron and confocal microscopy. DNA methylation was quantified by pyrosequencing.
Results:
Only 4 probes were abnormally expressed throughout the colon in patients with UC with Bone morphogenetic protein/Retinoic acid Inducible Neural-specific 3 (BRINP3) being the most significantly underexpressed. Attenuated expression of BRINP3 in UC was independent of current inflammation, unrelated to phenotype or treatment, and remained low at rebiopsy an average of 22 months later. BRINP3 is localized to the brush border of the colonic epithelium and expression is influenced by DNA methylation within its promoter.
Conclusions:
Genome-wide expression analysis of noninflamed mucosal biopsies from patients with UC identified BRINP3 as significantly underexpressed throughout the colon in a large subset of patients with UC. Low levels of this gene could predispose or contribute to the maintenance of the characteristic mucosal inflammation seen in this condition.
Ulcerative colitis (UC) is a chronic, relapsing, inflammatory bowel disease (IBD) in which inflammation is largely confined to the colonic mucosa. The disease affects approximately 1 in 1000 of the population.1 The pathogenesis of UC is complex and is classically thought to involve an abnormal interaction between the microbial flora, mucosal epithelial barrier, and the host immune system in susceptible individuals.2
UC starts in the rectum and extends proximally in a uniform manner resulting in the 3 major phenotype classifications of proctitis, left-sided, or pancolitis.3 Twenty percent to 54% of patients develop a more extensive phenotype over the course of their disease.4,5 Primary defects of the mucosa have been postulated as being important in the etiology of the disease, with reports of abnormalities of mucosal epithelial cell proliferation,6–8 increased intestinal epithelial permeability,9 tight junction weakness,10–12 aberrant mucin production13 and dysfunctional epithelial cell metabolism.14
The study of twins with UC has demonstrated an elevated concordance of 15.4% in monozygotic twins as compared with 3.9% in dizygotic twins, indicative of a present but weak genetic contribution to the etiology of the disease.15 Of note, this was less pronounced than that seen in Crohn's disease (CD), the other major form of IBD. The discrepancy in concordance between monozygotic and dizygotic twins highlights that environmental factors, potentially mediated by epigenetics, are likely to be important in the etiology of the disease.16 Genome-wide association studies have identified a large number of loci associated with UC. A large meta-analysis of 15 independent such studies identified 133 loci associated with UC, of which 110 were shared with CD.17 Several of the 23 loci uniquely associated with UC contain genes involved in the maintenance of mucosal epithelial integrity.18–20 However, the total disease variance explained by these loci is only 7.5%.17
The transcriptomic analysis of the mucosa from patients with UC has the potential to identify abnormally expressed genes that could (1) be due to germline variation, (2) be secondary to environmental factors, or (3) be a consequence of the pathogeneic process itself. Gene expression alterations resulting from any of these could be informative for understanding the etiopathogenesis of the disease. In addition, transcriptomic data can be used to develop diagnostic or prognostic signatures.21,22 Numerous studies have therefore been conducted in UC using both mucosal biopsies and surgical resection specimens.21–29 In the vast majority of these studies, the samples were obtained from chronically inflamed tissue such that transcriptomic differences observed have been dominated by the consequences of tissue damage and the presence of infiltrating inflammatory cells.21,24,26,27 A recent meta-analysis of a number of these studies23 identified the tight junction molecule, claudin 8 (CLDN8), to be the most underexpressed gene in the colon in individuals with IBD. CLDN8 is a “barrier” tight junction molecule located in the apical part of the paracellular junction,30 and thought to play a role in preventing paracellular back leakage of sodium.31 In inflamed mucosa, levels of CLDN8 are greatly reduced within the colon both in UC and CD.23,32 In contrast “pore forming” claudins such as CLDN2 and barrier tight junction molecule CLDN1 have been shown to be upregulated during inflammation,11,32–34 possibly to compensate for changes in CLDN8 expression, altering the physical properties of the epithelial barrier. The precise reasons for these changes remain unclear. In this study, we have conducted an analysis of the transcriptome of macroscopically noninflamed mucosa from patients with UC in clinical remission, and from CD and healthy controls (HC), in an attempt to identify genes which could be causally related to the development of the disease.
MATERIALS AND METHODS
Patients and Controls
Twenty-four patients with histologically confirmed UC, 14 individuals with CD, and 26 non-IBD controls (HC) undergoing routine colonoscopy at University College London Hospital (UCLH) between the ages of 18 and 75 years were included in the study (see Table, Supplemental Digital Content 1, http://links.lww.com/IBD/A585). HC were attending for endoscopic investigation of gastrointestinal symptoms; all had macroscopically normal colonoscopies and histologically normal biopsies. No patients were on corticosteroids or biological treatments, and most were on no treatment or 5-aminosalicylates alone. At the time of collection, all patients had clinically quiescent disease with a partial Mayo activity score35 of 2 or less (UC) or a Harvey–Bradshaw score of less than 3 (CD).36 Repeated biopsies were taken from 5 patients with UC and 4 new HC at a later time point (median, 22 months; range, 21–23 months) for expression and methylation studies. Rectal biopsies were also obtained from an independent cohort of 5 patients with UC and 16 HC subjects. Written informed consent was obtained from all patients. Ethical approval for this study was obtained from the Joint UCL/UCLH Committees on the Ethics of Human Research (project number 02/0324).
Tissue Collection
Paired endoscopic pinch biopsies (Radial Jaw 4 2.8 mm Single-Use Biopsy Forceps; Boston Scientific Corporation, Marlborough, MA) were obtained from macroscopically normal mucosa of the terminal ileum, ascending colon, descending colon, and rectum. Where possible samples were taken from all 4 locations in each subject (Fig., Supplemental Digital Content 2, http://links.lww.com/IBD/A574). One biopsy was placed in RNAlater stabilization reagent (Qiagen, Hilden, Germany) and stored at −80°C for messenger RNA (mRNA) preparation, and the other was placed in 4% formaldehyde for histological evaluation.
Blood samples were taken from all study participants at the time of endoscopy for the assessment of systemic inflammatory status37 and to obtain a sample of genomic DNA from blood leukocytes. Paraffin-embedded colonic and terminal ileum resection tissue from non-IBD controls and stored within the UCLH histological tissue repository was used for immunohistochemistry. Fresh surgical samples from a normal ascending colon were obtained from the Department of Surgery at UCLH and used for the immunogold labeling.
Histological Grading
All biopsies were graded histologically for microscopic inflammation using a previously described linear histological grading method by specialist histopathologists who were blinded to the disease status of the participants (see Table, Supplemental Digital Content 3, http://links.lww.com/IBD/A586).38 The combined (acute and chronic) inflammation score, including Paneth cell metaplasia, ranged from 0 to 23.39 All surgical resection tissue used in this study were graded to be histologically normal.
RNA Extraction
Biopsies (∼25 mg) were lysed in 300-μL RNeasy Fibrous Tissue kit (Qiagen) RLT buffer and 0.14 M β-mercaptoethanol (β-ME) (Sigma-Aldrich, St Louis, MO) and then homogenized by centrifugation at 10,000g through a Qiashredder column (Qiagen). Protein was removed by incubation for 10 minutes at 55°C with 10 μL Proteinase K (20 mg/mL) (>600 mAU/mL) (Qiagen). Total RNA was extracted on RNeasy Mini spin columns and DNA was removed with RNase free DNase digestion (Qiagen). Samples were taken forward for microarray analysis if they had an optical density ratio of 1.8 to 2.0 OD260/OD280 and >1.8 OD260/OD230 as well as an RNA concentration of greater than 50 ng/μL.
Microarray Analysis
For each biopsy sample, 500 ng of total RNA was amplified and purified using the Illumina TotalPrep-96 RNA amplification kit (Ambion; Life Technologies, Carlsbad, CA).
Seven hundred fifty nanogram of biotin-labeled complementary RNA (150 ng/μL) was hybridized to Illumina HumanHT-12v4 Expression BeadChips (Illumina, San Diego, CA) for 16 hours at 58°C. After hybridization, BeadChips were washed and stained with streptavidin-Cy3 (GE Healthcare, Little Chalfont, United Kingdom), scanned using the BeadArray reader (Illumina), and processed using Illumina Genome Studio software.
Quantitative Polymerase Chain Reaction
RNA (1 μg) was converted to complementary DNA using oligo d(T) primers and reverse transcription using the Promega reverse transcription kit (Qiagen). Real time quantitative polymerase chain reaction (qPCR) was performed using SensiMix NoRef DNA kit (Bioline Reagents, London, Little Chalfont, United Kingdom), using peptidylprolyl isomerase A (PPIA) (Bioline Reagents) as an endogenous control. Primers for qPCR and pyrosequencing are listed in Table, Supplemental Digital Content 4, http://links.lww.com/IBD/A587.
All samples and standards were run in triplicate. The relative expression of genes of interest in patients with UC was compared with HC using the comparative Ct (ΔΔ Ct) method.40
Subcellular Localization of BRINP3
Immunohistochemistry, Western blotting, subcellular fractionation, immunogold labeling, and confocal microscopy were used to establish the subcellular location of BRINP3. Details of the full methodology are documented in Methods section, Supplemental Digital Content 5, http://links.lww.com/IBD/A594.
DNA Methylation and Pyrosequencing
Endoscopic pinch biopsies from 5 patients with UC and 4 HC were stored in RNAlater stabilization reagent (Qiagen) at −80°C. DNA was extracted from intestinal biopsies and blood leukocytes using the DNeasy Blood and Tissue kit (Qiagen) with 500 ng DNA bisulfite converted using the EZ-96 DNA Methylation Kit (Deep Well Format) (Zymo Research, Irvine, CA). Sequencing and PCR primers were designed using the PyroMark Assay Design Software 2.0 (Qiagen/Biotage, Uppsala, Sweden) (see Table, Supplemental Digital Content 4, http://links.lww.com/IBD/A587). Bisulfite-modified DNA was amplified by PCR using these primers with GoTaq Hot Start Polymerase and reagents (Promega, Madison, WI) and dNTP Mix (Eurogentec, Hampshire, United Kingdom) in a 50-μL reaction volume. A 30 μL aliquot of the PCR product was transferred to a PSQ HS 96 plate (Qiagen/Biotage), and pyrosequencing was performed following the manufacturer's protocol using a PyroMark Q96 Vacuum Prep Workstation and a PyroMark (Qiagen/Biotage) Q96 MD System. DNA methylation levels were quantified using Pyro Q-CpG Software (Qiagen/Biotage). Percentage methylation was analyzed using GraphPad Prism 4 for Windows (GraphPad Software Inc., La Jolla, CA).
Data Analysis
Expression data for Illumina HumanHT-12v4 BeadChips was normalized after Log2 transformation within Illumina Genome Studio using cubic spline normalization with background subtraction41 and analyzed using the LUMI and LIMMA packages in R programming language (Bioconductor).42,43 Probes that reached a minimum detection P-value of <0.01 in at least 2 biopsies in any location were included in the subsequent analyses (n = 26,261 probes). Microarray expression data for the verification cohort of rectal biopsies was generated using the Illumina WG6v3 beadarrays and were processed as above (n = 14,976 probes). Data were normalized for batch effects using ComBat normalization44 for each tissue location separately.
Differential expression analysis between groups was performed at each intestinal location using LIMMA software (Bioconductor).42,43 The P-value was adjusted for multiple testing as described by Benjamini and Hochberg45; with a corrected P-value threshold for significance of 0.05. The differential gene expression results from each location were meta-analyzed using Fisher's method with Brown's extension for nonindependence.46,47 GraphPad Prism 4 for Windows (GraphPad Software Inc.) was used for the analysis of qPCR and DNA methylation data and for correlation analyses. For group comparisons, an unpaired Student's t test was used to assess statistical significance (P < 0.05) in each circumstance. The data from Gene Expression Omnibus (GEO)48 datasets GSE38713,29 GSE22619 (samples GSM560961-GSM560976),49 and GSE2789949 were used as verification and comparison cohorts. Gene-annotation enrichment analysis was performed using DAVID (Database for Annotation, Visualization, and Integrated Discovery) v6.7 Functional Annotation Bioinformatic Software for Microarray Analysis (NIAID; Bethesda, MD).50 In cases of group sizes of 5 or fewer observations per group, P-values should be interpreted with caution.
RESULTS
Histological and Biochemical Assessment of Inflammatory Status
Histological assessment revealed that 11 of 20 rectal, 12 of 20 descending colon, 3 of 16 ascending colon, and 2 of 12 terminal ileal biopsies from patients with UC demonstrated microscopic inflammation (a combined inflammation score of 1 or more) with a median inflammation score of 3 across all locations (see Table, Supplemental Digital Content 6, http://links.lww.com/IBD/A588). No histological inflammation was observed in the HC cohort. For future analyses, “inflamed UC” biopsies were designated as those with a combined inflammation score of 1 or more and non-inflamed UC biopsies with an inflammation score of 0. Assessment of systemic markers of disease activity confirmed the quiescent status of all patients with UC (Fig., Supplemental Digital Content 7, http://links.lww.com/IBD/A575).
Comparisons of Gene Expression in Noninflamed UC and HC
In an attempt to identify genes that are associated with a primary abnormality within the colonic mucosa in UC, we compared noninflamed UC with HC biopsies from the rectum, descending, and ascending colon. When the results from each location were analyzed independently, no differentially significant expression differences were observed. Meta-analysis of the differential results from each colonic location identified 4 probes (corresponding to 3 genes) that were significantly differentially expressed throughout the colon (Table 1; see Table, Supplemental Digital Content 8, http://links.lww.com/IBD/A589). Of these, only 2 probes, both mapping to the gene family with sequence similarity member 5C (FAM5C) recently renamed BRINP3, were underexpressed. The overexpressed probes were AKR1C2, Aldo–Keto Reductase family 1 member C2, and the transcriptional regulator PITX1.
TABLE 1.
Comparisons of Gene Expression in Noninflamed UC and HC
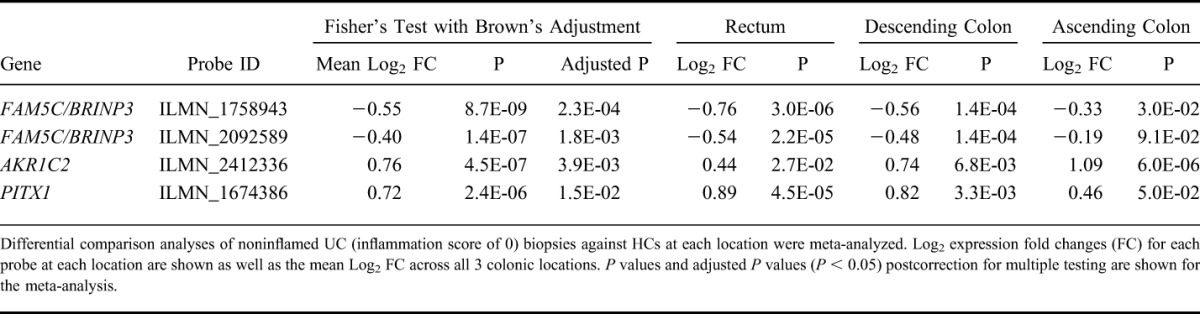
The 2 BRINP3 probes were highly correlated across our entire dataset (r2 = 0.906, P < 0.001) (Fig., Supplemental Digital Content 9, http://links.lww.com/IBD/A576), and all subsequent analysis was performed with 1 probe (ILMN_1758943).
Transcriptomic Analysis of Microscopically Inflamed Mucosa
To identify the genes associated with inflammation in the UC mucosa, we compared gene expression in microscopically inflamed biopsies with HC in the rectum (see Table, Supplemental Digital Content 10, http://links.lww.com/IBD/A590). There were 460 probes (416 genes) significantly differentially expressed of which 220 probes (195 genes) were overexpressed, e.g., the defensins genes (DEFA5 and DEFA6, Defensin Alpha 5 and 6) and 240 probes (221 genes) were underexpressed including the tight junction molecule, CLDN8. The same analysis was also performed on the descending colonic samples with similar findings (data not shown) and validated using qPCR for both DEFA5 and S100A8 (Fig., Supplemental Digital Content 11, http://links.lww.com/IBD/A577). Unsurprisingly, gene-annotation enrichment analysis on these differentially expressed genes demonstrated significant overrepresentation of biological processes associated with inflammatory and defense responses to bacteria and wounding. Underexpressed biological processes related to the generation of precursor metabolites, respiration, and electron transport (see Table, Supplemental Digital Content 12, http://links.lww.com/IBD/A591).
Relationship Between BRINP3 Expression and Bowel Location
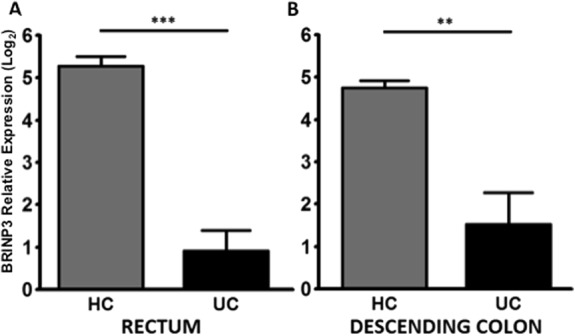
Given that BRINP3 was the most significantly abnormally expressed gene, subsequent analyses focused on this gene. BRINP3 expression was the highest in the terminal ileum and decreased proximally (Fig. 1A). When compared with the HC cohort and patients with CD, expression levels in all UC samples, irrespective of inflammation status, were normal in the terminal ileum but significantly lower in all 3 locations in the colon (Fig. 1A). qPCR verified the reduced BRINP3 levels in the descending colon of patients with UC (Fig. 1B). Patients with UC with reduced BRINP3 mRNA expression also demonstrated approximately 70% lower levels of protein within the descending colonic biopsies compared with HC (Fig. 1C, D). BRINP3 protein levels were determined in the descending colon due to the relatively high level of expression at this location and the availability of biopsies from individuals who were shown to express low BRINP3 mRNA on the microarrays. Independent replication of the reduced expression of BRINP3 in UC was provided by the second smaller cohort of UC patients (n = 5) and HC (n = 16) (see Table, Supplemental Digital Content 13, http://links.lww.com/IBD/A592) (P = 0.0131) (Fig. 1E). Additional evidence of a reduced expression of BRINP3 associated with UC was provided by 2 recent microarray studies on the intestinal mucosal biopsies obtained from patients with UC and unaffected controls (Fig., Supplemental Digital Content 14, http://links.lww.com/IBD/A578).29,49 Both studies support our finding of reduced BRINP3 expression in the colons of individuals with UC.
FIGURE 1.
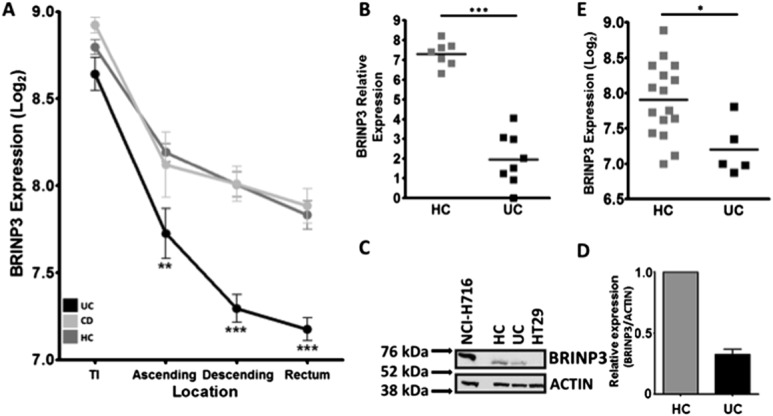
Relationship between BRINP3 expression, disease, and bowel location. A, Log2 mean expression (±SEM) of BRINP3 in all locations in UC, HC, and CD in the terminal ileum (TI) (UC = 12, CD = 5, HC = 13), ascending colon (UC = 16, CD = 7, HC = 13), descending colon (UC = 20, CD = 9, HC = 17), and rectum (UC = 20, CD = 13, HC = 26). B, qPCR verification of low BRINP3 in the descending colon in patients with UC (n = 8) identified as having low expression in the initial dataset and HCs (n = 7). C, Protein level of BRINP3 in biopsies taken from the descending colon from patients with UC with low mRNA expression was determined by Western blotting and compared against HC. BRINP3-positive (NCI-H716) and BRINP3-negative (HT29) colonic epithelial cell lines were used as controls. D, Relative BRINP3 protein levels (using relative luminescence BRINP3/ACTIN) within the descending colon of the patients with UC (n = 3) was compared with HC (n = 2). E, Verification of low BRINP3 in patients with UC in the rectum (P = 0.013) of the second cohort of patients with UC (n = 5) and HCs (n = 16). *P < 0.05; **P < 0.01; ***P < 0.001.
BRINP3 Expression and Relationship to Ongoing Inflammation
BRINP3 expression in UC was unrelated to the presence or absence of microscopic inflammation (Fig. 2A–D). Rectal biopsies from the 3 lowest expressers of BRINP3 were shown to be devoid of any signs of inflammation (Fig. 2E (1, 2, 3)). Similar results were also obtained from the other tissue locations (data not shown). BRINP3 expression in the descending colon was not correlated with previously identified markers of colonic inflammation (upregulated genes IL-8, S100A8, DEFA5 and downregulated CLDN8) (Fig., Supplemental Digital Content 15, http://links.lww.com/IBD/A579). A lack of correlation between BRINP3 and inflammatory markers was also evident in the rectum and ascending colonic biopsies (data not shown). In agreement with previous reports, the loss in CLDN8 expression seen in our cohort was strongly associated with the presence of microscopic inflammation (Fig., Supplemental Digital Content 16, http://links.lww.com/IBD/A580).
FIGURE 2.
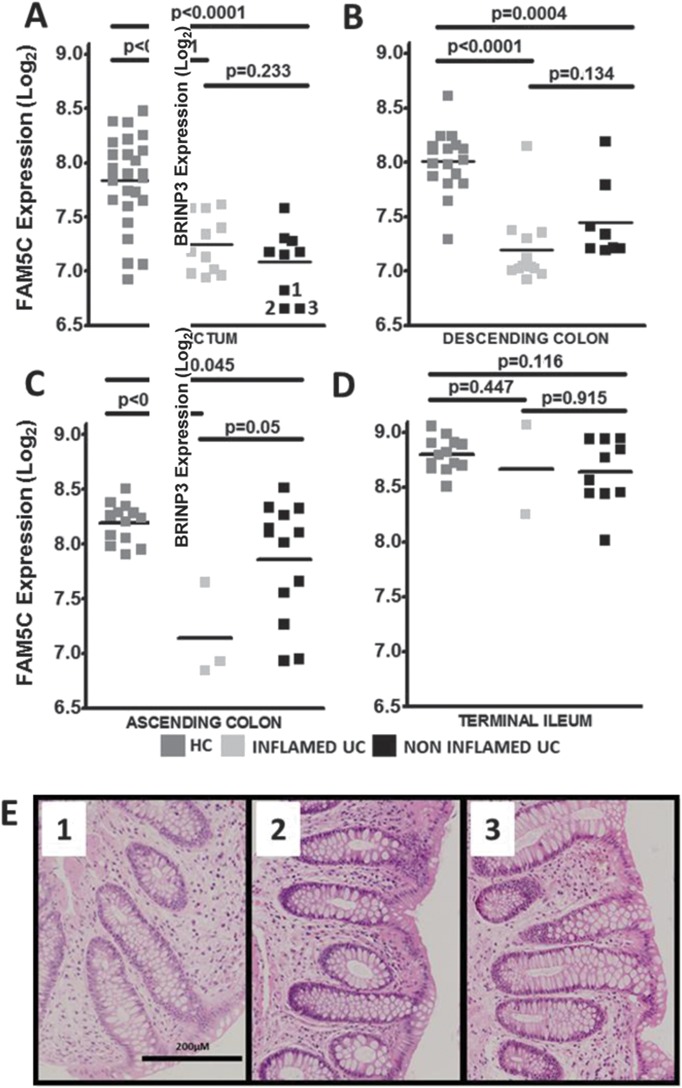
BRINP3 expression and relationship to ongoing inflammation. Dot plots of BRINP3 Log2 expression in HCs, noninflamed UC (NIUC, inflammation score = 0), inflamed UC (IUC, inflammation score ≥1) in: (A) rectum (NIUC = 9, IUC = 11, HC = 26), (B) descending colon (NIUC = 8, IUC = 12, HC = 17), (C) ascending colon (NIUC = 3, IUC = 13, HC = 13), and (D) terminal ileum (NIUC = 10, IUC = 2, HC = 13), separated according to their histological status. E, In the rectum, the UC biopsies with the lowest expression of BRINP3 in the colon, graded as being noninflamed, are highlighted (1–3), with their respective histological images.
BRINP3 Association with Disease Phenotype and Treatment
To assess whether low BRINP3 expression was associated with a particular disease phenotype, biopsies obtained from the ascending colon of patients with UC with either pancolitis or left-sided colitis were compared (Fig. 3). Individuals with left-sided disease were defined as those having no historical evidence of inflammation in the ascending colon. Therefore, alterations in BRINP3 expression at this location in these individuals would suggest that reduced expression is not associated with previous inflammation and support the hypothesis that low BRINP3 may predispose to disease onset. Although the overall expression levels compared with HC were lower in individuals with a history of pancolitis (P < 0.0008) as opposed to patients with left-sided disease (P = 0.183) (Fig. 3), BRINP3 levels were not consistent with phenotype as normal expression was observed in 30% of patients with pancolitis and low in 2 out of 7 individuals with left-sided colitis. To address the possible effects of treatment on BRINP3 expression, patients were separated into subgroups according to their medication at the time biopsies were taken. There was no difference between expression of BRINP3 with treatment (Fig., Supplemental Digital Content 8, http://links.lww.com/IBD/A581) in the rectum or at any other location (data not shown).
FIGURE 3.
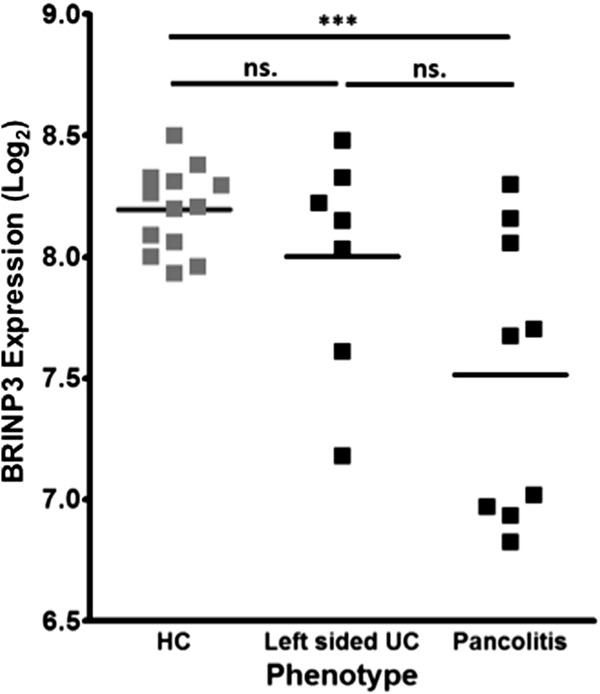
BRINP3 expression relationship to UC phenotype. Dot plot of BRINP3 Log2 expression in the ascending colon in HCs (n = 13) and in patients with UC (n = 16) divided according to phenotype using the Montreal classification (E3, pancolitis = 9; E2, left-sided colitis = 7).3 ***P < 0.001; ns, nonsignificant.
Longitudinal Studies into BRINP3 Expression
To ascertain whether low expression levels of BRINP3 in UC were stable over time, patients with attenuated expression were rebiopsied after a period of 21 to 23 months (see Table, Supplemental Digital Content 17, http://links.lww.com/IBD/A593). The expression of BRINP3 in these individuals remained low in comparison with control individuals in both the rectum (P = 0.0001) and the descending colon (P = 0.0072) in all patients rebiopsied (Fig. 4A, B). These patients had all remained in clinical remission over the intervening time period (see Table, Supplemental Digital Content 17, http://links.lww.com/IBD/A593).
FIGURE 4.
Longitudinal studies into BRINP3 expression. Low expression of BRINP3 in patients with previously documented low BRINP3 expression was verified by qPCR using repeat biopsies taken from the: (A) rectum, UC (n = 5) and HCs (n = 4); (B) descending colon, UC (n = 5) and HCs (n = 4). Results expressed as mean ± SEM. **P < 0.01; ***P < 0.001.
Cellular Localization of BRINP3 in the Lower Gastrointestinal Tract
Immunohistochemistry was performed on resected ileal and colonic tissue from subjects without IBD and with normal histology. BRINP3 was observed to be located in the brush border region of ileal and colonic epithelial cells (Fig. 5A). Electron microscopy immunogold staining localized BRINP3 to the region of the brush border microvilli just under the luminal plasma membrane of human colonic epithelial cells (Fig. 5B). Minimal staining was seen elsewhere.
FIGURE 5.
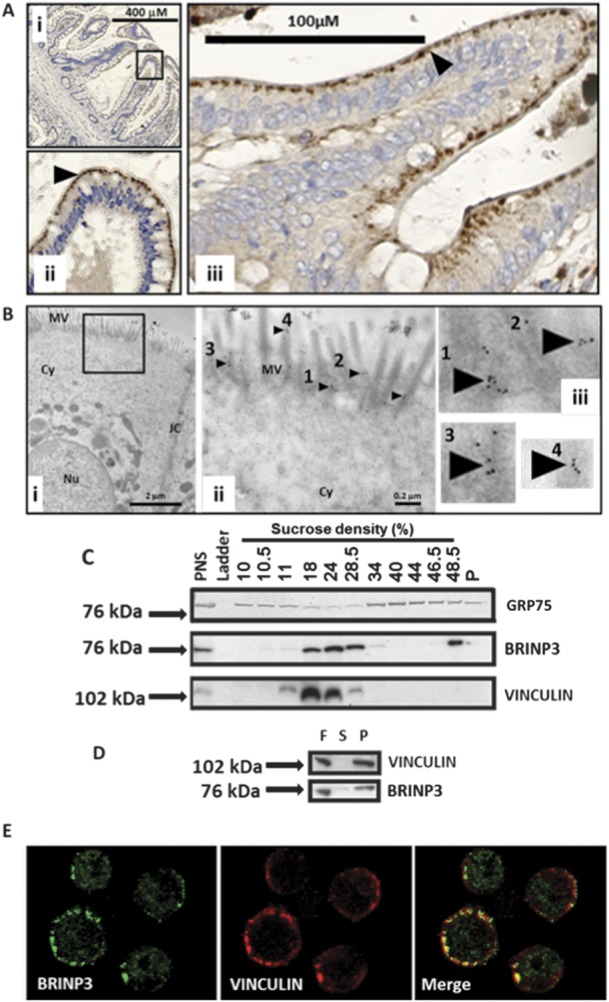
Cellular localization of BRINP3 in the lower gastrointestinal tract. A, Immunohistochemistry of BRINP3 performed on resection specimens from HC in the terminal ileum (i and ii) and colonic mucosa (iii) (black arrows denote BRINP3 expression). B, Electron micrographs of the brush border epithelium in a human colonic epithelial cell using anti-BRINP3 and immunogold secondary antibodies (i and iii). B (ii and iii), immunogold staining of the microvilli shown in (i) (black box) at higher magnification (black arrows and numbered 1–4). MV, microvilli; Cy, cytoplasm; JC, epithelial cell junctional complex; Nu, nucleus. C, Subcellular fractionation of the NCI-H716 adenocarcinoma epithelial cell line followed by Western blotting with anti-BRINP3, anti-GRP75 (a mitochondrial protein), and anti-vinculin (an epithelial cytoskeletal protein). PNS, postnuclear supernatant. D, Separation of the soluble (S, supernatant) and insoluble (P, pellet) material in the 24% sucrose fraction (F) by ultracentrifugation, followed by Western blotting of BRINP3 and vinculin. E, confocal microscopy of the NCI-H716 epithelial cell line stained with BRINP3 and vinculin.
The NCI-H716 cell line, a human colorectal adenocarcinoma found to have the highest level of expression of BRINP3 in the Cancer Cell Line Encyclopaedia (GEO dataset GSE36133),51 was used for cell biology experiments. After fractionation of the cells on continuous sucrose gradients, the protein was identified in the fractions by Western blotting. It was mainly found in the region of the gradient normally occupied by the light membrane fraction52 (Fig. 5C). The mitochondrial marker GRP75 showed minimal overlap with BRINP3 (Fig. 5C). Confocal microscopy confirmed the lack of association between BRINP3 staining and mitochondria identified with an antibody to GRP75 (Fig., Supplemental Digital Content 18, http://links.lww.com/IBD/A582). It was possible that BRINP3 migrated from the cytosol into the denser fractions as part of a macromolecular complex, and evidence for this was its colocation with vinculin, a component of the actin cytoskeleton. To distinguish this from a membrane location, we subjected a BRINP3-positive fraction to an additional centrifugation step in which membranes would not sediment at their buoyant density and would remain in suspension, whereas macromolecular protein complexes would sediment into the pellet. BRINP3 and vinculin were found almost exclusively in the pellet, indicative of their association with large protein complexes (Fig. 5D). Confocal microscopy of NCI-H716 cells demonstrated colocalization of BRINP3 and vinculin just under the plasma membrane, providing additional evidence of a direct association with the cytoskeleton (Fig. 5E).
Methylation of the BRINP3 Promoter in the Distal Colon
Previous genome-wide association studies have revealed no significant association between the BRINP3 locus and UC (Fig., Supplemental Digital Content 19, http://links.lww.com/IBD/A583).53,54 A recent microarray study on the intestinal mucosa of monozygotic twins discordant for UC demonstrated that BRINP3 expression was significantly reduced in the affected as compared with the unaffected twin (Fig., Supplemental Digital Content 14, http://links.lww.com/IBD/A578).49 These findings suggest that alterations in BRINP3 expression may not be attributable to germline variation and could result from epigenetic modifications. DNA methylation is a major regulator of gene expression and has been previously shown to be abnormal in patients with UC.20,49,55 BRINP3 contains a CpG rich sequence (“CpG island”) (chr1: 190446552–190447574) in the promoter region (Fig., Supplemental Digital Content 19, http://links.lww.com/IBD/A583). The methylation status of the BRINP3 promoter region was determined in the rectal mucosa of BRINP3 low UC patients (n=5) and HC (n = 4) as well as in circulating leukocytes from the same individuals (Fig. 6). BRINP3 expression was also quantitated by qPCR in the same rectal biopsy specimens. Patients with UC expressing BRINP3 at low levels in the rectum (Fig. 6A) had significantly increased methylation in the promoter region (P < 0.01) (Fig. 6B). There was an inverse relationship between BRINP3 expression and methylation (r2 = 0.6991, P = 0.005) (Fig., Supplemental Digital Content 20, http://links.lww.com/IBD/A584). There was no significant increase in the extent of BRINP3 promoter methylation in the circulating leukocyte population in patients with UC indicating a possible tissue-specific modification (Fig. 5B).
FIGURE 6.
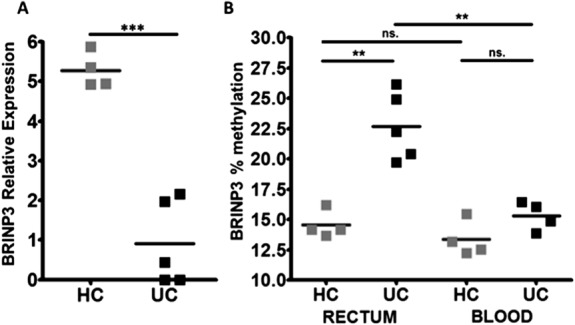
Methylation of the BRINP3 promoter in the distal colon. A, quantification of BRINP3 Log2 relative expression in the rectum in rebiopsied patients with UC (n = 5) and additional HC (n = 4) by qPCR. B, Percentage (%) methylation status of the BRINP3 promoter in UC (n = 5) and HC (n = 4) rectal biopsies and in circulating leukocytes in the same patients with UC (n = 4) and HC (n = 4). ***P < 0.001; **P < 0.01; ns, nonsignificant.
DISCUSSION
The pathology of UC, such as its superficial nature, is in keeping with a primary abnormality of the mucosa. Numerous studies have reported defects in mucosal integrity, epithelial turnover, and mucin production.7,9,12,13 To identify molecular abnormalities that might be responsible for these mucosal defects, we compared macroscopically normal colonic mucosal tissue from patients with UC in remission with HC individuals. Although the mucosa appeared macroscopically normal in all cases, approximately 30% of the biopsies had evidence of microscopic inflammation; a previously recognized phenomenon.56,57 Through a transcriptome-wide approach using biopsies with no evidence of microscopic inflammation, we identified 3 genes which were differentially expressed throughout the entire colon. Of these, the only one that was underexpressed was BRINP3, which was also the most significantly different gene from HCs.
Analysis of the microscopically inflamed samples identified 460 probes which strongly overlapped with the findings of from previous microarray studies into UC.21,23,26,27 The genes which demonstrated the largest alteration in expression were associated with epithelial integrity such as CLDN8 and Paneth cell metaplasia (DEFA5, DEFA6, and REG1). The majority of genes reported to be associated with UC in previous studies are attributable to chronic inflammation and leukocyte infiltration into the mucosal tissue such as the SAA1 (serum amyloid A1), chemokine (C-X-C motif) ligands (CXCL6, CXCL11, CXCL13), and the matrix metallopeptidases (MMP1, MMP3, MMP12).23,26 These genes were not found to be significantly abnormal in the noninflamed samples in our study. These results demonstrate a strong correlation between the histological appearance of microscopic inflammation and inflammatory markers, indicating that a suitable collection of appropriate markers on molecular arrays could provide a rapid and cost-effective alternative to histological examination.
Low levels of BRINP3 expression were replicated in a previous microarray study of biopsies taken from quiescent patients with UC.29 This suggests that low BRINP3 may identify a subgroup of patients within the general UC cohort and supports the previously reported heterogeneous genetic character of this disease.53
Abnormal BRINP3 expression is specific for colonic mucosal tissue in UC and not a generic response to inflammation or therapy. Tissue-specific hypermethylation of the BRINP3 promoter may be responsible for the reduced expression. Previous studies have demonstrated a role for epigenetic modification and hypermethylation in UC and UC-associated colorectal carcinoma, but none of these studies have reported results for BRINP3.16,20,58 Hypermethylation of the BRINP3 promoter in individuals with gastric cancer has been proposed as a prewarning marker for its development.59 Recent epigenome-wide association studies have identified genes in which DNA methylation is associated with gene expression changes in patients with UC.49,55 Abnormalities in BRINP3 were not reported in these studies, although the presence of ongoing inflammation may have influenced the results. The discrepancies between the current findings and previous investigations are most likely due to the heterogenous nature of UC; our methylation studies were restricted to patients with confirmed low BRINP3 expression.
Very little is currently known about the function of the BRINP3 protein. The BRINP3 gene has been correlated with myocardial infarction60 and aggressive periodonitis61 in genetic studies. It has been postulated that it could play a role in osteoblast differentation.62 Other investigations conducted in pituitary adenoma cells, identified BRINP3 as a mitochondrial associated protein, and linked it to tumor proliferation, migration, and invasion.63 In contrast, in colonic tissue and a colonic epithelial cell line, BRINP3 appears to be associated with the cytoskeleton in the brush border membrane.
BRINP3 expression appears to be restricted to the microvilli and cytoskeletal region of the brush border in the epithelium. Impaired integrity of a cytoskeletal complex just under the plasma membrane interface with the bowel might be expected to predispose to an increased chance of membrane damage. It is therefore possible that reduced BRINP3 levels due to promoter hypermethylation predates the onset of disease and may be a susceptibility factor in its development.
Supplementary Material
ACKNOWLEDGMENTS
We would like to thank Prof. Ian Tomlinson (Nuffield Professor of Medicine, Nuffield Department of Medicine, Henry Wellcome Building for Molecular Physiology, University of Oxford) for providing the colonic epithelial adenocarcinoma cell line. We also thank Dr. Carol McDonald, Penelope Harrison, Bernadette Pederson, and Dr. Thean Soon Chew for helpful assistance. We would like to thank the Experimental Cancer Medicine Centre for support with our immunohistochemistry. We would like to thank the staff in the endoscopy and surgical department, Mr. Alec Engeldow, Dr. Sara McCartney and Dr. Farooq Rahman for the help in collecting resection and biopsy samples and the patients and controls who very kindly consented to be part of this study. Finally, we would like to thank the Wellcome Trust Microarray Facility, in particular Chris McGee and Ruben Bautista.
Author contributions: All authors approved the article before submission. P. J. Smith, A. M. Smith, A. P. Levine, and A. W. Segal wrote the article. P. J. Smith, A. P. Levine, G. W. Sewell, and A. M. Smith performed the statistical analysis. P. J. Smith, R. Vega, and N. O. Shea collected biopsy and blood samples and undertook patient phenotyping. S. L. Bloom and S. Beck provided clinical and scientific input, respectively. P. J. Smith, J. Dunne, and P. Guilhamon performed the experiments. M. Novelli and M. R-. Justo histologically graded the biopsies. J. C. Paterson and D. Oukrif performed the immunohistochemistry. M. Turmaine performed the electron microscopy. A. M. Smith and A. W. Segal provided the overall supervision for the project.
Footnotes
Supplemental digital content is available for this article. Direct URL citations appear in the printed text and are provided in the HTML and PDF versions of this article on the journal's Web site (www.ibdjournal.org).
Supported by the Medical Research Council, Wellcome Trust, and the Irwin Joffe Memorial Fellowship.
The authors have no conflicts of interest to disclose.
The data discussed in this publication have been deposited in NCBI's Gene Expression Omnibus and are accessible through GEO Series accession number GSE48634 (http://www.ncbi.nlm.nih.gov/geo/query/acc.cgi?acc=GSE48634).
REFERENCES
- 1.Cosnes J, Gower-Rousseau C, Seksik P, et al. Epidemiology and natural history of inflammatory bowel diseases. Gastroenterology. 2011;140:1785–1794. [DOI] [PubMed] [Google Scholar]
- 2.Xavier RJ, Podolsky DK. Unravelling the pathogenesis of inflammatory bowel disease. Nature. 2007;448:427–434. [DOI] [PubMed] [Google Scholar]
- 3.Satsangi J, Silverberg MS, Vermeire S, et al. The Montreal classification of inflammatory bowel disease: controversies, consensus, and implications. Gut. 2006;55:749–753. [DOI] [PMC free article] [PubMed] [Google Scholar]
- 4.Langholz E, Munkholm P, Davidsen M, et al. Changes in extent of ulcerative colitis: a study on the course and prognostic factors. Scand J Gastroenterol. 1996;31:260–266. [DOI] [PubMed] [Google Scholar]
- 5.Solberg IC, Lygren I, Jahnsen J, et al. Clinical course during the first 10 years of ulcerative colitis: results from a population-based inception cohort (IBSEN Study). Scand J Gastroenterol. 2009;44:431–440. [DOI] [PubMed] [Google Scholar]
- 6.Allan A, Bristol JB, Williamson RC. Crypt cell production rate in ulcerative proctocolitis: differential increments in remission and relapse. Gut. 1985;26:999–1003. [DOI] [PMC free article] [PubMed] [Google Scholar]
- 7.Eastwood GL, Trier JS. Epithelial cell renewal in cultured rectal biopsies in ulcerative colitis. Gastroenterology. 1973;64:383–390. [PubMed] [Google Scholar]
- 8.Serafini EP, Kirk AP, Chambers TJ. Rate and pattern of epithelial cell proliferation in ulcerative colitis. Gut. 1981;22:648–652. [DOI] [PMC free article] [PubMed] [Google Scholar]
- 9.Gibson PR, van de Pol E, Barratt PJ, et al. Ulcerative colitis—a disease characterised by the abnormal colonic epithelial cell? Gut. 1988;29:516–521. [DOI] [PMC free article] [PubMed] [Google Scholar]
- 10.Gitter AH, Wullstein F, Fromm M, et al. Epithelial barrier defects in ulcerative colitis: characterization and quantification by electrophysiological imaging. Gastroenterology. 2001;121:1320–1328. [DOI] [PubMed] [Google Scholar]
- 11.Oshima T, Miwa H, Joh T. Changes in the expression of claudins in active ulcerative colitis. J Gastroenterol Hepatol. 2008;23(suppl 2):S146–S150. [DOI] [PubMed] [Google Scholar]
- 12.Schmitz H, Barmeyer C, Fromm M, et al. Altered tight junction structure contributes to the impaired epithelial barrier function in ulcerative colitis. Gastroenterology. 1999;116:301–309. [DOI] [PubMed] [Google Scholar]
- 13.Van Klinken BJ, Van der Wal JW, Einerhand AW, et al. Sulphation and secretion of the predominant secretory human colonic mucin MUC2 in ulcerative colitis. Gut. 1999;44:387–393. [DOI] [PMC free article] [PubMed] [Google Scholar]
- 14.Dubuquoy L, Jansson EA, Deeb S, et al. Impaired expression of peroxisome proliferator-activated receptor gamma in ulcerative colitis. Gastroenterology. 2003;124:1265–1276. [DOI] [PubMed] [Google Scholar]
- 15.Brant SR. Update on the heritability of inflammatory bowel disease: the importance of twin studies. Inflamm Bowel Dis. 2011;17:1–5. [DOI] [PubMed] [Google Scholar]
- 16.Ventham NT, Kennedy NA, Nimmo ER, et al. Beyond gene discovery in inflammatory bowel disease: the emerging role of epigenetics. Gastroenterology. 2013;145:293–308. [DOI] [PMC free article] [PubMed] [Google Scholar]
- 17.Jostins L, Ripke S, Weersma RK, et al. Host-microbe interactions have shaped the genetic architecture of inflammatory bowel disease. Nature. 2012;491:119–124. [DOI] [PMC free article] [PubMed] [Google Scholar]
- 18.Karayiannakis AJ, Syrigos KN, Efstathiou J, et al. Expression of catenins and E-cadherin during epithelial restitution in inflammatory bowel disease. J Pathol. 1998;185:413–418. [DOI] [PubMed] [Google Scholar]
- 19.Schmehl K, Florian S, Jacobasch G, et al. Deficiency of epithelial basement membrane laminin in ulcerative colitis affected human colonic mucosa. Int J Colorectal Dis. 2000;15:39–48. [DOI] [PubMed] [Google Scholar]
- 20.Wheeler JM, Kim HC, Efstathiou JA, et al. Hypermethylation of the promoter region of the E-cadherin gene (CDH1) in sporadic and ulcerative colitis associated colorectal cancer. Gut. 2001;48:367–371. [DOI] [PMC free article] [PubMed] [Google Scholar]
- 21.Arijs I, Li K, Toedter G, et al. Mucosal gene signatures to predict response to infliximab in patients with ulcerative colitis. Gut. 2009;58:1612–1619. [DOI] [PubMed] [Google Scholar]
- 22.Olsen J, Gerds TA, Seidelin JB, et al. Diagnosis of ulcerative colitis before onset of inflammation by multivariate modeling of genome-wide gene expression data. Inflamm Bowel Dis. 2009;15:1032–1038. [DOI] [PubMed] [Google Scholar]
- 23.Clark PM, Dawany N, Dampier W, et al. Bioinformatics analysis reveals transcriptome and microRNA signatures and drug repositioning targets for IBD and other autoimmune diseases. Inflamm Bowel Dis. 2012;18:2315–2333. [DOI] [PubMed] [Google Scholar]
- 24.Dieckgraefe BK, Stenson WF, Korzenik JR, et al. Analysis of mucosal gene expression in inflammatory bowel disease by parallel oligonucleotide arrays. Physiol Genomics. 2000;4:1–11. [DOI] [PubMed] [Google Scholar]
- 25.Kim M, Lee S, Yang SK, et al. Differential expression in histologically normal crypts of ulcerative colitis suggests primary crypt disorder. Oncol Rep. 2006;16:663–670. [PubMed] [Google Scholar]
- 26.Noble CL, Abbas AR, Cornelius J, et al. Regional variation in gene expression in the healthy colon is dysregulated in ulcerative colitis. Gut. 2008;57:1398–1405. [DOI] [PubMed] [Google Scholar]
- 27.Toedter G, Li K, Marano C, et al. Gene expression profiling and response signatures associated with differential responses to infliximab treatment in ulcerative colitis. Am J Gastroenterol. 2011;106:1272–1280. [DOI] [PubMed] [Google Scholar]
- 28.Wu F, Dassopoulos T, Cope L, et al. Genome-wide gene expression differences in Crohn's disease and ulcerative colitis from endoscopic pinch biopsies: insights into distinctive pathogenesis. Inflamm Bowel Dis. 2007;13:807–821. [DOI] [PubMed] [Google Scholar]
- 29.Planell N, Lozano JJ, Mora-Buch R, et al. Transcriptional analysis of the intestinal mucosa of patients with ulcerative colitis in remission reveals lasting epithelial cell alterations. Gut. 2013;62:967–976. [DOI] [PubMed] [Google Scholar]
- 30.Amasheh S, Fromm M, Gunzel D. Claudins of intestine and nephron—a correlation of molecular tight junction structure and barrier function. Acta Physiol (Oxf). 2011;201:133–140. [DOI] [PubMed] [Google Scholar]
- 31.Amasheh S, Milatz S, Krug SM, et al. Na+ absorption defends from paracellular back-leakage by claudin-8 upregulation. Biochem Biophys Res Commun. 2009;378:45–50. [DOI] [PubMed] [Google Scholar]
- 32.Zeissig S, Burgel N, Gunzel D, et al. Changes in expression and distribution of claudin 2, 5 and 8 lead to discontinuous tight junctions and barrier dysfunction in active Crohn's disease. Gut. 2007;56:61–72. [DOI] [PMC free article] [PubMed] [Google Scholar]
- 33.Poritz LS, Harris LR, III, Kelly AA, et al. Increase in the tight junction protein claudin-1 in intestinal inflammation. Dig Dis Sci. 2011;56:2802–2809. [DOI] [PMC free article] [PubMed] [Google Scholar]
- 34.Rosenthal R, Milatz S, Krug SM, et al. Claudin-2, a component of the tight junction, forms a paracellular water channel. J Cell Sci. 2010;123:1913–1921. [DOI] [PubMed] [Google Scholar]
- 35.Lewis JD, Chuai S, Nessel L, et al. Use of the noninvasive components of the Mayo score to assess clinical response in ulcerative colitis. Inflamm Bowel Dis. 2008;14:1660–1666. [DOI] [PMC free article] [PubMed] [Google Scholar]
- 36.Harvey RF, Bradshaw MJ. Measuring Crohn's disease activity. Lancet. 1980;1:1134–1135. [DOI] [PubMed] [Google Scholar]
- 37.Mowat C, Cole A, Windsor A, et al. Guidelines for the management of inflammatory bowel disease in adults. Gut. 2011;60:571–607. [DOI] [PubMed] [Google Scholar]
- 38.Geboes K, Riddell R, Ost A, et al. A reproducible grading scale for histological assessment of inflammation in ulcerative colitis. Gut. 2000;47:404–409. [DOI] [PMC free article] [PubMed] [Google Scholar]
- 39.Tanaka M, Saito H, Kusumi T, et al. Spatial distribution and histogenesis of colorectal Paneth cell metaplasia in idiopathic inflammatory bowel disease. J Gastroenterol Hepatol. 2001;16:1353–1359. [DOI] [PubMed] [Google Scholar]
- 40.Livak KJ, Schmittgen TD. Analysis of relative gene expression data using real-time quantitative the PCR and 2(-Delta Delta C(T)) method. Methods. 2001;25:402–408. [DOI] [PubMed] [Google Scholar]
- 41.Bolstad BM, Irizarry RA, Astrand M, et al. A comparison of normalization methods for high density oligonucleotide array data based on variance and bias. Bioinformatics. 2003;19:185–193. [DOI] [PubMed] [Google Scholar]
- 42.Gentleman RC, Carey VJ, Bates DM, et al. Bioconductor: open software development for computational biology and bioinformatics. Genome Biol. 2004;5:R80. [DOI] [PMC free article] [PubMed] [Google Scholar]
- 43.Smyth GK, Michaud J, Scott HS. Use of within-array replicate spots for assessing differential expression in microarray experiments. Bioinformatics. 2005;21:2067–2075. [DOI] [PubMed] [Google Scholar]
- 44.Johnson WE, Li C, Rabinovic A. Adjusting batch effects in microarray expression data using empirical Bayes methods. Biostatistics. 2007;8:118–127. [DOI] [PubMed] [Google Scholar]
- 45.Benjamini Y, Hochberg Y. Controlling the false discovery rate: a practical and powerful approach to multiple testing. Journal of the Royal Statistical Society. Series B (Methodological). 1995;57:289–300. [Google Scholar]
- 46.Brown M. A method for combining non-independent, one-sided tests of significance. Biometrics. 1975;31:987–992. [Google Scholar]
- 47.Hess A, Iyer H. Fisher's combined p-value for detecting differentially expressed genes using Affymetrix expression arrays. BMC Genomics. 2007;8:96. [DOI] [PMC free article] [PubMed] [Google Scholar]
- 48.Edgar R, Domrachev M, Lash AE. Gene Expression Omnibus: NCBI gene expression and hybridization array data repository. Nucleic Acids Res. 2002;30:207–210. [DOI] [PMC free article] [PubMed] [Google Scholar]
- 49.Hasler R, Feng Z, Backdahl L, et al. A functional methylome map of ulcerative colitis. Genome Res. 2012;22:2130–2137. [DOI] [PMC free article] [PubMed] [Google Scholar]
- 50.Huang DW, Sherman BT, Lempicki RA. Systematic and integrative analysis of large gene lists using DAVID bioinformatics resources. Nat Protoc. 2009;4:44–57. [DOI] [PubMed] [Google Scholar]
- 51.Barretina J, Caponigro G, Stransky N, et al. The cancer cell line encyclopedia enables predictive modelling of anticancer drug sensitivity. Nature. 2012;483:603–607. [DOI] [PMC free article] [PubMed] [Google Scholar]
- 52.Dawson J, Bryant MG, Bloom SR, et al. Subcellular fractionation studies of human rectal mucosa: localization of the mucosal peptide hormones. Clin Sci (Lond). 1980;59:457–462. [DOI] [PubMed] [Google Scholar]
- 53.Anderson CA, Boucher G, Lees CW, et al. Meta-analysis identifies 29 additional ulcerative colitis risk loci, increasing the number of confirmed associations to 47. Nat Genet. 2011;43:246–252. [DOI] [PMC free article] [PubMed] [Google Scholar]
- 54.Johnson AD, Handsaker RE, Pulit SL, et al. SNAP: a web-based tool for identification and annotation of proxy SNPs using HapMap. Bioinformatics. 2008;24:2938–2939. [DOI] [PMC free article] [PubMed] [Google Scholar]
- 55.Cooke J, Zhang H, Greger L, et al. Mucosal genome-wide methylation changes in inflammatory bowel disease. Inflamm Bowel Dis. 2012;18:2128–2137. [DOI] [PubMed] [Google Scholar]
- 56.Powell-Tuck J, Day DW, Buckell NA, et al. Correlations between defined sigmoidoscopic appearances and other measures of disease activity in ulcerative colitis. Dig Dis Sci. 1982;27:533–537. [DOI] [PubMed] [Google Scholar]
- 57.Truelove SC, Richards WC. Biopsy studies in ulcerative colitis. Br Med J. 1956;1:1315–1318. [DOI] [PMC free article] [PubMed] [Google Scholar]
- 58.Garrity-Park MM, Loftus EV, Jr, Sandborn WJ, et al. Methylation status of genes in non-neoplastic mucosa from patients with ulcerative colitis-associated colorectal cancer. Am J Gastroenterol. 2010;105:1610–1619. [DOI] [PubMed] [Google Scholar]
- 59.Chen L, Su L, Li J, et al. Hypermethylated FAM5C and MYLK in serum as diagnosis and pre-warning markers for gastric cancer. Dis Markers. 2012;32:195–202. [DOI] [PMC free article] [PubMed] [Google Scholar]
- 60.Connelly JJ, Shah SH, Doss JF, et al. Genetic and functional association of FAM5C with myocardial infarction. BMC Med Genet. 2008;9:33. [DOI] [PMC free article] [PubMed] [Google Scholar]
- 61.Carvalho FM, Tinoco EM, Deeley K, et al. FAM5C contributes to aggressive periodontitis. PLoS One. 2010;5:e10053. [DOI] [PMC free article] [PubMed] [Google Scholar]
- 62.Tanaka K, Matsumoto E, Higashimaki Y, et al. FAM5C is a soluble osteoblast differentiation factor linking muscle to bone. Biochem Biophys Res Commun. 2012;418:134–139. [DOI] [PubMed] [Google Scholar]
- 63.Shorts-Cary L, Xu M, Ertel J, et al. Bone morphogenetic protein and retinoic acid-inducible neural specific protein-3 is expressed in gonadotrope cell pituitary adenomas and induces proliferation, migration, and invasion. Endocrinology. 2007;148:967–975. [DOI] [PubMed] [Google Scholar]
Associated Data
This section collects any data citations, data availability statements, or supplementary materials included in this article.