

Abstract
Study Objectives:
That sleep deprivation increases the brain expression of various clock genes has been well documented. Based on these and other findings we hypothesized that clock genes not only underlie circadian rhythm generation but are also implicated in sleep homeostasis. However, long time lags have been reported between the changes in the clock gene messenger RNA levels and their encoded proteins. It is therefore crucial to establish whether also protein levels increase within the time frame known to activate a homeostatic sleep response. We report on the central and peripheral effects of sleep deprivation on PERIOD-2 (PER2) protein both in intact and suprachiasmatic nuclei-lesioned mice.
Design:
In vivo and in situ PER2 imaging during baseline, sleep deprivation, and recovery.
Settings:
Mouse sleep-recording facility.
Participants:
Per2::Luciferase knock-in mice.
Interventions:
N/A.
Measurements and Results:
Six-hour sleep deprivation increased PER2 not only in the brain but also in liver and kidney. Remarkably, the effects in the liver outlasted those observed in the brain. Within the brain the increase in PER2 concerned the cerebral cortex mainly, while leaving suprachiasmatic nuclei (SCN) levels unaffected. Against expectation, sleep deprivation did not increase PER2 in the brain of arrhythmic SCN-lesioned mice because of higher PER2 levels in baseline. In contrast, liver PER2 levels did increase in these mice similar to the sham and partially lesioned controls.
Conclusions:
Our results stress the importance of considering both sleep-wake dependent and circadian processes when quantifying clock-gene levels. Because sleep deprivation alters PERIOD-2 in the brain as well as in the periphery, it is tempting to speculate that clock genes constitute a common pathway mediating the shared and well-known adverse effects of both chronic sleep loss and disrupted circadian rhythmicity on metabolic health.
Citation:
Curie T, Maret S, Emmenegger Y, Franken P. In vivo imaging of the central and peripheral effects of sleep deprivation and suprachiasmatic nuclei lesion on PERIOD-2 protein in mice. SLEEP 2015;38(9):1381–1394.
Keywords: bioluminescence, circadian, homeostasis, clock genes, cerebral cortex, hippocampus, cerebellum, Purkinje cells
INTRODUCTION
The timing and quality of both sleep and wakefulness depend on the interaction of two processes. A sleep-wake–driven process monitors and controls homeostatic sleep need, while a circadian process generates a sleep-wake independent wake-promoting signal. The circadian wake-promoting signal is thought to oppose homeostatic sleep need, thereby determining the time-of-day sleep occurs.1 Studies aimed at dissecting the respective contributions of sleep-wake dependent and circadian factors to sleep-wake regulation are hampered by the fact that many aspects of sleep are directly or indirectly affected by both processes. Accumulating evidence shows that even the so-called clock genes, long thought to encode circadian time information exclusively and therefore widely used as circadian state variables, are also implicated in the homeostatic process; i.e., conferring information concerning time spent awake (and asleep).2
The notion that clock genes play a role in the homeostatic aspect of sleep regulation comes from three types of observations. First, altered sleep homeostasis was observed in animals, including humans, carrying clock gene mutations or polymorphisms.3–12 In these studies the response to sleep deprivation in terms of increased sleep duration and/or electroencephalographic (EEG) delta power during nonrapid eye movement (NREM) sleep, a widely used state variable of the sleep homeostatic process,13 differed from those observed in controls. A second type of observation concerns the effects of sleep deprivation on the specific DNA-binding of NPAS2 and BMAL1 to the E-box motives of specific target genes, among which is the clock gene Per2.14 This study demonstrates that extended wakefulness directly affects the core clock machinery. Finally, and likely related to the previous observation, the expression of a number of core circadian transcripts changes as a function of time spent awake (or time spent asleep). Among those, Per2 messenger RNA (mRNA) levels in the brain are reliably and predictably increased by sleep deprivation under a number of conditions.8,15–18
From circadian time course analyses it is known that 6- to 8-h lags exist between the time at which mRNA and protein levels peak for many clock genes.19 These long time lags have been attributed to the many posttranscriptional and posttranslational processes known to modify the stability and nuclear entry of clock genes among other mechanisms.19–21 In the mouse robust homeostatic responses in a variety of sleep variables can, however, already be observed after sleep deprivations of 6 h.22,23 If clock genes are to play a functional role in sleep homeostasis, their protein product should increase within such a time frame. To date, studies quantifying clock gene protein levels after sleep deprivation are lacking and a main aim of the current study is therefore to determine the dynamics of the protein levels of the clock gene Per2 during sleep deprivation and recovery sleep. In addition, we have previously shown that the wake-dependent increase in Per2 expression is modulated by circadian factors.18 Hence, a further goal is to determine the influence of lesioning the suprachiasmatic nuclei (SCN), the central circadian pacemaker, on the sleep deprivation-induced increase of PER2 protein. We expect to observe this increase also in behaviorally arrhythmic mice. As accumulating evidence suggests that sleep deprivation not only affects gene expression in the brain but also in the periphery,16,24–26 a last aim was to establish whether PER2 levels in the liver and kidney are affected as well.
To achieve these goals we used Per2::Luciferase (Per2Luc) knock-in mice27 to image PER2 protein variations in the whole living mouse. We found that PER2 protein increases after sleep deprivation not only in the brain but also in the liver and the kidney, albeit with tissue-specific dynamics. Brain immunohistochemistry established that sleep deprivation targeted PER2 levels in layers IV and V of the cerebral cortex, whereas levels in SCN remained unperturbed. These results demonstrate for the first time that in the brain, sleep deprivation rapidly increases PER2 (within 3 h) and thus that the protein follows the changes in mRNA more closely as compared to the circadian relationship between the two. Against expectation, the sleep deprivation-induced increase of PER2 in the brain was smaller in SCN-lesioned mice whereas in the liver PER2 was again higher than baseline similar to sham and partially lesioned control mice. Equally unexpected was the finding that in some SCN-lesioned mice we could still identify circadian rhythmicity in PER2 despite an absence of a circadian organization of locomotor activity. Illustrated for Per2, these results stress the importance of considering both sleep-wake dependent and circadian processes when quantifying clock gene levels in vivo.
EXPERIMENTAL PROCEDURES
Animals, Housing Conditions, and Sleep Deprivation
All animals were kept under a 12 h-light/12 h-dark cycle (LD12:12; lights on at 09:00, 110 lx) and were singly housed with food and water available ad libitum. We use Zeitgeber time (ZT) to indicate time-of-day with ZT0 (or ZT24) marking light onset and ZT12 dark onset. Cages were placed in a sound attenuated and temperature controlled recording room (25°C). Both female and male mice were used. Animals were sleep deprived by what is referred to as “gentle handling.”28
C57BL/6J (B6) mice heterozygous for the Per2::Luciferase knock-in construct (Per2Luc; kindly provided by Dr J.S. Takahashi, University of Texas, Southwestern Medical Center, TX, USA) were bred in our facility and all experiments were approved by the Ethical Committee of the State of Vaud Veterinary Office, Switzerland. PCR genotyping was done as described previously.27
In Vivo PER2 Bioluminescence Imaging
Mice heterozygous for the Per2Luc construct displayed lower levels of bioluminescence (data not shown) and all experiments were therefore performed in homozygous Per2Luc mice only. The luciferase substrate, D-luciferin (Prolume Ltd, Pinetop, AZ, USA; 35 mg/mL diluted in ACSF, pH 7.3), was delivered using osmotic mini pumps (model 1002, Alzet, Cupertino, CA, USA; release rate 0.25 μL/h over 14 days according to manufacturer's specifications). For brain delivery of D-luciferin, a cannula (Brain Infusion Kit1, Alzet) was introduced stereotaxically into the right lateral ventricle (1 mm lateral, 0.3 mm posterior to bregma and 2.2 mm deep) under deep anesthesia (ketamine/xylazine; intraperitoneally, 75 and 10 mg/kg, respectively), and connected to the mini pump. Filled mini pumps were incubated in sterile saline solution at 37°C overnight prior to implantation. To facilitate passage of photons emitted by the brain through the skull, a depression (diameter 2 mm2) was made in (but not through) the skull in a region of the left frontal cortex (approximate coordinates 2 mm lateral to midline, 2 mm anterior to bregma), in which a glass cylinder (length 4.0 mm; diameter 2.0 mm2) was positioned and fixed with dental cement. For peripheral organs, bioluminescence was detected directly through the skin in an abdominal region (2.0 cm2) corresponding to the liver and in a dorsal region (1.5 cm2) corresponding to the left kidney from the same mice. Pelage in these regions was removed.
For each reading, mice were lightly anesthetized (isoflurane; 2.5% vaporized in O2). Bioluminescence was imaged with an ultrasensitive charge-coupled device (CCD) camera (IVIS 3D; field of view, 10; bin factor 2; Xenogen, Alameda, CA, USA). Light emission was integrated over 60 sec in triplicate and these triplicates were averaged yielding one measure per mouse and time point. The entire procedure did not last longer than 4 min, after which mice were immediately returned to their home cage.
Bioluminescence readings from brain and peripheral organs in Per2Luc mice (males and females, 3 mo of age, brain: n = 6/ sex; liver and kidney: n = 6/sex; total n = 24), started 4 days after introducing the mini pump. Results did not differ with sex (analysis not shown). For the time course analyses during baseline, readings were obtained for eight different times of day (ZT0, 3, 6, 9, 12, 15, 18, and 21) within each mouse spread out over a 4-day period such that no more than two measures were taken per day spaced at least 12 h apart. Forty-eight hours after the last baseline reading, the same individuals were used to assess the effect of sleep deprivation. First, control values were acquired the day prior to sleep deprivation by imaging mice at ZT0, 6, 8, and 12. On the sleep deprivation day (performed from ZT0 to 6) images were taken at ZT6, 8, and 12. For the sham, SCNx rhythmic and arrhythmic mice, the same protocol to quantify bioluminescence was performed but under constant dark (DD) conditions. Under DD conditions circadian time (CT) was used to indicate time-of-day with CT12 corresponding to the onset of locomotor activity.
For subsequent analysis, a large region of interest (ROI) was drawn over the area of light emission and photon flux (photons/ sec/cm2/sr) was measured using Living Image (Xenogen, Alameda, CA, USA) as an overlay on Igor image analysis software (Wavemetrics, Inc, Lake Oswego, OR, USA). All measures were expressed as a percentage of the individual mean bioluminescence averaged over the eight baseline values. With the concentration of D-luciferin used here, we found mean photon flux for bioluminescence to be at least ten times higher than background (data not shown), which is consistent with the results described previously using the same concentration.29 For three-dimensional reconstruction of bioluminescence source, see Experimental Procedure 3 in supplemental material.
Day-to-day stability of bioluminescent signals was assessed in brain, liver, and kidney by imaging Per2Luc mice (males, 3 mo of age, n = 7) daily for 21 days at ZT3 following osmotic mini-pump implantation. Signals were found to be stable between days 4 and 10 after mini- pump implantation. This time window was used for subsequent studies.
Immunohistofluorescence
Homozygous Per2Luc mice were sacrificed at ZT0, 6, 12, and 18 and after sleep deprivation (ZT0–6) at ZT6 (male, 3 mo of age, n = 3/time point; total n = 15). All mice were subjected to intracardiac perfusion with phosphate buffered saline (PBS)-heparin (2 units/mL) and with 4% paraformaldehyde (PFA) in PBS, pH 7.4. Brains were carefully removed and postfixed for 3 h at 4°C. Brains were cryoprotected in 10% and 20% of sucrose for 1 h each and in 30% of sucrose in PBS for 48 h at 4°C and then embedded in Tissue-Tek optimum cutting temperature (OCT)compound (VWR International, Switzerland) for cryostat sectioning.
Sagittal brain sections (30 μm) were washed in PBS (0.1% Triton X-100) and blocked (5% goat serum, Sigma Aldrich, Buchs, Switzerland) and then incubated overnight at 4°C in a humidified chamber with primary antibodies directed against mPER2 [1:250; rabbit polyclonal immunoglobulin G (IgG), Alpha Diagnostic international, ADi, San Antonio, TX, USA, and rabbit polyclonal IgG, 1:250, Santa Cruz, SC-25363, Heidelberg, Germany]. The two antibodies yielded similar immunolabeling. Primary antibody against vasopressin [AVP; 1:1000, guinea pig polyclonal anti-(Arg8)-vasopressin; Peninsula Laboratories, LLC, San Carlos, CA, USA] was used to identify the SCN. Sections were incubated at room temperature for 2 h with Alexa-488 and Cy3-conjugated secondary antibodies [1:1000, Alexa Fluor 488 goat anti-rabbit IgG (Invitrogen, Waltham, Massachusetts, USA) and 1:1000, Cy3 polyclonal goat anti-guinea pig IgG (Abcam, Cambridge, UK)]. Finally, sections were incubated with the nucleic acid counterstain DAPI (1:1000, room temperature, 5 min, Vector laboratories, Peterborough, UK), washed, and coverslipped using Mowiol medium (Polyvinyl alcohol 4-88, Sigma Aldrich, Buchs, Switzerland). Controls were performed by omitting primary antibodies, which in all cases resulted in an absence of immunofluorescence signal (not shown).
Fluorescence from whole brain sagittal views was acquired using a stereomicroscope MZ16FA (Leica, Wetzlar, Germany). All other acquisitions were done with a confocal microscope (Zeiss 510 LSM, Oberkochen, Germany). For triple-labeling with two antibodies plus DAPI, the 405-, 488-, and 543-nm lines were used in alternating acquisition mode. For semiquantitative analyses of the fluorescence for PER2, five sagittal slides per animal (total, n = 15 slides) were selected containing the SCN and the hippocampus. For each slide, quantification of fluorescence for mPER2 was performed in five ROIs: cerebral cortex, cerebellum, SCN, and the hippocampal cornu ammonis (CA) and dentate gyrus (DG) regions. In each sagittal slide, a ROI (1,024 × 1,024 pixels) was defined and a projection of 10 stacks was performed using a confocal microscope with the same optical stack distance for all acquisitions. Power of the lasers, opening of the pinhole, and detector gain were kept identical for all acquisitions. Z-stacks projections were exported in ImageJ 1.33u software to measure the maximum intensity projection (MIP). Finally, data were z-transformed prior to statistical analyses.
SCN Lesions, Locomotor Activity, and Histology
Bilateral lesion of the two SCNs was performed stereo-taxically (Kopf Instruments, 963LS, Miami Lakes, FL, USA) under ketamine/xylazine anesthesia (intraperitoneal injection, 75 and 10 mg/kg, at a volume of 8 mL/kg). Two electrodes (0.3 mm in diameter) were introduced bilaterally at the following coordinates (anteroposterior using bregma as reference: +0.5 mm, lateral: 0.2 mm, depth: 5.9 mm). Electrolytic lesions (1 mA, 5 sec) were made using a direct current (DC) lesion device (3500, Ugo Basile, Comerio, Italy). Sham mice differed from SCN lesioned mice only in that no electrical current was applied.
Locomotor activity of Per2Luc mice (age 3–4 mo) was recorded under a 12:12 h light-dark conditions (LD12:12, lights on at 09:00, 110 lux) at least for 10 days before lesion. After lesion, mice stayed 3–4 days under LD12:12, followed by constant dark (DD) conditions for 3 w to verify presence or absence of circadian organization of overt behavior. Activity was quantified using passive infrared sensors (Visonic SPY 4/ RTE-A, Riverside, CA, USA). ClockLab software (Actimetrics, Wilmette, IL, USA) was used for data acquisition and analyses. The anatomical site of lesion was verified with Nissl staining on coronal brain sections (see Figure S5, supplemental material).
At the end of the experiments, mice were anesthetized with ketamine/xylazine (intraperitoneal injection, 75 and 10 mg/kg, at a volume of 8 mL/kg) and perfused intracardiacally with PBS-heparin (2 units/mL) and with 4% PFA in PBS, pH 7.4. Brains were carefully removed and incubated in 10% and 20% of sucrose for 1 h each, and in 30% of sucrose in PBS for 48 h at 4°C, and then embedded in OCT compound at −20°C until cryostat sectioning.
Coronal brain sections (20 μm) were washed in PBS and then postfixed in 4% PFA at 4°C for 10 min. Brain sections were then incubated for 10–15 minutes in Cresyl violet (Sigma Aldrich) and washed in distilled water. Then brain slices were successively immerged in ethanol 95%, ethanol 100%, and three xylene baths before being coverslipped in Eukitt medium (Fluka, Buchs, Switzerland). Chemical staining from whole brain coronal views was finally acquired using a Leica stereomicroscope (MZ16FA, Wetzlar, Germany) and a Zeiss microscope (LSM510; Oberkochen, Germany) with Axiovision software.
Statistics
Statistical analyses were performed using SAS (SAS Institute Inc, Cary, NC, USA). Significant effects of the factors sleep deprivation and time of day and their interactions were assessed using analysis of variance (ANOVA) analyses (SAS, procedure GLM) and decomposed using post hoc (paired) t tests or Tukey honestly significant difference tests in case more than two groups were compared. Statistical significance was set to P < 0.05 and results are reported as mean ± standard error of the mean. Circadian rhythmicity in locomotor activity was evaluated using chi-square periodogram analysis (P < 0.05; ClockLab, Actimetrics). To estimate PER2-bioluminescence rhythmicity in intact, sham-lesioned, and SCN lesioned mice, sine waves were individually fit (SAS, procedure NLIN) to the eight data obtained in each organ (liver, kidney, brain) with amplitude and phase as free parameters. As an estimate of period, the period length of the individual's rhythm in locomotor activity was used, which for the intact mice under LD12:12 was set to 24.0 h. For arrhythmic SCN lesioned animals the average period of the sham-lesioned mice was used. When the estimated 95% confidence interval for the sine-wave amplitude did not overlap 0, bioluminescence was deemed rhythmic. SigmaPlot 11 (Systat Software Inc., Chicago, IL, USA) was used for graphs.
RESULTS
The PER2::LUC fusion protein did not appear to interfere with PER2's clock function judged by the intact circadian locomotor activity patterns observed in Per2Luc mice27 (Figure S1, supplemental material). Moreover, the baseline amount and distribution of sleep, the response to a 6-h sleep deprivation, and the sleep-wake driven changes in EEG delta power all indicate that also sleep regulation was not affected (Figure S1).
Subcutaneous delivery of D-luciferin, the substrate of luciferase, in Per2Luc mice resulted in a strong bioluminescence signal throughout the body confirming the ubiquitous expression of PER2::LUC and, by inference, PER2 protein in wild-type mice.27 Strongest bioluminescence signals were observed in two dorsal and one ventral region. Three-dimensional reconstruction identified the kidney and liver as their respective source (Figure S2, supplemental material). Bioluminescence levels were lowest in the head because the skull bone limits photon passage. Therefore, in a separate group of mice, the skull was thinned and equipped with a glass cylinder to assess brain PER2-bioluminescense (Figure 1A). Stable bioluminescence levels in brain, liver, and kidney were reached by day 4 after the start of luciferin delivery and maintained until day 10 (Figure S2). All subsequent experiments were performed within this 7-day window following the protocol illustrated in Figure S3 (supplemental material).
Figure 1.

Time of day and sleep deprivation affect PER2 protein levels under light-dark conditions. (A) An example of the daily changes (ZT0–24; 3-h intervals) in bioluminescence (color coded as “heat” scores) emanating from the left frontal cerebral cortex through a glass cylinder (red arrow in left panel) of an individual of Per2Luc mice. Bioluminescence images are superimposed on photos of the mouse's head. Luciferin was delivered through a cannula (yellow arrow) into the right lateral ventricle. Strongest signals (red color) were observed at ZT21 and ZT0/24. (B) Mean (± 1 standard error of the mean [SEM]) bioluminescence levels in brain, liver, and kidney (n = 12) under baseline conditions (ZT0–24; 3-h intervals; gray line) and at ZT6, ZT8, and ZT12 (black line) after a 6-h sleep deprivation (SLD; ZT0–6; dashed line). Values were expressed as % of the individual mean bioluminescence in baseline before averaging. Horizontal dashed lines indicate mean bioluminescence (i.e., 100%). Blue data point indicates mean (± 1 SEM) bioluminescence at ZT3 after a 3-h SLD (n = 3). (C) Mean fold-change in bioluminescence (vertical bars, +1 SE of the ratio) in brain (black), liver (brown), and kidney (green bars) at 0, 2, and 6 h of recovery after SLD (i.e., ZT6, ZT8, and ZT12) compared to corresponding baseline measures within individuals. Red triangles mark significant deviations from baseline (post hoc paired t tests; P < 0.05). The initial increase after SLD, at ZT6, is larger in brain compared to kidney (red asterisk; post hoc Tukey; P < 0.05). (D) Time course of mean locomotor activity. Hourly values were expressed as % of the mean individual 24-h activity before averaging. Horizontal line indicates mean activity (i.e., 100%). Gray areas in panels B and D delineate the 12-h dark periods.
In Vivo Assessment of the Effects of Time of Day and Sleep Deprivation on PER2 Protein under Entrained Conditions
The in vivo, nychthemeral changes in PER2 protein levels were quantified in brain, liver, and kidney. Robust, threefold changes in PER2 were observed in all three tissues with a nadir reached in the middle of the light period (ZT6), whereas maximal levels were reached 3 h after dark onset (ZT15) in the kidney and 3 h before light onset (ZT21) in the liver and brain (Figure 1B). These changes in PER2 bioluminescence were similar in phase and amplitude to the changes obtained by Western blot analyses in a small subset of mice (Figure S4, supplemental material). This indicates that turnover of the PER2::LUC fusion protein and of the native PER2 protein are regulated in similar fashion and can be reliably monitored by bioluminescence in vivo.
We have previously shown that enforced wakefulness (i.e., sleep deprivation) increases Per2 mRNA levels in the brain8,10,15–18 suggesting that the nychthemeral sleep-wake distribution contributes to the nychthemeral (and circadian) changes in PER2 protein levels described here and previously by others.30 The resemblance among the baseline time courses of locomotor activity, wakefulness, and PER2 levels, particularly in the brain, already support this (Figures 1 and S2). To further investigate this relationship, mice were sleep deprived for 6 h (ZT0–6). Sleep deprivation was followed by an increase in PER2 levels not only in the brain, but also in liver and kidney, although the dynamics of this change during recovery sleep greatly varied among the three tissues (Figure 1C). In the brain, sleep deprivation greatly attenuated the pronounced decrease in PER2 observed during corresponding baseline hours and 1.8-fold higher PER2 levels were observed immediately after sleep deprivation, consistent with the approximately twofold increase in Per2 mRNA levels observed after sleep deprivations performed at this time of day.8,10,15–18 Brain PER2 levels were still increased after 2 h of recovery sleep (ZT8) before reverting to baseline over the 4 subsequent recovery hours (Figure 1). Sleep deprivations as short as 3 h are sufficient to increase Per2 mRNA.15 In a separate group of mice, we confirmed that 3 h also suffices to fully counter the profound decrease in PER2 occurring between ZT0–3 (blue data point in the Figure 1B), suggesting that the sleep-wake driven changes in PER2 translation closely follow the changes in mRNA contrasting the long time-lag between the two reported for their circadian dynamics.21,31
Surprisingly and in stark contrast with the PER2 dynamics in the brain, liver levels remained elevated above baseline for the entire 6 h over which recovery was measured, whereas in the kidney, a significant increase was observed at ZT8 only; i.e., after 2 h of recovery sleep. Western blot analysis of liver confirmed these bioluminescence results including the prolonged increase in PER2 after sleep deprivation (Figure S4).
Brain Topography of the PER2 Increases after Sleep Deprivation
We then determined which brain areas contributed to the sleep deprivation-induced changes in brain PER2 bioluminescence using immunohistofluorescence. Sleep deprivation increased PER2 fluorescence in the cerebral cortex, especially in the cingulate and motor cortices, the olfactory bulb, and cerebellum (Figure 2A). Close inspection of the brain areas directly under the site at which bioluminescence was sampled in vivo (see Methods); i.e., the cerebral cortex and the hippocampal cornu ammonis (CA) fields CA1–3 and dentate gyrus, revealed that PER2 positive cells in cortical layers IV and V showed stronger fluorescence after sleep deprivation as compared to baseline (Figures 2B and 3B; quantified in Figure 3G). Both the cell nuclei (co-localization with DAPI) and cytoplasm of these cells stained positive for PER2, with no apparent labeling of axonal projections (Figures 2B and 3B). PER2 positive cells were also found in the pyramidal cell layer throughout the CA fields of the hippocampus (Figures 2E and 3E). The cytoplasm, nucleus, and axonal projections of these cells stained all positive for PER2 (Figure 3E). PER2 staining was also observed in the granular cell layer and hile of the dentate gyrus (Figures 2F and 3F). Sleep deprivation did not, however, significantly modify PER2 staining in these hippocampal areas (Figures 2E and 2F; quantified in Figure 3G). It thus seems that the specific increase in PER2 expression in the cerebral cortex underlies the increase in bioluminescence observed in the brain in vivo.
Figure 2.

Brain immunohistofluorescence of PER2 after a 6-h sleep deprivation. (A) Representative examples of sagittal brain sections of Per2Luc mice showing PER2 expression (green pseudocolor) at ZT6 under baseline conditions (CTRL) and after a 6-h sleep deprivation (SLD; ZT0–6). In addition, sections were stained for AVP (red), to mark the suprachiasmatic nuclei (SCN), and DAPI (blue), to visualize cell nuclei. White boxed areas mark the five brain regions detailed in Panels B-E; i.e., cerebral cortex (B), SCN (C), cerebellum (D), and the hippocampal areas cornu ammonis (CA) (E) and dendate gyrus (DG) (F). Roman numerals in panel B indicate cortical layers I-VI with tick marks estimating layer boundaries based on visual inspection of cytoarchitectural variation in each section. Scale bar in panel A is 1,250 μm and in panels B–F 50 μm.
Figure 3.

Brain immunohistofluorescence of PER2 as a function of time of day. (A) Sagittal brain sections of Per2Luc mice showing PER2 levels (green) costained with an AVP antibody (red; lower 4 panels) at ZT0, ZT6, ZT12, and ZT 18. Note the red AVP staining in the suprachiasmatic nuclei (SCN) (C) turning yellow when PER2 is high (ZT12 and ZT18). The same sections were counterstained for DAPI (blue; upper four panels). Detailed PER2 staining is shown for cerebral cortex (B), SCN (C), cerebellum (D), and the cornu ammonis (CA) (E) and dendate gyrus (DG) (F). Details for SCN (C), cerebellum (D), and CA (E) shown at higher magnification at times of high PER2 expression (i.e., ZT12, ZT18, and ZT18, respectively). Note that (1) many PER2 positive cells can be seen in cortical layers IV and V, (2) most PER2 positive cells (green) in the SCN also express AVP (red; yellow when overlain), (3) the cytoplasm and axons but not the nuclei of Purkinje neurons in the cerebellum express PER2 (see white arrows), and (4) many cells in the hippocampus, specifically in the granule cell layer and subgranular zone, are PER2 positive. (G) Quantification of PER2 fluorescence for the five brain regions at ZT0 (double plotted at ZT24), ZT6, ZT12, and ZT18 (gray line) and at ZT6 after a 6-h sleep deprivation (SLD; ZT0–6; black line; see data in Figure 2). Numbers beside data points indicate other ZT times from which the data point significantly differed (post hoc Tukey; P < 0.05). Note that SLD significantly changed PER2 levels only in the cerebral cortex (red asterisk; post hoc t test; P < 0.05). Gray areas mark the 12-h dark periods. Scale bar in panel A is 1,250 μm, in panels B–E and in details 50 μm. See Figure 2 for details.
Sleep deprivation increased PER2 also in the cerebellum (Figures 2A and 2D), although this increase failed to reach significance levels when quantified in the defined ROI (Figure 3G). Visually identified Purkinje cells displayed a particularly strong PER2 fluorescence signal in the cytoplasm and axonal projections, whereas in the nucleus PER2 was conspicuously absent (Figure 3D), contrasting the observations made in cerebral cortex and hippocampus. This absence of nuclear PER2 was noticed also at the other three times of day (data not shown).
Because sleep deprivation can alter the phase of circadian activity rhythms32 and affects multiunit activity in the SCN,33 sleep deprivation-dependent changes in PER2 in the SCN were anticipated. At the sagittal plane depicted (0.10–0.15 mm lateral to midline), the SCN can be clearly discerned by the denser DAPI staining and the presence of vasopressin (AVP), which is specific of the dorsomedial region of the SCN (in red; Figures 2A and 2C). Most SCN cells positive for PER2 also stained for AVP but PER2 was clearly expressed in both the nucleus and cytoplasm, whereas AVP is mainly cytoplasmic (Figure 3C). At the end of the sleep deprivation (ZT6), only a few PER2-positive cells were observed in the SCN and PER2 fluorescence after sleep deprivation did not differ from that observed during baseline (Figures 2C and 3G). The lack of an effect of sleep deprivation on PER2 levels in the SCN, along with decreased neuronal activity in the SCN,33 could point to a dissociation of the molecular circadian clock from its neuronal output.
We then followed the changes in brain topography of PER2 expression over the day. In general, expression was highest and most widespread at ZT18 and lowest at ZT6 (Figure 3A). Nevertheless, quantification of these expression profiles showed that changes in fluorescence differed across the five areas for which it was quantified. No statistical variation in PER2 levels were observed in the dentate gyrus contrasting the large, 4.7-fold peak-to-trough changes observed in the SCN with maximal levels reached at ZT12 and minimal values at ZT0 (Figures 3C and 3G). Timing of peak and trough values varied among the other structures quantified (cerebellum: ZT18 and ZT12; CA: ZT0 and ZT12; cerebral cortex: ZT18 and ZT6, respectively). Of these profiles, the time-course of PER2 fluorescence in the cerebral cortex best matched the changes of brain bioluminescence in Per2Luc mice (Figure 1B), again underscoring that the bioluminescence signal we quantified originated there.
Because the time spent awake and asleep varies as a function of time of day and because enforced waking increases PER2 in the brain, the baseline sleep-wake distribution is likely to have contributed to these nycthemeral changes in PER2 expression. We therefore compared the sleep deprivation-induced regional changes in PER2 expression to those observed after an extended period of spontaneous wakefulness as is the case at ZT18. High PER2 levels were observed both after sleep deprivation and at ZT18 in the cerebral cortex, the cerebellum, and olfactory bulb (Figures 2A and 3A) and the levels quantified in the cortical and cerebellar regions (Figure 3G) indicated that spontaneous and enforced waking similarly contributed to the high PER2 levels in these areas. Despite these similarities between enforced and spontaneous periods of wakefulness with respect to PER2 levels, the important and widespread PER2 expression observed at ZT18, especially noticeable in the mid-brain and pontine areas, was conspicuously absent at ZT6 after the sleep deprivation. Finally, PER2 in the SCN did not seem to be affected by sleep-wake states as highest levels were reached after the main rest phase and decreased over the main active period (Figures 3C and 3G), consistent with the fact that sleep deprivation does not affect PER2 levels in this structure.
In Vivo PER2 Assessment in SCN-Lesioned Per2Luc Mice Under Constant Dark Conditions
Next, we studied the relationship between wakefulness and PER2 levels under constant dark (DD) conditions when circadian rhythms free run. We also assessed the effects of lesioning the SCN (SCNx) (or the lack of circadian rhythms in locomotor activity), on PER2. Under DD conditions all Per2Luc sham-operated mice displayed robust, circadian locomotor activity patterns resembling those observed in intact mice (Figures 4B and S5). Of the SCNx mice 53% still displayed significant rhythmicity albeit less robust statistically, likely due to incomplete lesioning of the SCN (for χ2-analysis and histology see Figure S5). Average free-running periods did not differ between sham and rhythmic SCNx (rhySCNx) mice (24.2 ± 0.1 h and 24.0 ± 0.1 h, respectively). Compared to the LD12:12 condition, under DD the active period (alpha) expanded in both sham and partial lesioned mice (12.0 ± 0.1h versus 14.8 ± 0.3 h and 14.9 ± 0.4 h, respectively; 1-way ANOVA P < 0.0001; LD < sham = rhySCNx; post hoc Tukey, P < 0.05) increasing the time between the first main activity bout defining activity onset and the second main activity bout preceding rest onset. As a result, the bimodal distribution of locomotor activity, already noticeable under LD12:12 (Figure 1D), became more pronounced especially in rhythmic SCNx mice (Figure 4B). In the arrhythmic SCNx mice no circadian organization of loco-motor activity was detected and histological analyses did not reveal any remaining SCN tissue (Figure S5).
Figure 4.

PER2 bioluminescence levels as a function of circadian time (CT) in sham operated mice and in rhythmic and arrhythmic suprachiasmatic nuclei (SCN)-lesioned mice under constant dark conditions. (A) Mean (± 1 standard error of the mean) bioluminescence levels in brain, liver, and kidney under baseline conditions (CT0–24; 3-h intervals; gray line; for n/group/tissue see Table 1). Values were expressed as percentage of individual mean bioluminescence in baseline before averaging. CT within individuals was calculated according the individual's free-running period using activity onset as CT12 for the sham and SCNx/rhythmic Per2Luc mice (see panel B). For SCNx/arrhythmic mice mean period and activity onset of the sham group were used to construct an average time course. (B) Mean circadian locomotor activity waveforms for sham lesioned and SCNx-rhythmic and -arrhythmic mice. Activity values were expressed as a percentage of each individual's mean activity. Note the two peaks in the activity for Sham and SCNx/rhythmic mice. Gray and white areas delineate the subjective dark or active (α) and light or rest (ρ) periods, respectively.
Following the same protocol used for the LD12:12 experiments (Figure S3), in vivo changes in PER2 bioluminescence were quantified over the circadian day in brain, liver, and kidney under DD conditions. For sham and rhythmic SCNx mice, average circadian PER2 profiles were constructed using individual period and phase information from the locomotor activity rhythms with circadian time (CT)12 as activity onset. In sham mice, clear circadian PER2 patterns were readily discerned that paralleled activity patterns in similar fashion as under LD12:12 (Figure 4A, see Figure 1B for comparison). This included the bimodality in activity observed under DD, as also PER2 bioluminescence profiles showed two peaks in the active period, especially clear in the kidney. Timing of the peak in the active phase, and the trough in the rest phase, were also similar as under LD12:12, whereas peak-trough amplitudes were somewhat smaller under DD conditions (2.4-, 2.2-, 1.9-fold for brain, liver, and kidney, respectively; versus threefold under LD12:12). Also in rhythmic SCNx mice, we observed circadian changes in PER2 similar to sham mice in all three organs but again with a smaller change [1.9-, 1.7-, and 1.7-fold in brain, liver, and kidney, respectively; two-way ANOVA on the peak-trough amplitudes with factors “Group” (LD, sham, rhySCNx; P = 0.0015) and “Tissue” (brain, liver, kidney; P = 0.0031); interaction P = 0.83; post hoc Tukey; Group: LD > rhySCNx; Tissue: Brain > Kidney; P < 0.05]. Also, the analyses of the amplitude of sine-wave functions fitted to the changes in PER2 confirmed that amplitude decreases from intact mice under LD12:12 to sham mice under DD, to rhythmic SCNx mice under DD (Table 1).
Table 1.
Parameter estimates of PER2 rhythmicity.
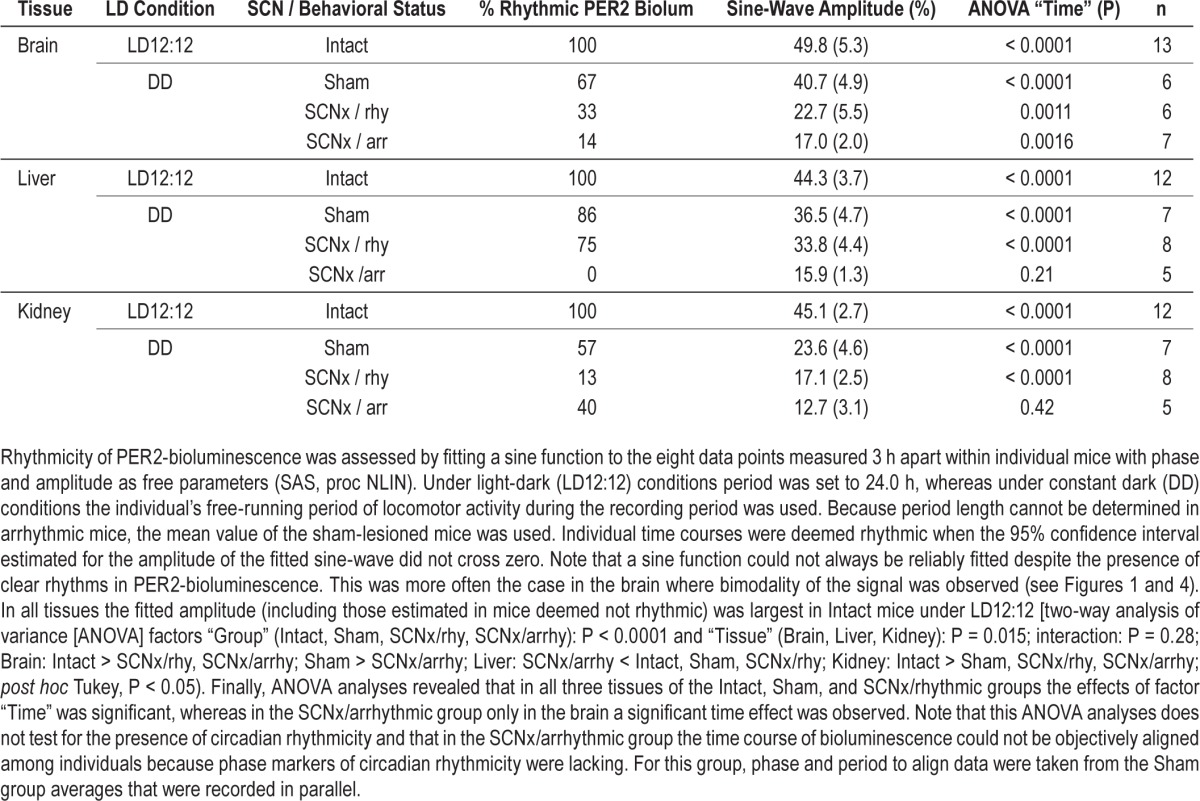
In arrhythmic SCNx (arrSCNx) mice, no apparent circa-dian rhythm in PER2 bioluminescence was present in any of the three tissues (Figure 4A). However, because no activity rhythms were present, time courses of individual mice could not be aligned in a meaningful manner and we resorted to constructing average temporal PER2 profiles using average activity onset and period length of the rhythms observed in the sham-operated mice recorded in parallel. To address this limitation, we analyzed rhythmicity in all individual mice of the four experimental groups (LD, sham, rhySCNx, and arrSCNx) using a simple sine-wave fitting procedure (see Methods and Table 1 for details). Because of the paucity of data (only eight samples covering one cycle per tissue and mouse) and due to the strong bimodality in PER2 that precluded fitting a sine function in some individuals, significant rhythms were not always obtained although clear rhythms were present visually. Despite these shortcomings, this method confirmed that under LD12:12 all tissues of all mice displayed PER2 rhythms to which a sine wave with an amplitude significantly deviating from zero could be fitted (Table 1). In the arrhythmic SCNx group, none of the liver recordings met this criterion, whereas in brain and kidney PER2 changes were still deemed rhythmic in 14 (1/7) and 40% (2/5) of the mice, respectively.
Effects of DD and SCNx on the Sleep Deprivation-Induced Increase in PER2
In a final experiment we repeated the sleep deprivation under DD conditions to rule out eventual effects of light and entrainment. Moreover, we assessed whether an intact SCN (or a circadian organization of sleep-wake behavior) is required for the effects of sleep loss on PER2 expression. Consistent with the sleep deprivation experiment under LD12:12, the 6 h sleep deprivation period was scheduled from CT0–6. Because the active period expanded by almost 3 h (circadian hours) under DD compared to LD12:12 (see previous paragraphs), the start of the sleep deprivation no longer coincided with the onset of the rest phase. Nevertheless, under both DD and LD12:12 conditions the sleep deprivation took place during the time PER2 levels steeply declined and both resulted in very similar, tissue-specific recovery dynamics (Figure 5 versus Figure 1B). In sham-operated mice PER2 levels reached at the end of the sleep deprivation were again largest in brain of the sham mice after which they reverted to baseline levels over the following 6 h. In the kidney, changes were largest at CT8, and in liver PER2 remained elevated for the entire 6-h recovery period as under LD12:12.
Figure 5.

PER2 levels after sleep deprivation in sham operated mice and in rhythmic and arrhythmic suprachiasmatic nuclei (SCN)-lesioned mice under constant dark conditions. (A) Mean (± 1 standard error of the mean) bioluminescence levels in brain, liver, and kidney under baseline conditions (circadian time (CT)0, CT6, CT8, and CT12; gray line), and after 0, 2, and 6 h of recovery sleep following a 6-h sleep deprivation (SLD CT0–6, dashed line, black line; brain: n = 3, 4, and 4; liver and kidney: n = 3, 3, and 5 for sham, SCNx-rhythmic, and -arrhythmic mice, respectively). PER2 values were expressed as a percentage of the individual mean bioluminescence in baseline. Because the four baseline measurements obtained in these mice did not span an entire cycle, direct comparisons to the relative values depicted in Figures 1 and 4 could not be made. To accommodate this we linearly adjusted the average values obtained here to the four corresponding mean relative baseline values depicted in Figure 4. Gray areas delineate subjective dark periods; i.e., α. (B) Mean fold-change in bioluminescence (vertical bars, +1 standard error of the ratio) in brain (black), liver (brown), and kidney (green bars) after 6-h SLD compared to their own corresponding baseline. Red triangles mark significant deviations from baseline (post hoc paired t tests; P < 0.05).
In rhythmic SCNx mice, PER2's response was very similar albeit less pronounced (Figure 5). This reduced response to sleep deprivation was not due to differences in the PER2 values reached during recovery because they did not differ for any of the three time points and tissues among the three groups [two-way ANOVA with factors “group” (sham, rhy-SCNx, arrSCNx), time (CT6, −8, and −12) for sleep deprivation condition: “group” P = 0.60, 0.29, and 0.08 for brain, liver, and kidney, respectively]. Instead, this reduced relative increase was due to the fact that in rhythmic SCNx mice the PER2 values during baseline did not drop to the low values reached in sham mice [ANOVA for baseline condition: “group” P = 0.02, 0.01, and 0.005, for brain, liver, and kidney, respectively; post hoc Tukey, P < 0.05; CT0: brain and kidney: sham = rhySCNx > arrSCNx; liver: sham > arrSCNx; CT6: brain: arrSCNx > rhySCNx = sham; CT8: kidney: arrSCNx > rhySCNx = sham; liver: arrSCNx = rhy -SCNx > sham; CT12: kidney: rhySCNx > sham]. In arrhythmic SCNx mice, this baseline decrease in PER2 did not occur and during recovery from sleep deprivation only modest effects were observed (Figure 5). Nevertheless, significant increases were also observed in this group, especially in the liver where after 2 and 4 h of recovery PER2 levels were still increased over basal levels.
DISCUSSION
In circadian research, live imaging of reporter genes has been widely used34,35 and contributed to the rapid progress in that field. In animals these techniques were applied first in vitro and ex vivo in cells and tissues,27,36,37 and more recently, in vivo in the whole living organism.29,38–40 In these in vivo studies circadian changes in bioluminescence could be followed in specific tissues of interest such as SCN, olfactory bulb, liver, and kidney. Because the same animal can be repeatedly sampled, these imaging techniques have an important advantage over more conventional techniques to quantify protein in that only a fraction of animals are needed to construct a circadian time course, and between-subject differences can be taken into account, thereby improving data quality. With the protocol we established, highly stable levels of bioluminescence could be maintained for the 7 days without further intervention. Variability in relative bioluminescence among individuals was small, with a coefficient of variation typically around 20% for any given time point.
In the sleep field, in vivo measurement of protein expression in the intact animal has not yet been widely applied. We here report on the central and peripheral effects of sleep deprivation on PER2 protein levels under standard light-dark conditions and under DD conditions both in intact and SCN-lesioned mice. We discovered that similarly to mRNA, PER2 protein in the brain quickly increases with sleep deprivation and that this increase concerns the cerebral cortex mainly. These results further add to the notion that clock genes not only play a role in circadian rhythm generation but also in the homeostatic regulation of sleep.2 Moreover, we found that sleep deprivation not only targets the brain but also peripheral tissues. Finally, we investigated the consequences of a SCN lesion on circadianand wake-dependent changes in PER2. In three mice, significant PER2 circadian rhythmicity could still be detected in brain and kidney whereas rhythms in locomotor activity were lacking. Against expectation, sleep deprivation in arrhythmic SCNx mice resulted only in a modest relative increase in PER2 expression, mostly in liver, due to the higher baseline PER2 levels in this experimental group.
Comparing the Effects of Sleep Deprivation on Per2 mRNA and Protein Levels
The wake-dependent increase in Per2 expression has been documented in a number of studies under a variety of experimental conditions demonstrating that both circadian and activity-induced contributions have to be considered when analyzing Per2's time course.18 If Per2 is to play a functional role in sleep homeostasis, also its protein product should increase within the time frame known to activate a homeostatic response in sleep. From circadian time course analyses in, e.g., the SCN, it is known, however, that a long, 6- to 8-h lag exists between the time at which Per2 mRNA and PER2 protein peak.19 Comparing our previous mRNA work with our current protein results, we confirmed the existence of such a long time lag also in the brain; whereas mRNA started to decrease at ZT18,18 the marked decrease in PER2 started 6 h later; i.e., at ZT0 (or CT0 under DD conditions). In our study, higher than baseline levels of PER2 were already observed after a 3-h sleep deprivation similar to Per2 mRNA,15 suggesting that PER2 protein closely follows mRNA changes when activated through noncircadian pathways. Similarly, light-induced increases in PER2 protein in the SCN occurs within 4 h41,42 and corticosterone-induced increases in PER2 in specific brain areas have been reported to occur within 1 h.43 These findings underscore that Per2 has immediate early gene properties when activated through noncircadian signaling pathways, which modulate and are modulated by the ongoing circadian rhythm in PER2. We have previously quantified and successfully mathematically modeled this nonlinear interaction between circadian and activity-induced factors that determine Per2 mRNA levels.18 Based on the limited available data, the recovery dynamics of mRNA and protein seem to be less tightly coupled; whereas after 2 h of recovery sleep Per2 mRNA levels did already revert to baseline, for PER2 protein baseline levels were attained 4 h later.
Sleep Loss Increases PER2 in the Cerebral Cortex
Within the brain the cerebral cortex, especially its layers IV and V, was most responsive to sleep loss in terms of the changes in PER2 levels. Given PER2's immediate early gene properties (see previous paragraph), increased expression in these two cortical layers could reflect increased sensory input (layer IV) and motor output (layer V)44 associated with the sleep deprivation protocol. In contrast to the prominent changes observed in the cortex, sleep deprivation did not affect PER2 levels in the SCN. At the mRNA level similar dissociations between Per2 expression rhythms in cortex and SCN have been observed under conditions of food restriction, spontaneous splitting, and methamphetamine administration where, invariably, expression in the cortex follows behavior (locomotor activity), whereas in the SCN its rhythm remains unperturbed and en-trained to the light-dark cycle.45–48 Functionally this makes intuitive sense as the SCN is required for time keeping and should therefore be shielded from the influence of the behaviors it drives. In contrast, we previously argued that in fore-brain areas circadian clock genes are necessary to adapt to and anticipate homeostatic challenges such as food restriction and sleep deprivation.10,30,49,50 The predominant effects of sleep deprivation on PER2 in the cerebral cortex is consistent with the many cortical-related functions and activities that are affected by acute sleep deprivations, including increases in EEG slow waves, cognitive performance, and energy metabolism.51
In the cerebral cortex, similar levels of PER2 protein were reached immediately after enforced and spontaneous periods of wakefulness underscoring that at least part of the variation in PER2 are secondary to the distribution of sleep and wakefulness and not primarily circadian driven. It is important to note that while animals are awake during sleep deprivation, they will immediately revert to sleep when not stimulated, especially toward the end of the sleep deprivation. In contrast, during spontaneous waking, “stimulation” can be said to be endogenous. The important and widespread PER2 expression observed at ZT18, especially clear in the midbrain and pontine areas, was conspicuously absent after the sleep deprivation at ZT6. These areas contain several structures known to play important roles in the promotion of wakefulness and in sustained attention.52 Thus, sleep deprivations performed during the rest phase, while activating the cerebral cortex, leave the rest of the brain molecularly asleep based on the PER2 levels measured here. These areas could be involved in mediating circadian wake-promotion that we observed at this time of day.18
Apart from the SCN, the most important nychthemeral changes in PER2 were observed in the cerebral cortex and cerebellum, whereas no rhythmic expression was found in the hippocampus confirming previous studies and suggesting different physiological roles for PER2 in these brain regions.53–55 Also, the subcellular localization of PER2 differs among the brain regions evaluated here. In cortex and the SCN, neuronal PER2 is mainly nuclear and expressed in the perikaryon. In stark contrast, in cerebellar Purkinje neurons, PER2 is mainly cytoplasmic and expressed in projections but lacking from the nucleus as has been shown in one other study.56 The absence of PER2 in the nucleus was observed at all times of day and is particularly surprising because, as a core circadian transcriptional regulator, PER2's nuclear presence is essential,21 and because the strong PER2 rhythms observed in Purkinje neurons are functionally important in circadian food anticipatory behavior.55 Whether in Purkinje cells other CLOCK::BMAL1 and CLOCK::NPAS2 repressors, such as PER1, are expressed in the nucleus and thus could substitute for the absence of PER2, is unknown.
The Effects of Sleep Loss on PER2 in SCNx Mice
Sleep deprivation performed between ZT0 and ZT6 (or CT0 and CT6) efficiently countered the marked decrease in PER2 occurring at this circadian phase, resulting in higher than baseline levels both centrally and peripherally. However, in the absence of this baseline decrease, such as observed in the arrhythmic SCNx mice, sleep deprivation did not appreciatively elevate PER2 above background in brain and kidney. We have previously shown, at the mRNA level in the brain, that although sleep deprivation generally resulted in levels of Per2 expression above baseline, these increases were strongly modified by the time of day the sleep deprivation was performed such that mRNA even decreased from their initial levels for sleep deprivations scheduled between ZT18 and −24.18 How this interaction between time of day and sleep deprivation at the mRNA levels translates into changes in PER2 protein levels is difficult to predict, because the temporal relationship between the two seems to differ for circadian and induced aspects of Per2–PER2 regulation (see previous paragraphs). Further complicating the interpretation of the sleep deprivation results obtained in arrhythmic SCNx mice is the fact that in the absence of a behavioral phase marker, the timing of the sleep deprivation was determined by that of the sham operated mice. Inspection of the few behaviorally arrhythmic SCNx mice that still showed evidence of circadian rhythmicity in PER2 levels revealed that sleep deprivation was not always performed at the time PER2 decreases as was done for the other experimental groups (data not shown). Whether intact circadian rhythms are a requirement for the sleep deprivation-induced increase in PER2 in the brain can therefore not be conclusively answered here. Future experiments using a recently developed imaging technique for the long-term online monitoring of PER2 bioluminescence in freely behaving mice40 would enable using the phase of the PER2 rhythm itself (if present), rather than relying on the phase of the activity rhythms to schedule the sleep deprivation. Nevertheless, sleep deprivation did significantly increase PER2 in livers of ar-rhythmic SCNx mice with dynamics similar to those observed in the other experimental groups, demonstrating that at least in this tissue the effects of sleep deprivation do not depend on a functional circadian clock.
Notwithstanding the limitations of our analysis already mentioned in the Results section, we did identify three mice in which circadian rhythms in PER2 were detected while rhythms in locomotor activity were absent after lesioning the SCN. Thus, although the SCN is needed for circadian rhythms in overt behaviors, in peripheral organs (including brain areas outside the SCN) molecular circadian rhythms can still be maintained in some cases, consistent with the ex vivo experiments performed by Yoo and colleagues27 and the in vivo experiments by us and others39,40 (but contrasting the work of Guo and colleagues57). Importantly, in the two previous studies that did observe circadian PER2 expression in kidney and liver in some of the arrhythmic SCNx mice, it was noted that the amplitudes of the changes in PER2 were reduced. Thus, in the intact animal circadian-driven behaviors, such as the circadian sleep-wake distribution and the resulting rhythms in feeding, temperature, metabolism, and clock genes,2,58,59 contribute to amplify these locally generated rhythms.
CONCLUSION
Functionally sleep has and still is generally seen as a state needed to ensure proper brain functioning.51,60,61 It has become clear, however, that sleep loss has immediate adverse consequences on metabolic balance and immune function.62,63 Accumulating evidence from molecular studies support that altered timing of sleep and sleep loss greatly affect gene expression in the periphery both in mice and humans.16,24–26 Although we see an immediate and profound increase in PER2 in the brain, the effects in liver were longer lasting and preserved in SCNx mice. The liver expression of Per2 was found to be rhythmic in mice in which the clock circuitry was arrested specifically in the liver,64 demonstrating that rhythms in Per2 expression can be driven by both systemic cues and peripheral oscillators. In light of our current results the sleep-wake distribution is likely to be one of these systemic cues. Chronic disruption of sleep also affects the peripheral expression of clock genes, including that of Per2, in humans.26 Although chronic sleep loss and disrupted circadian rhythmicity both negatively impact energy metabolism,62,65–67 whether the same or different pathways are implicated is, however, unknown. Based on our findings that the sleep-wake distribution alters PER2 levels in the periphery, it is tempting to speculate that some of the adverse peripheral effects of sleep loss are mediated through its effects on clock genes.
DISCLOSURE STATEMENT
This was not an industry supported study. The authors have indicated no financial conflicts of interest.
ACKNOWLEDGMENTS
The authors are greatly indebted to all colleagues who helped with the sleep deprivations (Valérie Hinard, Huyn Hor, Sonja Jimenez, Francesco La Spada, Géraldine Mang, Cyril Mikhail, Valérie Mongrain, Brice Petit, Corinne Pfister, and Julie Vienne). We thank Arnaud Paradis (Cellular Imaging Facility of the University of Lausanne) for help with imaging, Marieke Hoekstra (University of Lausanne) for critical comments on the manuscripts, and David Weaver (University of Massachusetts Medical School) and Ueli Schibler (University of Geneva) for generously providing PER2 antibodies. Research was supported by fellowships of the Marie Curie Intra-European program (IEF-FP7-Project Number: 221254) and the Novartis Foundation to TC, the Swiss National Science Foundation (SNF 31003A-130825, and -146694) to PF, EUMODIC (Contract no.: 037188) supporting YE, the University of Lausanne, and the state of Vaud, Switzerland.
SUPPLEMENTAL MATERIAL
As supplemental material we provide three experimental procedures, concerning the electroencephalograph (EEG) recordings, Western blot analyses, and three-dimensional bioluminescence reconstruction, respectively, and five figures: Figure S1 shows example actograms of locomotor activity under constant dark conditions and sleep EEG recordings under baseline and sleep deprivation conditions demonstrating that sleep regulation and circadian rhythms in Per2Luc knock-in mice are not compromised by the knock-in construct. Figure S2 illustrates the three-dimensional reconstruction of bioluminescence source localization of peripheral PER2 protein. Figure S3 illustrates the protocol used to sample bioluminescence in living Per2Luc mice. Figure S4 presents PER2 Western blot analyses supporting the bioluminescence data in main Figure 1. Figure S5 shows rhythmicity in intact, sham, rhythmic, and arrhythmic SCN-lesioned Per2Luc mice with Nissl staining confirming the presence or absence of SCN.
EXPERIMENTAL PROCEDURES
Experimental Procedure 1: EEG Recording and Analysis in Per2Luc Mice
EEG and electromyograph (EMG) surgeries were performed according to the methods described previously1 with minor changes. Briefly, EEG and EMG electrodes were implanted under deep ketamine/xylazine anesthesia (intraperitoneal injection, 75 and 10 mg/kg, at a volume of 8 mL/kg). Two gold-plated screws (diameter 1.1 mm) served as EEG electrodes and were screwed into the skull over the right cerebral hemisphere (frontal: 1.7 mm lateral to midline, 1.5 mm anterior to bregma; parietal 1.7 mm lateral to midline, 1.0 mm anterior to lambda). Four additional screws were used as anchor screws. Two semi-rigid gold wires were used for EMG electrodes and were inserted into the neck musculature along the back of the skull. The four electrodes were soldered to a connector and cemented to the skull. After recovery from surgery (4–7 days) mice were connected to a swivel contact through recording leads to which they could habituate for 7 days prior to the experiment.
Per2Luc mice (n = 6 males, 3 mo old), were recorded for 96 continuous hours of which the first 48 h served as baseline followed by 6 h of sleep deprivation and recovery. EEG and EMG signals were amplified, filtered, and analog-to-digital converted (200 Hz). The behavioral states wakefulness (W), rapid eye movement sleep (REMS), and nonrapid eye movement sleep (NREMS) were visually assigned for consecutive 4-sec epochs as described previously.1 EEG signals were subjected to a discrete Fourier transform (DFT) to determine EEG power density in the delta frequency range (i.e., delta power, 1–4 Hz) for 4-sec epochs scored as NREMS. Differences in absolute levels of delta power among individuals were accounted for by expressing it as a percentage of the mean delta power over the last 4 h of the two baseline light periods. Delta power was averaged for 12 intervals to which an equal number of NREMS epochs contributed (i.e., percentiles) during the 12-h light periods, for six intervals during the 12-h dark periods, and for eight intervals during the 6 h immediately following sleep deprivation (recovery). Choice of the number of percentiles per recording segment depended on the amount of NREMS present.
Experimental Procedure 2: Western Blot Analyses
To assess changes in PER2 protein levels in brain and liver, mice were sleep deprived (ZT0–6) and then sacrificed together with their home-cage controls by cervical dislocation at ZT6, 8, and 12. Baseline levels were assessed also at ZT0 and 18 [males, 3 mo old, n = 2 and 3 / time point in B6 and homozygote mPer2Luc mice, respectively; total n = 40). Liver and brain tissues were dissected and frozen immediately on dry ice. Then, tissues were homogenized at 4°C for 30 min in RIPA lysis buffer (Tris-HCl 50 mM pH7.4; NaCl 150 mM; EDTA 1 mM; NP-40; Na-deoxycholate 10%; and one complete mini protease inhibitor mixture tablet for 50 mL, Roche, Basel, Switzerland) and homogenates were cleared by centrifugation for 10 min at 13,000 rpm and 4°C. Protein concentration was calculated using the bicinchoninic acid assay (Pierce, Rockford, IL, USA) with bovine serum albumin (BSA) as a reference. 100 μg of protein were then mixed with an equal volume of loading buffer (glycerol 20%; SDS 4%; Tris 100 mM; β-mercaptoethanol 5%; and bromophenol blue) before being heated to 98°C for 5 min. Proteins were loaded on 8% sodium dodecyl sulfate (SDS)-polyacrylamide gel electrophoresis and transferred on a nitrocellulose membrane (Merck-Milli-pore, Schaffhausen, Switzerland) in transfer buffer (Glycine 192mM, Tris 25mM and methanol 20%).
Membranes were then incubated with anti-mPER2 antibodies overnight at 4°C (for liver: rabbit anti-mPER2, 1:1000, generously provided by David Weaver, University of Massachusetts Medical School, Worchester, MA, USA); for brain: rabbit anti-mPER2, 1:5000; generously provided by Ueli Schibler, University of Geneva, Geneva, Switzerland). After washing, membranes were incubated with peroxidase-conjugated secondary anti-rabbit antibody (1:10000; Promega) 2 h at RT. Blots were then developed using electrochemoluminescence (ECL) substrate (Amersham Life Science, Piscataway, NJ, USA). Membranes were stripped with Restore blot stripping buffer (Pierce), washed and incubated 1 night at 4°C with rabbit polyclonal antitubulin (1:5000; Abcam, Cambridge, MA, USA) used as internal control. Quantification of the bands was carried out by densitometric analysis using ImageJ 1.33u software (Rasband WS, U.S. National Institutes of Health, Bethesda, Maryland, USA, http://imagej.nih.gov/ij/, 1997–2014).
Experimental Procedure 3: Three-Dimensional Reconstruction of Bioluminescence Source Localization
The source of bioluminescence from peripheral organs was localized using three-dimensional reconstruction (Living Image 3.0 software; Xenogen, Alameda, CA, USA; see Figure S2). Per2Luc mice (males, 3 mo of age, n = 4) were shaved completely. Three-dimensional reconstruction of the bioluminescence source was achieved by multiple images taken at 45° increments around the mouse. At each angle three readings were made with long-pass filters set at λ = 570, 600, and 660 nm, respectively, followed by a structured light image to determine the three-dimensional surface topography of each animal. With this information the Diffuse Luminescence Imaging Tomography (DLIT) algorithm (Igor image analysis software, Wavemetrics, Inc, Lake Oswego, OR, USA), which models photon transport in tissue, can localize photon source. For each view, surface topography is determined from phase shifts of parallel line patterns; i.e., structured light projected onto the surface. The partial surface meshes are then stitched together to produce a whole-animal surface mesh. This experiment was performed at ZT18 when PER2 protein expression in the periphery has been shown to be the highest.2
Circadian locomotor activity rhythms and sleep regulation in Per2Luc mice. (A) Double-plotted actograms of one Per2Luc (left) and one wild-type (right) male mice illustrating that the Per2Luc construct does not impact activity profiles both under LD12:12 and DD conditions. Dark periods shown in gray. Activity recorded with passive infrared (PIR) sensors. The Per2Luc genetic background is C57Bl/6J. (B) Mean (± 1 standard error of the mean) time course of electroencephalographic (EEG) delta power during nonrapid eye movement (NREM) sleep (left y-axis, upper graph) and time spent in NREM sleep (right y-axis, lower graph) recorded for 48 h baseline (hours 0–48), 6-h sleep deprivation (SLD; ZT0–6; hours 48–54), and 42-h recovery (hours 54–96). EEG delta power was expressed as a % of the last 4 h of the two baseline light periods to correct for interindividual difference in EEG amplitude and is depicted by gray circles connected by thin black lines. Time spent in NREM sleep was calculated in minutes per recording hour and depicted by open circles connected by thin black lines. Thicker gray lines represent the mean time course over the two baselines replotted for each of the 4 recording days facilitating the visual assessment of recovery-baseline differences. Gray areas delineate the 12 h dark periods. Red filled symbols mark intervals for which SLD and recovery values significantly deviated from corresponding baseline values (post hoc, paired t test, P < 0.05). Because only very little NREM sleep was present during the SLD, meaningful levels of EEG delta power during this state could not be determined during this period. EEG delta power quantifies the prevalence and amplitude of EEG delta oscillations (1–4 Hz) characteristic of NREM sleep. EEG delta power is in a quantitative and predictive relationship with time spent awake and asleep such that during NREM sleep following prolonged periods wakefulness (including SLD) EEG delta power is high whereas during times when NREM sleep prevails, it decreases. For this reason EEG delta power has been widely used as a measure of homeostatic sleep need and sleep depth. Dynamics of EEG delta power and time spent in NREM sleep in Per2Luc mice and the rebound in both variables after SLD were similar to those observed in C57Bl/6J mice3–5 [control data not shown here]. See supplementary material for EEG/EMG surgeries and analysis.
In vivo source localization of peripheral PER2 expression in Per2Luc mice. (A) Three-dimensional acquisition of bioluminescent signals was performed at ZT18 with different angular views (0–315° at 45° increments) to localize the bioluminescence source. Mini-pump introduced subcutaneously (white arrowheads in left-hand image) released luciferin in the periphery showing strongest signals in one ventral and two dorsal parts. After three-dimensional reconstitution (Living Image 3.0; Xenogen), strongest voxels were found to be superposed on the liver (ventral view) (B) and in the kidneys (dorsal view) (C). Note that the mini-pump releasing luciferin is also visible (two black arrowheads). (D) Mean (± 1 standard error of the mean) bioluminescence levels in brain (black), liver (brown), and kidney (green line) under baseline conditions taken daily at ZT3 for 21 days from the day of mini-pump implantation (i.e., day 0). The “experiment” window indicates the time frame (days 4–10) within which data were collected. Values were expressed as a percentage of the individual average bioluminescence during the days data were collected.
Actogram of double-plotted locomotor activity of one individual Per2Luc male under 12:12h light-dark conditions used to sample bioluminescence 15 times (red asterisks) over a 7-day period under baseline conditions (days 1–4: ZT0, 12, 3, 15, 6, 18, 9, 21) and before (day 6: ZT0, 6, 8, 12) and after a 6-h sleep deprivation (SLD; day 7: ZT6, 8, 12). Red diamond indicates time of mini-pump implantation. Gray areas delineates the dark period. Note that imaging did not importantly alter the nycthemeral organization of activity.
Western blot analysis of the effects of sleep deprivation and time of day on PER2 levels in brain and liver tissues. Whole brain protein extracts in C57BL/6J mice (A,B) and whole liver protein extracts in Per2Luc mice (C,D) at ZT0 (double plotted at ZT24), ZT6, ZT8, ZT12, and ZT18 during baseline conditions and 0, 2, and 6 h after a 6-h sleep deprivation (SLD; ZT0–6); i.e., at ZT6 (6-SLD), ZT8 (8-SLD), and ZT12 (12-SLD) were used. Protein extracts were incubated with antibodies against mPER2 and mTubulin as an internal control (A,C). Densitometric quantification of band intensity expressed as percentage of the 24-h baseline mean (B,D). Gray lines connect baseline level, black lines recovery from SLD, gray areas delineate the dark periods.
Actograms, periodograms, and histology for SCN-lesioned (SCNx) Per2Luc mice and their controls. (A) Double plot of locomotor activity for intact mice, sham-operated mice, and rhythmic and arrhythmic SCNx Per2Luc mice. Mice were recorded under 12:12h light-dark conditions for at least 16 days and under constant darkness for at least 17 days in order to verify rhythmicity of each animal. Red stars indicate the time corresponding to the surgery. In sham-operated mice electrodes were inserted but no electrical current was applied. Gray areas delineates the dark period. (B) Chi-square periodograms (ClockLab analysis software) for the four groups of mice. Gray line marks the chi-square 5% confidence level. Note that weak but significant circadian rhythmicity was observed in mice with partial SCNx (C). Also note different scaling of y-axes. (C) Coronal brain sections performed at two levels of the SCN (−0.46 and −0.82 mm with bregma as a reference according to reference 6) in the four groups of mice. Nissl staining in coronal brain section show the absence, partial, and entire presence of the SCN in SCNx-arrhythmic, SCNx-rhythmic, sham, and intact Per2Luc mice, respectively. f, fornix; opt, optic chiasm; PVN, paraventricular nucleus; SCh, SCN; 3V, third cerebral ventricle. Scale bar = 200 μm.
REFERENCES
- 1.Franken P, Malafosse A, Tafti M. Genetic variation in EEG activity during sleep in inbred mice. Am J Physiol. 1998;275:R1127–37. doi: 10.1152/ajpregu.1998.275.4.R1127. [DOI] [PubMed] [Google Scholar]
- 2.Reppert SM, Weaver DR. Coordination of circadian timing in mammals. Nature. 2002;418:935–41. doi: 10.1038/nature00965. [DOI] [PubMed] [Google Scholar]
- 3.Franken P, Malafosse A, Tafti M. Genetic determinants of sleep regulation in inbred mice. Sleep. 1999;22:155–69. [PubMed] [Google Scholar]
- 4.Franken P, Chollet D, Tafti M. The homeostatic regulation of sleep need is under genetic control. J Neurosci. 2001;21:2610–21. doi: 10.1523/JNEUROSCI.21-08-02610.2001. [DOI] [PMC free article] [PubMed] [Google Scholar]
- 5.Curie T, Mongrain V, Dorsaz S, Mang GM, Emmenegger Y, Franken P. Homeostatic and circadian contribution to EEG and molecular state variables of sleep regulation. Sleep. 2013;36:311–23. doi: 10.5665/sleep.2440. [DOI] [PMC free article] [PubMed] [Google Scholar]
- 6.Paxinos G, Franklin KBJ. The mouse brain in stereotaxic coordinates. 2nd ed. San Diego, CA: Academic Press; 2003. [Google Scholar]
REFERENCES
- 1.Dijk DJ, Franken P. Interaction of sleep homeostasis and circadian rhythmicity: dependent or independent systems? In: Meir H, Kryger MH, Roth T, Dement W, editors. Principles and practice of sleep medicine. 4th edition. Philadelphia, PA: Saunders/Elsevier; 2005. [Google Scholar]
- 2.Franken P. A role for clock genes in sleep homeostasis. Curr Opin Neurobiol. 2013;23:864–72. doi: 10.1016/j.conb.2013.05.002. [DOI] [PubMed] [Google Scholar]
- 3.Franken P, Lopez-Molina L, Marcacci L, Schibler U, Tafti M. The transcription factor DBP affects circadian sleep consolidation and rhythmic EEG activity. J Neurosci. 2000;20:617–25. doi: 10.1523/JNEUROSCI.20-02-00617.2000. [DOI] [PMC free article] [PubMed] [Google Scholar]
- 4.Hendricks JC, Lu S, Kume K, Yin JC, Yang Z, Sehgal A. Gender dimorphism in the role of cycle (BMAL1) in rest, rest regulation, and longevity in Drosophila melanogaster. J Biol Rhythms. 2003;18:12–25. doi: 10.1177/0748730402239673. [DOI] [PubMed] [Google Scholar]
- 5.Kopp C, Albrecht U, Zheng B, Tobler I. Homeostatic sleep regulation is preserved in mPer1 and mPer2 mutant mice. Eur J Neurosci. 2002;16:1099–106. doi: 10.1046/j.1460-9568.2002.02156.x. [DOI] [PubMed] [Google Scholar]
- 6.Naylor E, Bergmann BM, Krauski K, et al. The circadian clock mutation alters sleep homeostasis in the mouse. J Neurosci. 2000;20:8138–43. doi: 10.1523/JNEUROSCI.20-21-08138.2000. [DOI] [PMC free article] [PubMed] [Google Scholar]
- 7.Shaw PJ, Tononi G, Greenspan RJ, Robinson DF. Stress response genes protect against lethal effects of sleep deprivation in Drosophila. Nature. 2002;417:287–91. doi: 10.1038/417287a. [DOI] [PubMed] [Google Scholar]
- 8.Wisor JP, O'Hara BF, Terao A, et al. A role for cryptochromes in sleep regulation. BMC Neurosci. 2002;3:20. doi: 10.1186/1471-2202-3-20. [DOI] [PMC free article] [PubMed] [Google Scholar]
- 9.Laposky A, Easton A, Dugovic C, Walisser J, Bradfield C, Turek F. Deletion of the mammalian circadian clock gene BMAL1/Mop3 alters baseline sleep architecture and the response to sleep deprivation. Sleep. 2005;28:395–409. doi: 10.1093/sleep/28.4.395. [DOI] [PubMed] [Google Scholar]
- 10.Franken P, Dudley CA, Estill SJ, et al. NPAS2 as a transcriptional regulator of non-rapid eye movement sleep: genotype and sex interactions. Proc Natl Acad Sci U S A. 2006;103:7118–23. doi: 10.1073/pnas.0602006103. [DOI] [PMC free article] [PubMed] [Google Scholar]
- 11.He Y, Jones CR, Fujiki N, et al. The transcriptional repressor DEC2 regulates sleep length in mammals. Science. 2009;325:866–70. doi: 10.1126/science.1174443. [DOI] [PMC free article] [PubMed] [Google Scholar]
- 12.Viola AU, Archer SN, James LM, et al. PER3 polymorphism predicts sleep structure and waking performance. Curr Biol. 2007;17:613–8. doi: 10.1016/j.cub.2007.01.073. [DOI] [PubMed] [Google Scholar]
- 13.Mang GM, Franken P. Genetic dissection of sleep homeostasis. Curr Top Behav Neurosci. 2015;25:25–63. doi: 10.1007/7854_2013_270. [DOI] [PubMed] [Google Scholar]
- 14.Mongrain V, La Spada F, Curie T, Franken P. Sleep loss reduces the DNA-binding of BMAL1, CLOCK, and NPAS2 to specific clock genes in the mouse cerebral cortex. PloS One. 2011;6:e26622. doi: 10.1371/journal.pone.0026622. [DOI] [PMC free article] [PubMed] [Google Scholar]
- 15.Franken P, Thomason R, Heller HC, O'Hara BF. A non-circadian role for clock-genes in sleep homeostasis: a strain comparison. BMC Neurosci. 2007;8:87. doi: 10.1186/1471-2202-8-87. [DOI] [PMC free article] [PubMed] [Google Scholar]
- 16.Maret S, Dorsaz S, Gurcel L, et al. Homer1a is a core brain molecular correlate of sleep loss. Proc Natl Acad Sci U S A. 2007;104:20090–5. doi: 10.1073/pnas.0710131104. [DOI] [PMC free article] [PubMed] [Google Scholar]
- 17.Mongrain V, Hernandez SA, Pradervand S, et al. Separating the contribution of glucocorticoids and wakefulness to the molecular and electrophysiological correlates of sleep homeostasis. Sleep. 2010;33:1147–57. doi: 10.1093/sleep/33.9.1147. [DOI] [PMC free article] [PubMed] [Google Scholar]
- 18.Curie T, Mongrain V, Dorsaz S, Mang GM, Emmenegger Y, Franken P. Homeostatic and circadian contribution to EEG and molecular state variables of sleep regulation. Sleep. 2013;36:311–23. doi: 10.5665/sleep.2440. [DOI] [PMC free article] [PubMed] [Google Scholar]
- 19.Reppert SM, Weaver DR. Molecular analysis of mammalian circadian rhythms. Annu Rev Physiol. 2001;63:647–76. doi: 10.1146/annurev.physiol.63.1.647. [DOI] [PubMed] [Google Scholar]
- 20.Nishii K, Yamanaka I, Yasuda M, et al. Rhythmic post-transcriptional regulation of the circadian clock protein mPER2 in mammalian cells: a real-time analysis. Neurosci Lett. 2006;401:44–8. doi: 10.1016/j.neulet.2006.03.022. [DOI] [PubMed] [Google Scholar]
- 21.Tamanini F, Yagita K, Okamura H, van der Horst GT. Nucleocytoplasmic shuttling of clock proteins. Meth Enzymol. 2005;393:418–35. doi: 10.1016/S0076-6879(05)93020-6. [DOI] [PubMed] [Google Scholar]
- 22.Franken P, Malafosse A, Tafti M. Genetic determinants of sleep regulation in inbred mice. Sleep. 1999;22:155–69. [PubMed] [Google Scholar]
- 23.Franken P, Chollet D, Tafti M. The homeostatic regulation of sleep need is under genetic control. J Neurosci. 2001;21:2610–21. doi: 10.1523/JNEUROSCI.21-08-02610.2001. [DOI] [PMC free article] [PubMed] [Google Scholar]
- 24.Barclay JL, Husse J, Bode B, et al. Circadian desynchrony promotes metabolic disruption in a mouse model of shiftwork. PLoS One. 2012;7:e37150. doi: 10.1371/journal.pone.0037150. [DOI] [PMC free article] [PubMed] [Google Scholar]
- 25.Anafi RC, Pellegrino R, Shockley KR, Romer M, Tufik S, Pack AI. Sleep is not just for the brain: transcriptional responses to sleep in peripheral tissues. BMC Genomics. 2013;14:362. doi: 10.1186/1471-2164-14-362. [DOI] [PMC free article] [PubMed] [Google Scholar]
- 26.Moller-Levet CS, Archer SN, Bucca G, et al. Effects of insufficient sleep on circadian rhythmicity and expression amplitude of the human blood transcriptome. Proc Natl Acad Sci U S A. 2013;110:E1132–41. doi: 10.1073/pnas.1217154110. [DOI] [PMC free article] [PubMed] [Google Scholar]
- 27.Yoo SH, Yamazaki S, Lowrey PL, et al. PERIOD2::LUCIFERASE real-time reporting of circadian dynamics reveals persistent circadian oscillations in mouse peripheral tissues. Proc Natl Acad Sci U S A. 2004;101:5339–46. doi: 10.1073/pnas.0308709101. [DOI] [PMC free article] [PubMed] [Google Scholar]
- 28.Franken P, Dijk DJ, Tobler I, Borbely AA. Sleep deprivation in rats: effects on EEG power spectra, vigilance states, and cortical temperature. Am J Physiol. 1991;261:R198–208. doi: 10.1152/ajpregu.1991.261.1.R198. [DOI] [PubMed] [Google Scholar]
- 29.Abraham U, Prior JL, Granados-Fuentes D, Piwnica-Worms DR, Herzog ED. Independent circadian oscillations of Period1 in specific brain areas in vivo and in vitro. J Neurosci. 2005;25:8620–6. doi: 10.1523/JNEUROSCI.2225-05.2005. [DOI] [PMC free article] [PubMed] [Google Scholar]
- 30.Franken P, Dijk DJ. Circadian clock genes and sleep homeostasis. Eur J Neurosci. 2009;29:1820–9. doi: 10.1111/j.1460-9568.2009.06723.x. [DOI] [PubMed] [Google Scholar]
- 31.Reppert SM, Weaver DR. Coordination of circadian timing in mammals. Nature. 2002;418:935–41. doi: 10.1038/nature00965. [DOI] [PubMed] [Google Scholar]
- 32.Antle MC, Mistlberger RE. Circadian clock resetting by sleep deprivation without exercise in the Syrian hamster. J Neurosci. 2000;20:9326–32. doi: 10.1523/JNEUROSCI.20-24-09326.2000. [DOI] [PMC free article] [PubMed] [Google Scholar]
- 33.Deboer T, Detari L, Meijer JH. Long term effects of sleep deprivation on the mammalian circadian pacemaker. Sleep. 2007;30:257–62. doi: 10.1093/sleep/30.3.257. [DOI] [PubMed] [Google Scholar]
- 34.Millar AJ, Short SR, Chua NH, Kay SA. A novel circadian phenotype based on firefly luciferase expression in transgenic plants. Plant Cell. 1992;4:1075–87. doi: 10.1105/tpc.4.9.1075. [DOI] [PMC free article] [PubMed] [Google Scholar]
- 35.Kondo T, Strayer CA, Kulkarni RD, et al. Circadian rhythms in prokaryotes: luciferase as a reporter of circadian gene expression in cyanobacteria. Proc Natl Acad Sci U S A. 1993;90:5672–6. doi: 10.1073/pnas.90.12.5672. [DOI] [PMC free article] [PubMed] [Google Scholar]
- 36.Welsh DK, Yoo SH, Liu AC, Takahashi JS, Kay SA. Bioluminescence imaging of individual fibroblasts reveals persistent, independently phased circadian rhythms of clock gene expression. Curr Biol. 2004;14:2289–95. doi: 10.1016/j.cub.2004.11.057. [DOI] [PMC free article] [PubMed] [Google Scholar]
- 37.Nagoshi E, Saini C, Bauer C, Laroche T, Naef F, Schibler U. Circadian gene expression in individual fibroblasts: cell-autonomous and self-sustained oscillators pass time to daughter cells. Cell. 2004;119:693–705. doi: 10.1016/j.cell.2004.11.015. [DOI] [PubMed] [Google Scholar]
- 38.Yamaguchi S, Kobayashi M, Mitsui S, et al. View of a mouse clock gene ticking. Nature. 2001;409:684. doi: 10.1038/35055628. [DOI] [PubMed] [Google Scholar]
- 39.Tahara Y, Kuroda H, Saito K, et al. In vivo monitoring of peripheral circadian clocks in the mouse. Curr Biol. 2012;22:1029–34. doi: 10.1016/j.cub.2012.04.009. [DOI] [PubMed] [Google Scholar]
- 40.Saini C, Liani A, Curie T, et al. Real-time recording of circadian liver gene expression in freely moving mice reveals the phase-setting behavior of hepatocyte clocks. Genes Dev. 2013;27:1526–36. doi: 10.1101/gad.221374.113. [DOI] [PMC free article] [PubMed] [Google Scholar]
- 41.Yan L, Silver R. Resetting the brain clock: time course and localization of mPER1 and mPER2 protein expression in suprachiasmatic nuclei during phase shifts. Eur J Neurosci. 2004;19:1105–9. doi: 10.1111/j.1460-9568.2004.03189.x. [DOI] [PMC free article] [PubMed] [Google Scholar]
- 42.Mateju K, Bendova Z, El-Hennamy R, Sladek M, Sosniyenko S, Sumova A. Development of the light sensitivity of the clock genes Period1 and Period2, and immediate-early gene c-fos within the rat suprachiasmatic nucleus. Eur J Neurosci. 2009;29:490–501. doi: 10.1111/j.1460-9568.2009.06609.x. [DOI] [PubMed] [Google Scholar]
- 43.Segall LA, Amir S. Exogenous corticosterone induces the expression of the clock protein, PERIOD2, in the oval nucleus of the bed nucleus of the stria terminalis and the central nucleus of the amygdala of adrenalectomized and intact rats. J Mol Neurosci. 2010;42:176–82. doi: 10.1007/s12031-010-9375-4. [DOI] [PubMed] [Google Scholar]
- 44.Noback CR, Ruggiero DA, Demarest RJ, Strominger NL. Totowa, NJ, USA: Humana Press; 2005. The human nervous system: structure and function. [Google Scholar]
- 45.Masubuchi S, Honma S, Abe H, et al. Clock genes outside the suprachiasmatic nucleus involved in manifestation of locomotor activity rhythm in rats. Eur J Neurosci. 2000;12:4206–14. [PubMed] [Google Scholar]
- 46.Wakamatsu H, Yoshinobu Y, Aida R, Moriya T, Akiyama M, Shibata S. Restricted-feeding-induced anticipatory activity rhythm is associated with a phase-shift of the expression of mPer1 and mPer2 mRNA in the cerebral cortex and hippocampus but not in the suprachiasmatic nucleus of mice. Eur J Neurosci. 2001;13:1190–6. doi: 10.1046/j.0953-816x.2001.01483.x. [DOI] [PubMed] [Google Scholar]
- 47.Pezuk P, Mohawk JA, Yoshikawa T, Sellix MT, Menaker M. Circadian organization is governed by extra-SCN pacemakers. J Biol Rhythms. 2010;25:432–41. doi: 10.1177/0748730410385204. [DOI] [PubMed] [Google Scholar]
- 48.Abe H, Honma S, Namihira M, Masubuchi S, Honma K. Behavioural rhythm splitting in the CS mouse is related to clock gene expression outside the suprachiasmatic nucleus. Eur J Neurosci. 2001;14:1121–8. doi: 10.1046/j.0953-816x.2001.01732.x. [DOI] [PubMed] [Google Scholar]
- 49.Dudley CA, Erbel-Sieler C, Estill SJ, et al. Altered patterns of sleep and behavioral adaptability in NPAS2-deficient mice. Science. 2003;301:379–83. doi: 10.1126/science.1082795. [DOI] [PubMed] [Google Scholar]
- 50.Tu BP, McKnight SL. Metabolic cycles as an underlying basis of biological oscillations. Nat Rev Mol Cell Biol. 2006;7:696–701. doi: 10.1038/nrm1980. [DOI] [PubMed] [Google Scholar]
- 51.Krueger JM, Rector DM, Roy S, Van Dongen HP, Belenky G, Panksepp J. Sleep as a fundamental property of neuronal assemblies. Nat Rev Neurosci. 2008;9:910–9. doi: 10.1038/nrn2521. [DOI] [PMC free article] [PubMed] [Google Scholar]
- 52.Jones BE. Arousal systems. Front Biosci. 2003;8:s438–51. doi: 10.2741/1074. [DOI] [PubMed] [Google Scholar]
- 53.Borgs L, Beukelaers P, Vandenbosch R, et al. Period 2 regulates neural stem/progenitor cell proliferation in the adult hippocampus. BMC Neurosci. 2009;10:30. doi: 10.1186/1471-2202-10-30. [DOI] [PMC free article] [PubMed] [Google Scholar]
- 54.Shieh KR, Yang SC, Lu XY, Akil H, Watson SJ. Diurnal rhythmic expression of the rhythm-related genes, rPeriod1, rPeriod2, and rClock, in the rat brain. J Biomed Sci. 2005;12:209–17. doi: 10.1007/s11373-004-8176-6. [DOI] [PubMed] [Google Scholar]
- 55.Mendoza J, Pevet P, Felder-Schmittbuhl MP, Bailly Y, Challet E. The cerebellum harbors a circadian oscillator involved in food anticipation. J Neurosci. 2010;30:1894–904. doi: 10.1523/JNEUROSCI.5855-09.2010. [DOI] [PMC free article] [PubMed] [Google Scholar]
- 56.Rath MF, Rovsing L, Moller M. Circadian oscillators in the mouse brain: molecular clock components in the neocortex and cerebellar cortex. Cell Tissue Res. 2014;357:743–55. doi: 10.1007/s00441-014-1878-9. [DOI] [PubMed] [Google Scholar]
- 57.Guo H, Brewer JM, Champhekar A, Harris RB, Bittman EL. Differential control of peripheral circadian rhythms by suprachiasmatic-dependent neural signals. Proc Natl Acad Sci U S A. 2005;102:3111–6. doi: 10.1073/pnas.0409734102. [DOI] [PMC free article] [PubMed] [Google Scholar]
- 58.Franken P, Tobler I, Borbely AA. Sleep and waking have a major effect on the 24-hr rhythm of cortical temperature in the rat. J Biol Rhythms. 1992;7:341–52. doi: 10.1177/074873049200700407. [DOI] [PubMed] [Google Scholar]
- 59.Maquet P. Sleep function(s) and cerebral metabolism. Behav Brain Res. 1995;69:75–83. doi: 10.1016/0166-4328(95)00017-n. [DOI] [PubMed] [Google Scholar]
- 60.Hobson JA. Sleep is of the brain, by the brain and for the brain. Nature. 2005;437:1254–6. doi: 10.1038/nature04283. [DOI] [PubMed] [Google Scholar]
- 61.Tononi G, Cirelli C. Sleep function and synaptic homeostasis. Sleep Med Rev. 2006;10:49–62. doi: 10.1016/j.smrv.2005.05.002. [DOI] [PubMed] [Google Scholar]
- 62.Spiegel K, Tasali E, Leproult R, Van Cauter E. Effects of poor and short sleep on glucose metabolism and obesity risk. Nat Rev Endocrinol. 2009;5:253–61. doi: 10.1038/nrendo.2009.23. [DOI] [PMC free article] [PubMed] [Google Scholar]
- 63.Besedovsky L, Lange T, Born J. Sleep and immune function. Pflugers Arch. 2012;463:121–37. doi: 10.1007/s00424-011-1044-0. [DOI] [PMC free article] [PubMed] [Google Scholar]
- 64.Kornmann B, Schaad O, Bujard H, Takahashi JS, Schibler U. System-driven and oscillator-dependent circadian transcription in mice with a conditionally active liver clock. PLoS Biol. 2007;5:e34. doi: 10.1371/journal.pbio.0050034. [DOI] [PMC free article] [PubMed] [Google Scholar]
- 65.Bass J, Takahashi JS. Circadian integration of metabolism and energetics. Science. 2010;330:1349–54. doi: 10.1126/science.1195027. [DOI] [PMC free article] [PubMed] [Google Scholar]
- 66.Sadacca LA, Lamia KA, deLemos AS, Blum B, Weitz CJ. An intrinsic circadian clock of the pancreas is required for normal insulin release and glucose homeostasis in mice. Diabetologia. 2011;54:120–4. doi: 10.1007/s00125-010-1920-8. [DOI] [PMC free article] [PubMed] [Google Scholar]
- 67.Zani F, Breasson L, Becattini B, et al. PER2 promotes glucose storage to liver glycogen during feeding and acute fasting by inducing Gys2 PTG and G L expression. Mol Metab. 2013;2:292–305. doi: 10.1016/j.molmet.2013.06.006. [DOI] [PMC free article] [PubMed] [Google Scholar]
Associated Data
This section collects any data citations, data availability statements, or supplementary materials included in this article.
Supplementary Materials
Circadian locomotor activity rhythms and sleep regulation in Per2Luc mice. (A) Double-plotted actograms of one Per2Luc (left) and one wild-type (right) male mice illustrating that the Per2Luc construct does not impact activity profiles both under LD12:12 and DD conditions. Dark periods shown in gray. Activity recorded with passive infrared (PIR) sensors. The Per2Luc genetic background is C57Bl/6J. (B) Mean (± 1 standard error of the mean) time course of electroencephalographic (EEG) delta power during nonrapid eye movement (NREM) sleep (left y-axis, upper graph) and time spent in NREM sleep (right y-axis, lower graph) recorded for 48 h baseline (hours 0–48), 6-h sleep deprivation (SLD; ZT0–6; hours 48–54), and 42-h recovery (hours 54–96). EEG delta power was expressed as a % of the last 4 h of the two baseline light periods to correct for interindividual difference in EEG amplitude and is depicted by gray circles connected by thin black lines. Time spent in NREM sleep was calculated in minutes per recording hour and depicted by open circles connected by thin black lines. Thicker gray lines represent the mean time course over the two baselines replotted for each of the 4 recording days facilitating the visual assessment of recovery-baseline differences. Gray areas delineate the 12 h dark periods. Red filled symbols mark intervals for which SLD and recovery values significantly deviated from corresponding baseline values (post hoc, paired t test, P < 0.05). Because only very little NREM sleep was present during the SLD, meaningful levels of EEG delta power during this state could not be determined during this period. EEG delta power quantifies the prevalence and amplitude of EEG delta oscillations (1–4 Hz) characteristic of NREM sleep. EEG delta power is in a quantitative and predictive relationship with time spent awake and asleep such that during NREM sleep following prolonged periods wakefulness (including SLD) EEG delta power is high whereas during times when NREM sleep prevails, it decreases. For this reason EEG delta power has been widely used as a measure of homeostatic sleep need and sleep depth. Dynamics of EEG delta power and time spent in NREM sleep in Per2Luc mice and the rebound in both variables after SLD were similar to those observed in C57Bl/6J mice3–5 [control data not shown here]. See supplementary material for EEG/EMG surgeries and analysis.
In vivo source localization of peripheral PER2 expression in Per2Luc mice. (A) Three-dimensional acquisition of bioluminescent signals was performed at ZT18 with different angular views (0–315° at 45° increments) to localize the bioluminescence source. Mini-pump introduced subcutaneously (white arrowheads in left-hand image) released luciferin in the periphery showing strongest signals in one ventral and two dorsal parts. After three-dimensional reconstitution (Living Image 3.0; Xenogen), strongest voxels were found to be superposed on the liver (ventral view) (B) and in the kidneys (dorsal view) (C). Note that the mini-pump releasing luciferin is also visible (two black arrowheads). (D) Mean (± 1 standard error of the mean) bioluminescence levels in brain (black), liver (brown), and kidney (green line) under baseline conditions taken daily at ZT3 for 21 days from the day of mini-pump implantation (i.e., day 0). The “experiment” window indicates the time frame (days 4–10) within which data were collected. Values were expressed as a percentage of the individual average bioluminescence during the days data were collected.
Actogram of double-plotted locomotor activity of one individual Per2Luc male under 12:12h light-dark conditions used to sample bioluminescence 15 times (red asterisks) over a 7-day period under baseline conditions (days 1–4: ZT0, 12, 3, 15, 6, 18, 9, 21) and before (day 6: ZT0, 6, 8, 12) and after a 6-h sleep deprivation (SLD; day 7: ZT6, 8, 12). Red diamond indicates time of mini-pump implantation. Gray areas delineates the dark period. Note that imaging did not importantly alter the nycthemeral organization of activity.
Western blot analysis of the effects of sleep deprivation and time of day on PER2 levels in brain and liver tissues. Whole brain protein extracts in C57BL/6J mice (A,B) and whole liver protein extracts in Per2Luc mice (C,D) at ZT0 (double plotted at ZT24), ZT6, ZT8, ZT12, and ZT18 during baseline conditions and 0, 2, and 6 h after a 6-h sleep deprivation (SLD; ZT0–6); i.e., at ZT6 (6-SLD), ZT8 (8-SLD), and ZT12 (12-SLD) were used. Protein extracts were incubated with antibodies against mPER2 and mTubulin as an internal control (A,C). Densitometric quantification of band intensity expressed as percentage of the 24-h baseline mean (B,D). Gray lines connect baseline level, black lines recovery from SLD, gray areas delineate the dark periods.
Actograms, periodograms, and histology for SCN-lesioned (SCNx) Per2Luc mice and their controls. (A) Double plot of locomotor activity for intact mice, sham-operated mice, and rhythmic and arrhythmic SCNx Per2Luc mice. Mice were recorded under 12:12h light-dark conditions for at least 16 days and under constant darkness for at least 17 days in order to verify rhythmicity of each animal. Red stars indicate the time corresponding to the surgery. In sham-operated mice electrodes were inserted but no electrical current was applied. Gray areas delineates the dark period. (B) Chi-square periodograms (ClockLab analysis software) for the four groups of mice. Gray line marks the chi-square 5% confidence level. Note that weak but significant circadian rhythmicity was observed in mice with partial SCNx (C). Also note different scaling of y-axes. (C) Coronal brain sections performed at two levels of the SCN (−0.46 and −0.82 mm with bregma as a reference according to reference 6) in the four groups of mice. Nissl staining in coronal brain section show the absence, partial, and entire presence of the SCN in SCNx-arrhythmic, SCNx-rhythmic, sham, and intact Per2Luc mice, respectively. f, fornix; opt, optic chiasm; PVN, paraventricular nucleus; SCh, SCN; 3V, third cerebral ventricle. Scale bar = 200 μm.