

Abstract
Objectives:
To evaluate changes in regional cerebral blood flow (rCBF) during wakeful rest in older subjects with mild to severe obstructive sleep apnea (OSA) and healthy controls, and to identify markers of OSA severity that predict altered rCBF.
Design:
High-resolution 99mTc-HMPAO SPECT imaging during wakeful rest.
Setting:
Research sleep laboratory affiliated with a University hospital.
Participants:
Fifty untreated OSA patients aged between 55 and 85 years, divided into mild, moderate, and severe OSA, and 20 age-matched healthy controls.
Interventions:
N/A.
Measurements:
Using statistical parametric mapping, rCBF was compared between groups and correlated with clinical, respiratory, and sleep variables.
Results:
Whereas no rCBF change was observed in mild and moderate groups, participants with severe OSA had reduced rCBF compared to controls in the left parietal lobules, left precentral gyrus, bilateral postcentral gyri, and right precuneus. Reduced rCBF in these regions and in areas of the bilateral frontal and left temporal cortex was associated with more hypopneas, snoring, hypoxemia, and sleepiness. Higher apnea, microarousal, and body mass indexes were correlated to increased rCBF in the basal ganglia, insula, and limbic system.
Conclusions:
While older individuals with severe obstructive sleep apnea (OSA) had hypoperfusion in the sensorimotor and parietal areas, respiratory variables and subjective sleepiness were correlated with extended regions of hypoperfusion in the lateral cortex. Interestingly, OSA severity, sleep fragmentation, and obesity correlated with increased perfusion in subcortical and medial cortical regions. Anomalies with such a distribution could result in cognitive deficits and reflect impaired vascular regulation, altered neuronal integrity, and/or undergoing neurodegenerative processes.
Citation:
Baril AA, Gagnon K, Arbour C, Soucy JP, Montplaisir J, Gagnon JF, Gosselin N. Regional cerebral blood flow during wakeful rest in older subjects with mild to severe obstructive sleep apnea. SLEEP 2015;38(9):1439–1449.
Keywords: obstructive sleep apnea, SPECT, regional cerebral blood flow, cerebral perfusion, neuroimaging, aging, snoring
INTRODUCTION
Obstructive sleep apnea (OSA) is a respiratory disorder characterized by repetitive pharyngeal collapses during sleep, causing snoring and transitory cessation (apneas) or reduction (hypopneas) of airflow amplitude, which result in intermittent hypoxemia.1,2 During these respiratory events, a profound increase in cerebral blood flow (CBF) is initially observed followed by an important decrease below resting values.3 Respiratory events generally end with a cortical arousal, which causes sleep fragmentation and further hemodynamic changes through an elevation of sympathetic tone.4 Hypoxemia and nocturnal CBF fluctuations lead to cerebral hypoxia and neuronal, glial, and endothelial damage.5–8 Thus, altered cerebral perfusion, changes in vascular function, sleep fragmentation, and cellular damage may explain why OSA has been linked to excessive daytime sleepiness, cognitive deficits, and increased risk of cerebrovascular diseases.1,9–12
So far, few neuroimaging studies have been performed in subjects with OSA during wakeful rest to estimate the impact of nocturnal respiratory events on brain functions. Among them, studies using transcranial Doppler have shown that OSA individuals have impaired vascular regulation during wakefulness.3,13–15 Studies using magnetic resonance imaging (MRI) and emission tomography techniques have shown that OSA affects brain regions differently. In fact, one study using arterial spin labeling showed reduced regional CBF (rCBF) in several white matter tracts involved in the coordination of respiratory musculature, autonomic regulation, and cognition.16 Furthermore, using single photon emission computed tomography (SPECT) or positron emission tomography (PET) combined to a statistical parametric mapping (SPM) approach, four studies investigated gray matter rCBF or glucose metabolism in untreated OSA individuals. Combined, these studies observed hypoperfusion or hypometabolism in the prefrontal cortex, the sensorimotor areas, the limbic system, the parietal lobes, the superior temporal cortex, and the anterior occipital cortex.17–20
Although interesting, these studies show great inconsistencies regarding the cerebral regions affected in OSA, possibly due to methodological variability including the use of different apnea-hypopnea index (AHI) thresholds for OSA diagnosis (varied between 10 to 30 events/h), different cardiovascular exclusion criteria, sample sizes (≤ 30 subjects in 3 of the 4 published SPECT and PET studies), and different statistical thresholds for neuroimaging results. In addition, most neuroimaging studies have focused on middle-aged adults with severe OSA, and therefore older patients, especially those with mild or moderate OSA, are generally not investigated. Considering that the prevalence of OSA increases from 2% to 14% in the middle-aged adult population to 32% to 42% in individuals over 60 years of age,21 studying the impact of OSA in this age group is of utmost importance. In addition to presenting reduction in total CBF,22 findings from an animal study suggest that older individuals could be more vulnerable to intermittent hypoxia,23 which may lead to a more severe impact of OSA on brain function. Accordingly, brain perfusion changes during wakeful rest could be observed not only in severe OSA, but also in milder forms of OSA.
The present study aimed at evaluating rCBF as a measure of brain function during wakeful rest using Technetium-99m Hexa-methyl-amino-propyleneamine-oxime (99mTc-HMPAO) high-resolution SPECT in newly diagnosed and untreated mild, moderate, and severe OSA patients aged from 55 to 85 years and comparing them to controls without OSA. The novelty of the present study lies in the fact that a large sample was investigated to verify whether the pattern of reduced regional brain perfusion previously described in middle-aged OSA individuals would be observed in older subjects. This large sample size allowed us to divide our groups according to severity, which has not been done in previous studies. Another strength and novelty of this study was the high-resolution NeuroFOCUS SPECT scanner used, which provides 2.5 mm spatial resolution contrary to standard SPECT scanner (spatial resolution of 6–15 mm), enabling perfusion measurement in smaller regions. We hypothesized that OSA of mild or moderate severity in older subjects would be associated with reduced perfusion in cerebral regions previously reported as abnormal in middle-aged OSA patients. More specifically, these areas of hypoperfusion could be observed concomitantly in regions sensitive to hypoxemia (prefrontal cortex and hippocampus)24,25 and in regions showing relative hypoperfusion in normal aging (limbic system and association cortex, especially frontal lobes).26 Another novel aspect of the present study is that we assessed the relationship between rCBF and several markers of OSA severity. We hypothesized that more severe levels of OSA (more respiratory events, lower oxygen saturation, and more fragmented sleep), daytime sleepiness, and the presence of cardiovascular comorbidities as well as obesity would predict abnormal rCBF.
METHODS
Sample
Seventy subjects aged between 55 and 85 years (mean age: 64.5 ± 6.7; 15 females) were recruited from the pulmonary department of the Hôpital du Sacré-Coeur de Montréal and by ads in local newspapers. Participants with one or more of the following conditions were excluded: (1) central nervous system disorders (e.g. dementia, neurological diseases, traumatic brain injury, epilepsy); (2) uncontrolled diabetes or hypertension; (3) treatment with continuous positive airway pressure or other types of treatment such as a mandibular advancement device; (4) body mass index (BMI) > 40 kg/m2; (5) use of medication, drugs, or natural products known to influence cognition, cerebral functioning, sleep, and/or affect; and (6) history of stroke (patients with a history of transient ischemic attacks were not excluded), sleep disorders other than OSA, or any major psychiatric disorders or pulmonary diseases. Written consent was obtained from each participant, and the research protocol was approved by the ethics committee of the Hôpital du Sacré-Coeur de Montréal.
Questionnaires
Beck Depression Inventory-II27 and Beck Anxiety Inventory28 were used to document depression and anxiety symptoms. All participants were assessed for subjective daytime sleepiness using the Epworth Sleepiness Scale.29 Vascular risk factors and comorbidities were assessed using the Vascular Burden Index developed and validated by Villeneuve et al.30,31 This questionnaire screens for the presence of hypertension, hypotension, hypercholesterolemia/dyslipidemia, coronary diseases (angina pectoris, myocardial infarction, coronary artery bypass), transitory ischemic attack, diabetes, arrhythmia, and carotid stenosis, with a maximum total score of 8 points. Presence of these risk factors was based on previous medical observations.
Polysomnographic Recording
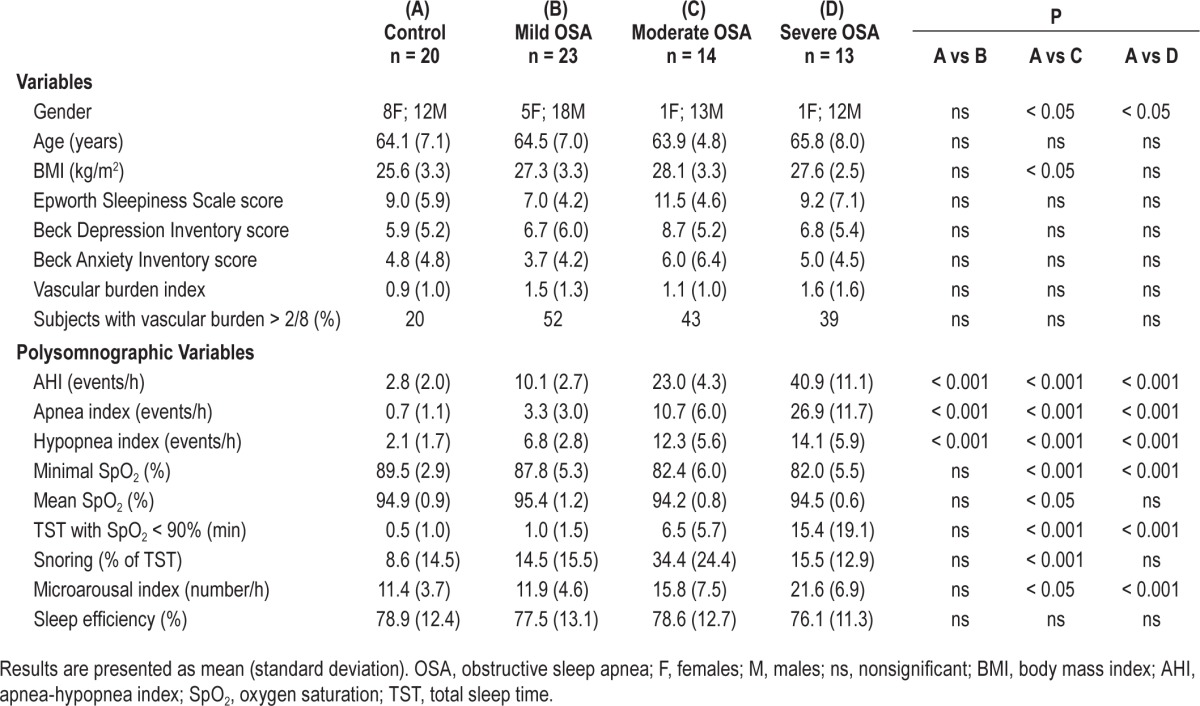
All participants underwent a polysomnographic recording that used measurements from thoraco-abdominal strain gauges, an oronasal canula, and a transcutaneous finger pulse oximeter to measure oxygen saturation. Electroencephalographic sleep recordings were performed using an 18-channel montage accompanied by an electrooculogram, electromyogram on the chin and legs, and electrocardiogram. An apneic episode was defined as total cessation of airflow lasting ≥ 10 s. A hypopneic episode was defined as a reduction in airflow ≥ 30% from baseline lasting ≥ 10 s and accompanied by an oxygen desaturation ≥ 3% or accompanied by an episode of arousal.32 The sum of apnea and hypopnea episodes divided by the number of hours of sleep provides the AHI. Sleep was recorded and scored by an experienced electrophysiology technician according to standard methods.33 For comparison purposes, based on published criteria,1 participants were categorized in three groups consisting of mild (AHI > 5 and ≤ 15), moderate (AHI > 15 and ≤ 30), and severe OSA (> 30). Participants with AHI ≤ 5 were considered as controls. Polysomnographic results are shown in Table 1 for all groups.
Table 1.
Demographic, clinical, and polysomnographic variables for control subjects and OSA groups.
99mTc-HMPAO SPECT Image Acquisition
All participants underwent a daytime 99mTc-HMPAO SPECT study during wakeful rest with a high-resolution brain-dedicated scanner (NeuroFOCUS, NeuroPhysics, Shirley, MA, USA) providing a 2.5 mm full-width half-maximum (FWHM) spatial resolution. This resolution allows accurate evaluation of perfusion distribution in much smaller brain regions than with conventional 2- or 3-headed gamma camera-based SPECT scanners. A dose of 750 MBq of 99mTc-HMPAO prepared in the morning of testing was administered followed by a saline flush of 30 cc while the subject lay awake on a stretcher with their eyes closed. A static, 30-min acquisition was performed 20 minutes later. Thirty-two slices were reconstructed on a 128 × 128 matrix using a filtered back projection, and an attenuation correction was performed using Chang's method with a coefficient of 0.01/cm. Reconstructed voxel size was 1.56 mm3. This SPECT system does not allow for recording of the whole cerebellum in most subjects, and the cerebellar region was excluded from analysis. SPECT acquisitions were performed between 10:15 and 15:00 hours and were on average obtained 25.2 ± 23.1 days after the polysomnographic recording.
Image Analysis
All SPECT images were evaluated visually for abnormalities. Using SPM8 (Statistical Parametric Mapping 8, Well-come Department of Imaging Neurosciences, Institute of Neurology, University College London, UK) with MatLab (version 7.3, The MathWorks, Natick, MA, USA), individual SPECT studies were registered and spatially normalized to the standard SPECT template included in the SPM8 software. Then, normalized images were smoothed using a 14-mm FWHM Gaussian filter. A proportional scaling normalization was used during analyses between images for their individual global mean signal. Thus, final regional results are relative to the mean global signal of CBF. Voxel size of the final images was 2.0 × 2.0 × 2.0 mm.
Statistical Analysis
Descriptive statistics were performed for all study variables with STATISTICA 10.0 (Statsoft Inc., Tulsa, USA). Chi-square and t-tests were used, with a statistical significance of P < 0.05 to compare controls to OSA subjects in relation to their demographic, clinical, and polysomnographic variables. For the first research objective, group differences in rCBF distribution were assessed using SPM8 (two-sample t-tests between healthy controls and each OSA group), corrected for multiple comparisons using false discovery rate (FDR)34 at P < 0.05 with an extent threshold of 50 contiguous significant voxels across all gray matter, as previously described in Joo and al.17 In order to compare our results with other published imaging studies performed in subjects with OSA,19,20 a less stringent significance level with a height threshold of P < 0.001 uncorrected was also used. However, we then increased the extent requirement to 200 contiguous significant voxels in order to reduce the false positive rate. For the second objective, rCBF was correlated with all participants' respiratory events (AHI, apnea index, hypopnea index), oxygen saturation (minimum, mean, total sleep time spent under 90%), proportion of sleep time spent snoring, sleep efficiency, microarousal index, Epworth Sleepiness Score, BMI, and vascular burden index. All correlations (multiple regression design) were done with age as a nuisance covariant, and the same two statistical thresholds mentioned before were used. The creation of a gray matter mask and the identification of significant regions (ICBM atlas) were performed with the software PickAtlas software (version 3.0, ANSIR Laboratory, Wake Forest University School of Medicine, NC, USA). Resulting regions were superimposed on the SPECT template available in the SPM8 package. Figures were realized with the MRIcron software (Analyze viewer, Chris Rorden, PhD, Neuropsychology Lab, Columbia, SC, USA).
RESULTS
Demographic, Clinical, and Polysomnographic Variables across Groups
Twenty-three subjects had mild OSA, 14 subjects had moderate OSA, and 13 subjects had severe OSA—for a total of 50 OSA subjects who were compared to 20 controls (see Table 1 for group's demographic, clinical, and polysomnographic characteristics and statistics). No differences in age, levels of subjective daytime sleepiness, depression, anxiety, vascular burden, or sleep efficiency were found between groups.
Group Difference for rCBF
Compared to controls, participants of the severe OSA group had decreased rCBF within a large cluster of voxels of the left hemisphere that includes the precentral and postcentral gyri and the superior and inferior parietal lobules (P < 0.05 corrected with FDR, see Table 2 and Figure 1). Additional regions of hypoperfusion were found in severe OSA patients compared to controls using uncorrected threshold of P < 0.001: namely the right postcentral gyrus and the right precuneus. Mild and moderate OSA groups showed no significant differences in rCBF with either statistical threshold when compared to controls. No regions of increased rCBF were found in OSA groups in comparison to healthy controls.
Table 2.
Hypoperfused regions in severe OSA compared to control subjects.
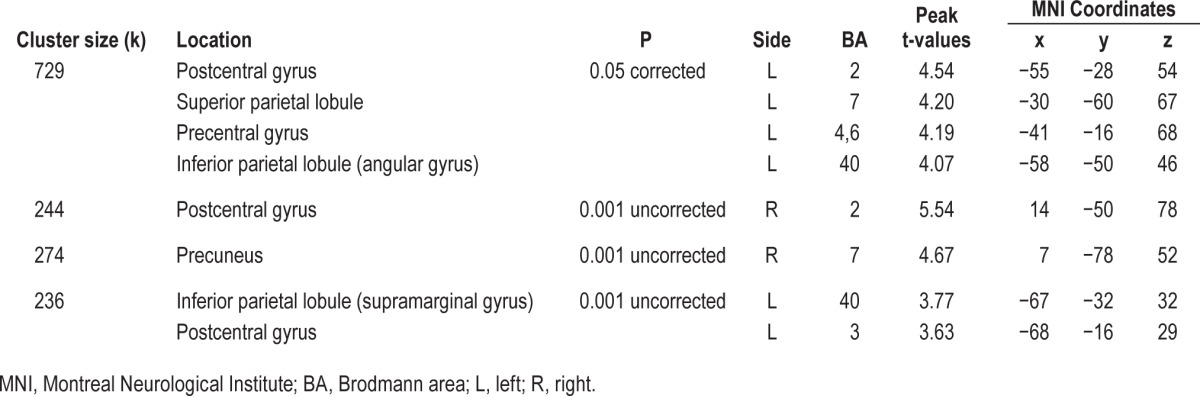
Figure 1.
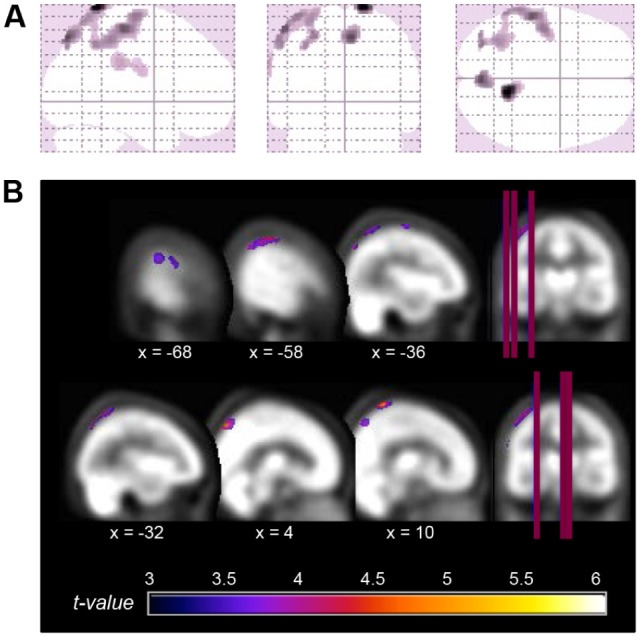
Location of the significant reductions in regional cerebral blood flow (rCBF) in severe obstructive sleep apnea (OSA) subjects compared with controls. (A) Glass view of the significant clusters and (B) overlays of significant regions on the SPECT template. Hypoperfusions were found in the left superior and inferior parietal lobules, the left precentral gyrus, bilateral postcentral gyri, and right precuneus gyrus. Left side of images represents the left hemisphere of the brain.
Correlation Analyses between rCBF and OSA-Related Variables
In the correlational analysis including all subjects with or without OSA, several hypoperfusion foci were associated with increased disease severity (Table 3 and Figure 2). Among the significant correlations observed, we found that higher AHI and higher hypopnea index were associated with hypoperfusion in the lateral portions of the left frontal (inferior and middle frontal gyri), sensorimotor (precentral and postcentral gyri), temporal (middle temporal gyrus), and parietal lobe (inferior parietal lobule), in addition to the right precuneus. A higher proportion of sleep spent snoring was associated with hypoperfusion in the left anterior parahippocampal gyrus, the anterior pole of the temporal lobe, and the inferior frontal gyrus. Hypoxemia, and more specifically the time spent with oxygen saturation below 90%, was correlated with reduced rCBF in the left dorsolateral prefrontal cortex, while subjective sleepiness measured by the Epworth Sleepiness Scale was associated with hypoperfused bilateral dorsomedial prefrontal cortex.
Table 3.
Location of hypoperfused regions associated with OSA-related variables.
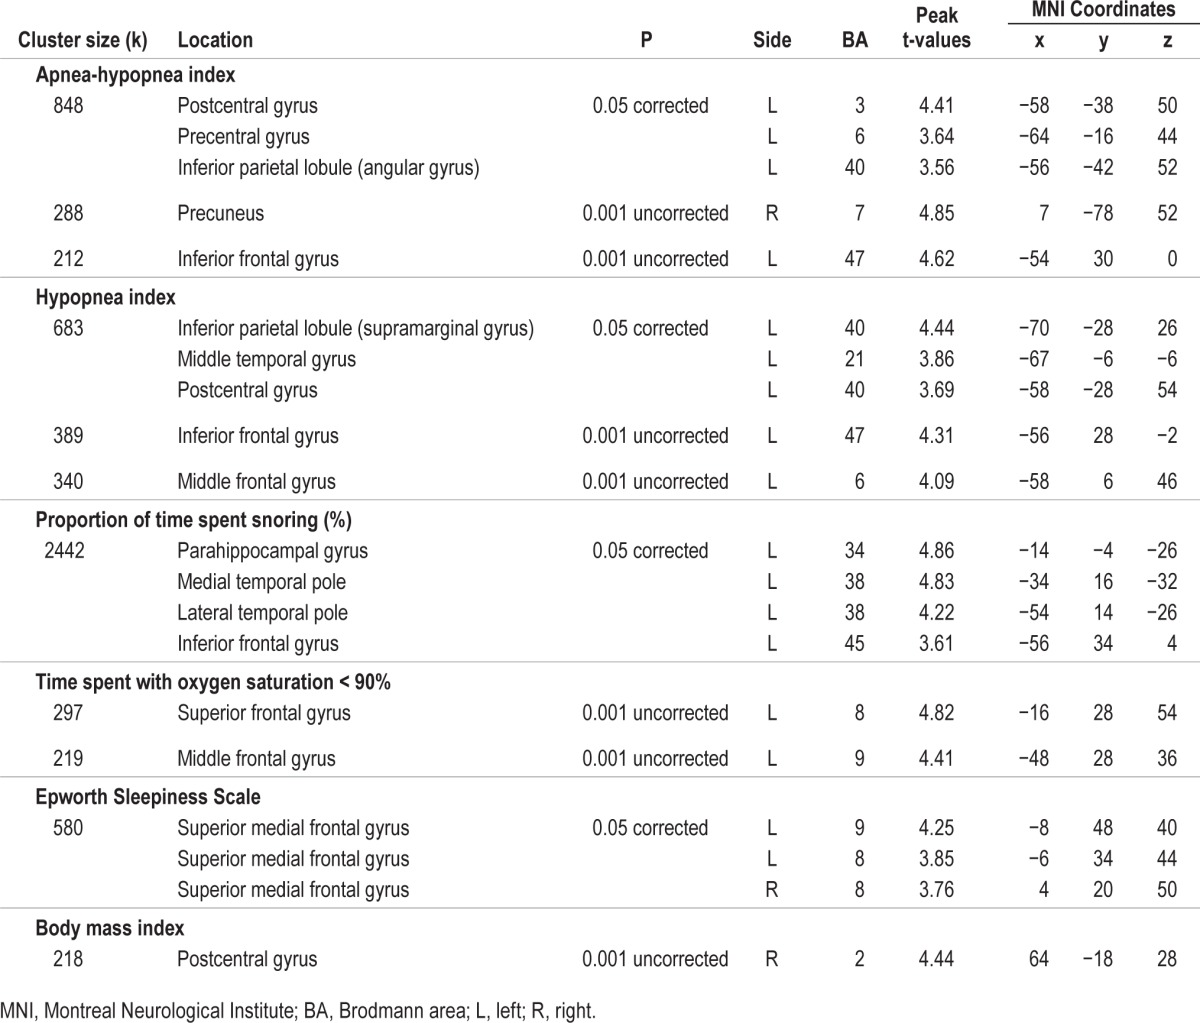
Figure 2.
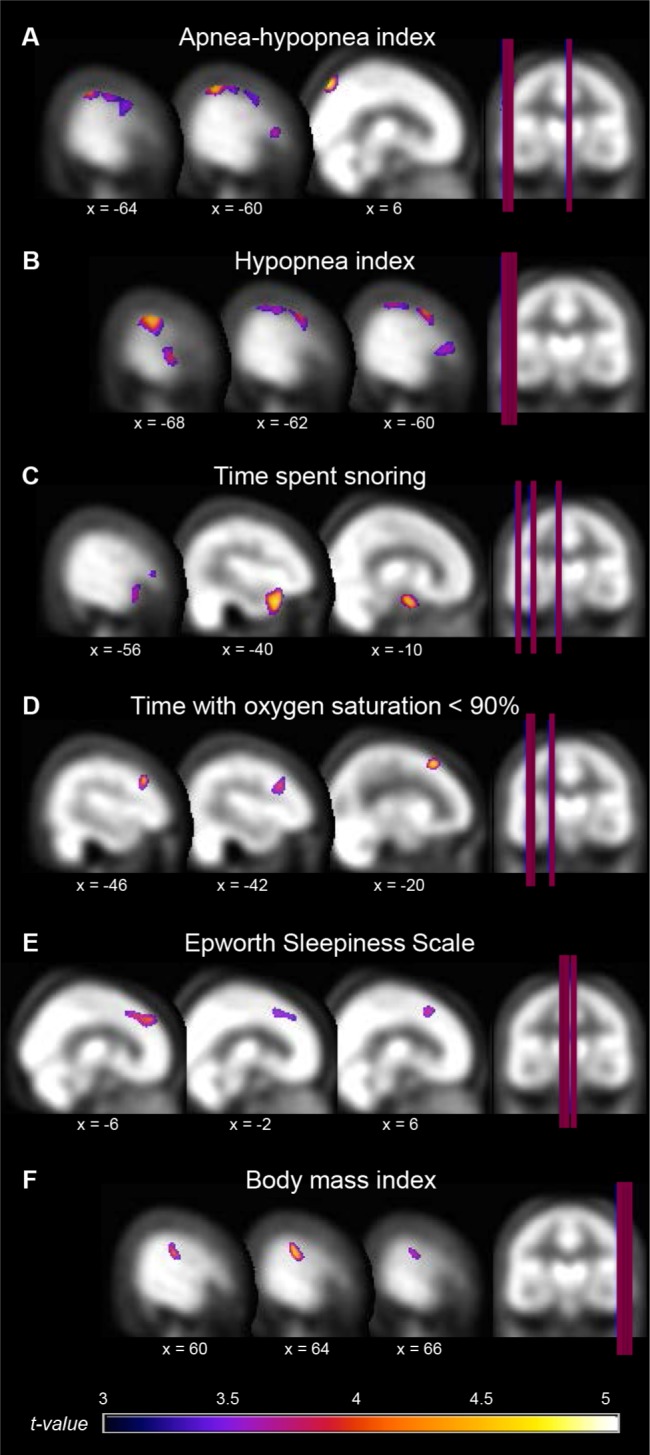
Hypoperfused regions associated with OSA severity. Location of hypoperfusions that correlated with variables representing more severe obstructive sleep apnea (OSA). Regions showing hypoperfusions were as follow: (A) and (B) left inferior and middle frontal, precentral, postcentral, and middle temporal gyri, inferior parietal lobule, and right precuneus; (C) left parahippocampal, anterior temporal pole, and inferior frontal gyri; (D) left dorsolateral prefrontal cortex; (E) bilateral dorsomedial prefrontal cortex; (F) right postcentral gyrus. Results are overlays on the SPECT template and left side of images represent the left hemisphere of the brain.
OSA severity (higher AHI, apnea index and microarousal index) was also associated with hyperperfusion. Contrary to hypoperfusion (mostly in the lateral portion of the frontal, temporal, and parietal cortex), regions of hyperperfusion were all observed in the subcortical or medial cortical regions, including the caudate nucleus, the putamen, the amygdala, the hippocampus, the insula, and the parahippocampal gyrus (Table 4 and Figure 3), mostly in the right hemisphere. No correlation was found between rCBF and sleep efficiency.
Table 4.
Location of hyperperfused regions associated with OSA-related variables.
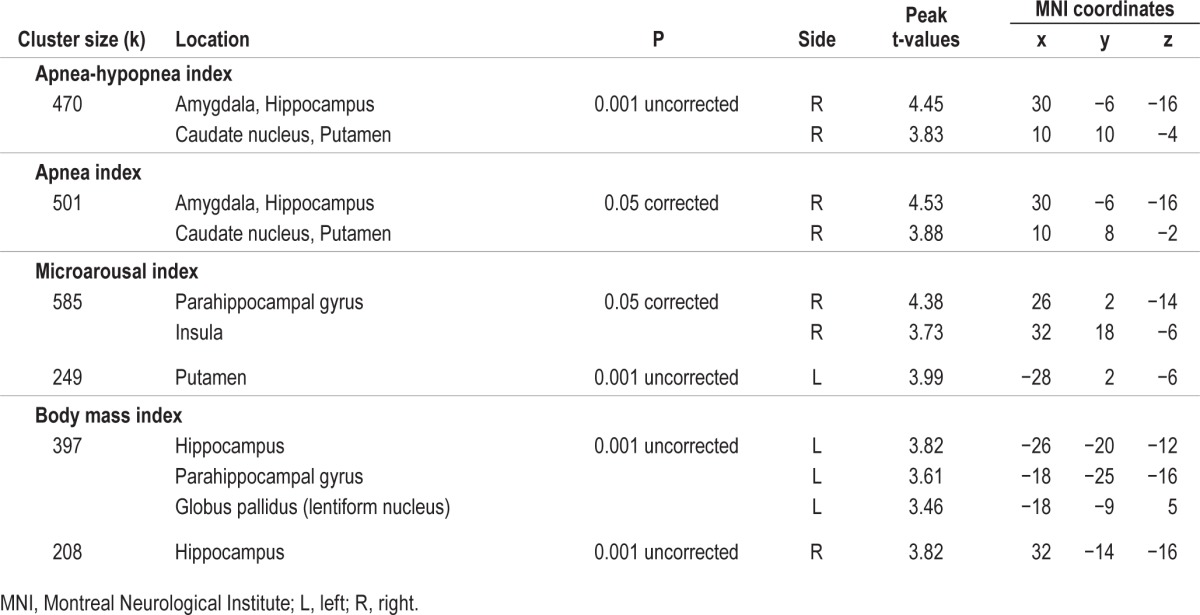
Figure 3.
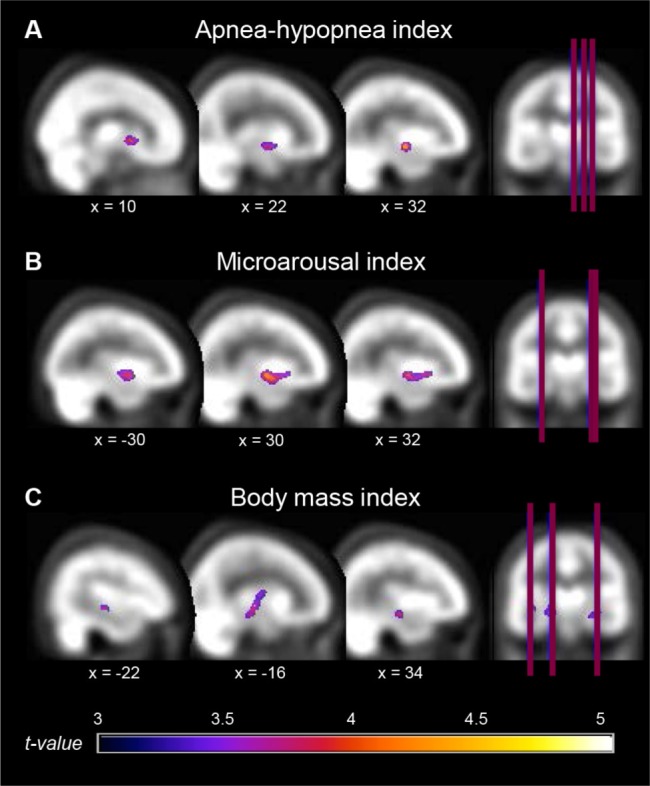
Hyperperfused regions associated with OSA severity. Locations of hyperperfusion that correlated with variables representing more severe obstructive sleep apnea (OSA). Regions showing hyperperfusion were as follow: (A) right basal ganglia, amygdala, and hippocampus; (B) right parahippocampal gyrus, insular cortex, and left putamen; (C) bilateral hippocampi, left parahippocampal gyrus, and globus pallidus. Results are overlays on the SPECT template and left side of images represent the left hemisphere of the brain.
For cardiovascular comorbidities, no correlation was found between rCBF and the vascular burden index with either statistical threshold. However, higher BMI representing obesity was associated with both modest hypoperfusion in the postcentral gyrus and hyperperfusion in the hippocampi and the left parahippocampal gyrus extending to the globus pallidus (Tables 3 and 4, Figures 2 and 3).
DISCUSSION
In the present study, we investigated rCBF using a high-resolution SPECT scanner in a large sample of older subjects with mild, moderate, and severe OSA during wakeful rest in order to evaluate brain function impairment in this population. Group comparisons showed that only severe OSA subjects had reduced rCBF in sensorimotor areas and parietal lobes, especially on the left hemisphere. Additionally, correlational analyses showed that higher levels of respiratory disturbances during sleep, greater daytime sleepiness, and obesity were associated to lateral cortical hypoperfusion of the parietal, temporal and frontal lobes. On the other hand, more respiratory events, fragmented sleep, and obesity were associated with hyperperfusion of subcortical and medial cortical structures, namely the basal ganglia, the limbic system, and the insula.
Reduced rCBF in Older Subjects with Severe OSA
The parietal hypoperfusion found in the present study could be a particularity of older OSA subjects. A recent SPECT study performed in 15 middle-aged subjects with severe OSA showed reduced rCBF only in the prefrontal areas.20 Another SPECT study investigating a relatively large sample of middle-aged men (27 controls and 27 severe OSA) found reduced rCBF in the parahippocampal and lingual gyri, but not in the parietal cortex.17 Even though SPECT studies in middle-aged OSA subjects failed to observed parietal hypoperfusion, two studies using PET in older middle-aged OSA subjects (54.8 ± 5.7 and 49.8 ± 7.0 years old, respectively) reported reduced glucose metabolism in the parietal cortex.18,19 This suggests that either PET is more sensitive than SPECT in detecting parietal anomalies in middle-aged subjects or that changes in the parietal cortex tend to occur after the age of 50. Parietal hypoperfusion is a well-documented marker of early Alzheimer disease, especially on the left hemisphere.35–39 Considering that OSA has been identified as a risk factor for mild cognitive impairment and dementia,40–42 a proportion of our severe OSA subjects may have underlying neurodegenerative processes. Indeed, hypoxia increases both the accumulation of amyloid-β and tau phosphorylation,43 which are pathological markers of Alzheimer disease. Additional longitudinal cohort studies of OSA patients are definitely needed to understand how OSA contributes to abnormal cognitive decline in older subjects and whether parietal hypoperfusion is an early marker of subsequent dementia in OSA.
Other mechanisms combined or not with the hypothetical neurodegenerative process may explain the regional cerebral hypoperfusion observed in older OSA individuals, namely vascular dysfunction and/or neuronal injury. First, during respiratory events, intermittent hypoxemia in combination with fast fluctuations in CBF and variations in blood pressure can lead to oxidative stress, inflammation, endothelial dysfunction, and atherosclerosis.8,43,44 Endothelial dysfunction and atherosclerosis directly reduce the diameter of blood vessels in addition to affect vasoreactivity, leading to hypoperfusion even during wakefulness.43,45 Concordant with this hypothesis, several studies have shown that OSA severity is associated with impaired cerebrovascular reactivity during wakefulness.13–15,46,47 More specifically, subjects with OSA have reduced cerebrovascular autoregulation at rest, during hypoxia and hypercapnia, and during orthostatic hypotension.
The second mechanism that could be responsible for decreased rCBF in OSA is neuronal injuries occurring as a consequence of nocturnal hypoxia and fluctuations in blood pressure and perfusion during respiratory events. Other processes secondary to respiratory events, including endothelial dysfunction, proteasomal activity, reactive gliosis, inflammation, reduced dendritic branching, impaired neurotransmitters production, and oxidative stress may also lead to neuronal function impairment and/or death.7,8,23,48,49 Since regional brain perfusion is closely correlated with local neuronal activity,50 altered neuronal function following injuries or even loss could lead to hypoperfusion. Accordingly, several regions showing hypoperfusions in the present study were reported to have altered resting-state connectivity51–53 as well as cortical thinning or reduced gray matter density in middle-aged OSA individuals.18,54–56
Although mechanisms underlying the vulnerability of some brain regions to vascular dysfunction or neuronal loss in the context of OSA are not fully understood, some characteristics of these regions may explain their susceptibility. In fact, during hypoxia, cortical associative regions, which are phylogenically newer, are less protected in comparison to subcortical structures.57 Moreover, a study with severe OSA subjects using SPECT during sleep found reduced left parietal rCBF,58 which suggests an increased risk of vascular and neuronal impairment leading to daytime hypoperfusion. Finally, the inferior parietal lobe and the precuneus are part of the default mode network,59 as well as several regions found as impaired in association with OSA severity markers in our correlation analysis. It has been hypothesized that the default mode network could be particularly vulnerable to various injuries occurring in aging and in Alzheimer disease,60 and this network has been shown to be impaired in previous functional MRI studies in OSA.52,61–63
Normal rCBF in Mild and Moderate OSA
Based on previous empirical evidence from an animal model of OSA in aging rats23 and on the reduction of global CBF with age,22 we expected that older subjects with mild and moderate OSA would show regional hypoperfusion, but our results did not confirm this hypothesis. The absence of brain anomalies among older subjects with mild OSA corroborates previous results in middle-aged patients, where a higher level of OSA severity was necessary to observe neuroimaging findings, namely silent lacunar infarctions and periventricular hyperintensities,64 as well as altered metabolite concentrations representing reduced neuronal integrity.65,66 Our results are also consistent with those found in neuropsychological studies of middle-aged and elderly subjects, which showed that cognitive deficits are more likely to be observed in individuals with moderate and severe OSA than in those with mild OSA or in healthy controls.67,68 These studies, combined with our results, suggest that a certain level of OSA severity, as measured with the AHI, is necessary to observe changes in brain function and metabolism, independently of age.
Hypoperfusion and Markers of OSA Severity
We found that OSA-related variables including hypopneas, proportion of time spent snoring, hypoxemia, and subjective sleepiness were also associated with hypoperfusion in lateral portions of the parietal, temporal and frontal lobes, especially in the left hemisphere. While hypopnea episodes were associated with reduced perfusion, apneas were not. Since apneas and hypopneas are characterized by different levels of hypoxemia, arousals, and heart rate increases,69 further studies will be needed to understand the differential effect of cessation (apnea) and reduction (hypopnea) of airflow amplitude on brain perfusion and neuronal function. In addition to AHI and hypopnea index, snoring was also associated with reduced rCBF in the left anterior temporal pole extending to the frontal lobe. Habitual snoring in children without OSA increases the risk for cognitive problems and poorer academic performance,70 but the relation between brain function and snoring is not well understood in adults. It is possible that respiratory disturbances provoking snoring without reaching criteria to be considered apneas or hypopneas could affect the brain differently that apnea and hypopnea events. Although correlational analyses with markers of OSA severity are of particular importance in OSA studies, our group analyses leaded to two regions of hypoperfusion that were not observed in the correlational analyses (left superior parietal lobule, right postcentral gyrus), which could be caused by a nonlinear relationship between markers of OSA severity and rCBF.
We also found that hypoxemia and sleepiness were associated with abnormal perfusion in the prefrontal cortex. Consistent with our findings, previous SPECT and PET studies that investigated OSA subjects with higher levels of hypoxemia and subjective sleepiness than in our study, showed reduced prefrontal perfusion or metabolism,19,20 a region that seems particularly sensitive to hypoxemia and sleep deprivation.24 However, the prefrontal regions were not found to be altered in our group comparisons, suggesting that hypoxemia and subjective sleepiness should be considered as contributing factors to brain dysfunction independently of level of OSA severity as measured by the AHI in older individuals.
Association between Hyperperfusion and OSA-Related Variables
Also of interest, significant higher rCBF in several subcortical areas (putamen, caudate nucleus, globus pallidus, amygdala, and hippocampus) and medial cortical regions (insula and parahippocampal gyrus) were associated with higher AHI, apnea, and microarousal indexes. To our knowledge, hyper-perfusion has not been previously reported in SPECT and PET studies in middle-aged OSA subjects.17–20 However, a resting-state fMRI study in OSA reported increased connectivity in the basal ganglia and insula.53 These areas of hyperperfusion may be specific to the older OSA population, but it is also possible that our large sample size used for the correlation analysis and the high spatial resolution of our SPECT scanner allowed the observation of small but significant changes in rCBF that were not previously found in emission tomography studies. In addition, hyperperfusion observed in the present study was not found in our group analysis, suggesting that increased rCBF is a more subtle change in brain functioning that occurs with increasing OSA severity and sleep fragmentation. This pattern of lateral cortical hypoperfusion and subcortical hyperperfusion may be explained by preferential protection of critical brain regions during apneic events and sleep deprivation. In fact, subcortical structures show marked increases in perfusion during hypoxia as compared to cortical regions,57 which may explain why subcortical regions could maintain higher perfusion values during wakefulness in subjects with OSA. On the other hand, some studies have shown anatomical changes in subcortical structures in middle-aged individuals with OSA,18,71–73 which could suggest neuronal injuries. Thus, despite altered structure, increased perfusion during hypoxia could partially protect those regions compared to lateral cortical regions, represented by a hyperperfusion and increased connectivity during wakeful rest.
However, our analysis is scaled in function of the individual global signal of rCBF. It has been shown that OSA subjects have reduced mean CBF velocity,14 and we found reduction in rCBF in lateral cortical regions. This may result in reduced global rCBF, and in comparison, subcortical rCBF could be represented as hyperperfused with increased OSA severity, as has been previously suggested in the aging population.74 Therefore, our hyperperfusion results may be a representation of either subcortical preservation of perfusion or compensatory increases in perfusion.
Although BMI was associated with a reduction in rCBF of the left parietal cortex, it was mostly correlated with increased perfusion in central structures including the hippocampus and parahippocampal gyrus, which were also increased in perfusion in association with the AHI, apneas, and microarousals. The hippocampus and parahippocampal gyrus have been widely studied in the context of OSA, and several studies have shown reduced volume or density,18,54–56,71,72,75–77 changes in neuronal function assessed by fMRI,51 and alteration in metabolites ratios.66,78,79 In animal studies, it was shown that apneas induce excitotoxicity in hippocampal neurons,25 that sleep fragmentation affects hippocampal synaptic plasticity,80 and that a diet with excess fat and refined carbohydrate enhances symptoms associated with hypoxic insult to the hippocampus.81 Thus, obesity could increase vulnerability to intermittent hypoxia and sleep fragmentation in OSA, and these alterations could be linked to increased daytime perfusion. Furthermore, the early stage of Alzheimer disease may be characterized by hippocampus hyperactivity, thus suggesting again an underlying neurodegenerative process.82
Impact of Neuroimaging Statistical Thresholding
In the current study, we used corrected and uncorrected statistical thresholds for neuroimaging analyses. It has been suggested that the vast differences in regions found in imaging studies on OSA could be attributed in part to the use of different statistical thresholds.83 Some variables were associated with rCBF changes only with the uncorrected threshold, such as the time spent with low oxygen saturation and BMI, which suggests that their effect could be less pronounced than other parameters. This is consistent with the fact that our subjects were not severely hypoxic nor morbidly obese. In addition, regions that were found to be significant with the less stringent statistical threshold were generally observed to be significantly affected by similar variables with the corrected threshold. Therefore, we suggest that the uncorrected threshold with a larger extent threshold could justifiably be used in the context of resting-state metabolic or perfusion tomography, while the use of a corrected threshold could hide some modest changes in OSA, especially in studies with small sample sizes.
Limitations
Some limitations in our study should be acknowledged. First, our scanning system did not allow for consistent evaluation of cerebellar perfusion changes. Although it has been often overlooked in OSA, the cerebellum seems to be vulnerable to intermittent hypoxia in an animal model84 and in humans.85 Thus, further studies should specifically investigate cerebellar function in OSA and its role in cognition in this population. Another limitation is that our OSA subjects were not severely hypoxic, with minimal oxygen saturation drops in the severe OSA group to an average of 82% ± 5.5%. It is possible that more hypoxic patients were not recruited in our study because they presented exclusion factors, such as a history of stroke or BMI > 40. Thirdly, our groups were not matched for sex. Although results concerning sex differences in regional brain perfusion are highly inconsistent,86 a study performed in older subjects showed that females have reduced rCBF in regions that were reported as hypoperfused in our study, including parietal areas.87 This suggests that our unmatched groups could have lead to increased risk of false negatives, since most of the females in our study were in the control group. Finally, the lack of relationship between vascular disease burden and regional perfusion could be due to the low number of concomitant comorbidities and risk factors in our subjects. Therefore, we could not eliminate the possibility that OSA and vascular risk factors interact to affect the brain.
CONCLUSIONS
Our results show that older individuals with newly diagnosed severe OSA show rCBF anomalies at rest, mostly in sensorimotor areas and the left parietal cortex. Considering that AHI is known to increase up to 53% in 17 months in older apneic patients without significant weight gain,88 particular attention should be given to individuals with mild or moderate OSA in order to reduce their risk of eventually presenting brain/cognitive dysfunction linked to their condition. In addition, different variables representing OSA severity should be taken into account since they could independently contribute to abnormal brain and neuronal function. While most markers of respiratory disturbances, sleepiness, and obesity are associated with regional reductions of brain perfusion in lateral frontal, temporal and parietal areas, other factors such as respiratory events, sleep fragmentation, and obesity are associated with increased perfusion in subcortical and medial cortical areas including the limbic system, the insula and basal ganglia. These changes in regional perfusion could underlie vascular impairment and neuronal injuries, and be associated with deficits in several cognitive domains. The perfusion pattern observed in our study is similar to what is observed in early stage of Alzheimer disease, which suggests the presence of undergoing neurodegenerative processes. Indeed, hypoperfusion in Alzheimer disease is observed before clinical symptoms and is implicated in the progression of the disease.43 Thus, the role of OSA in neurodegeneration should be investigated as well as whether these functional changes are reversible or not with an appropriate treatment in future studies.
DISCLOSURE STATEMENT
This was not an industry supported study. This research was supported by the Canadian Institutes of Health Research (CIHR) and by the Fonds de Recherche du Québec-Santé (FRQ-S)—both for Dr. Gosselin. Part of this study was also funded by two PhD fellowships from the CIHR and Fonds pour la recherche du Québec–Nature & Technologies, awarded to Mrs. Baril and Mrs. Gagnon, respectively. In addition, Dr. Arbour received a postdoctoral fellowship from the CIHR. Dr. Gagnon receives a salary from FRQ-S and CIHR and has received research support from CIHR and The W. Garfield Weston Foundation. Dr. Gagnon holds a Canada Research Chair on Cognitive Decline in Pathological Aging. Dr. Montplaisir serves on scientific advisory boards for Boehringer Ingelheim, Servier, and Merck Serono; has received funding for travel from GlaxoSmithKline, Sanofi-Aventis, and Boehringer Ingelheim; has received speaker honoraria from Valeant Pharmaceuticals International, GlaxoSmithKline, Sanofi-Aventis, and Boehringer Ingelheim; and receives research support from Sanofi-Aventis, Boehringer Ingelheim, The W. Garfield Weston Foundation. Dr. Montplaisir holds a Canada Research Chair on Sleep Medicine. Dr. Soucy has indicated no financial conflicts of interest. The study was performed at the Center for Advanced Research in Sleep Medicine of the Hôpital du Sacré-Coeur de Montréal, Québec, Canada.
ACKNOWLEDGMENTS
The authors thank Hélène Blais, BSc; Fatma Ben Aissa; Madiha Akesbi; Robert Houle; Dominique Petit, PhD; Chantal Lafond, MD; and Bic Nguyen, MD, for their participation in subject recruitment and data collection. This study was supported by the Canadian Institutes of Health Research (grant number: 115172) and by the Fonds de la recherche du Québec (24742).
ABBREVIATIONS
- AHI
apnea-hypopnea index
- BA
Brodmann area
- BMI
body mass index
- CBF
cerebral blood flow
- FDR
false discovery rate
- FWHM
full-width half-maximum
- MNI
Montreal Neurological Institute
- MRI
magnetic resonance imaging
- OSA
obstructive sleep apnea
- PET
positron emission tomography
- rCBF
regional cerebral blood flow
- SPECT
single-photon emission computed tomography
- SPM
statistical parametric mapping
- 99mTc-HMPAO
technetium hexa-methyl-amino-propyleneamine-oxime
Footnotes
A commentary on this article appears in this issue on page 1345.
REFERENCES
- 1.American Academy of Sleep Medicine Task Force. Sleep-related breathing disorders in adults: recommendations for syndrome definition and measurement techniques in clinical research. The Report of an American Academy of Sleep Medicine Task Force. Sleep. 1999;22:667–89. [PubMed] [Google Scholar]
- 2.Malhotra A, White DP. Obstructive sleep apnoea. Lancet. 2002;20:237–45. doi: 10.1016/S0140-6736(02)09464-3. [DOI] [PubMed] [Google Scholar]
- 3.Franklin KA. Cerebral haemodynamics in obstructive sleep apnoea and Cheyne-Stokes respiration. Sleep Med Rev. 2002;6:429–41. doi: 10.1053/smrv.2001.0206. [DOI] [PubMed] [Google Scholar]
- 4.Chouchou F, Pichot V, Barthélémy JC, Bastuji H, Roche F. Cardiac sympathetic modulation in response to apneas/hypopneas through heart rate variability analysis. PLoS One. 2014;9:e86434. doi: 10.1371/journal.pone.0086434. [DOI] [PMC free article] [PubMed] [Google Scholar]
- 5.Valipour A, McGown AD, Makker H, O'Sullivan C, Spiro SG. Some factors affecting cerebral tissue saturation during obstructive sleep apnoea. Eur Respir J. 2002;20:444–50. doi: 10.1183/09031936.02.00265702. [DOI] [PubMed] [Google Scholar]
- 6.Lim DC, Veasey SC. Neural injury in sleep apnea. Curr Neurol Neurosci Rep. 2010;10:47–52. doi: 10.1007/s11910-009-0078-6. [DOI] [PubMed] [Google Scholar]
- 7.Aviles-Reyes RX, Angelo MF, Villarreal A, Rios H, Lazarowski A, Ramos AJ. Intermittent hypoxia during sleep induces reactive gliosis and limited neuronal death in rats: implications for sleep apnea. J Neurochem. 2010;112:854–69. doi: 10.1111/j.1471-4159.2009.06535.x. [DOI] [PubMed] [Google Scholar]
- 8.Yun CH, Jung KH, Chu K, et al. Increased circulating endothelial microparticles and carotid atherosclerosis in obstructive sleep apnea. J Clin Neurol. 2010;6:89–98. doi: 10.3988/jcn.2010.6.2.89. [DOI] [PMC free article] [PubMed] [Google Scholar]
- 9.Gagnon K, Baril AA, Gagnon JF, et al. Cognitive impairment in obstructive sleep apnea. Pathol Biol (Paris) 2014;62:233–40. doi: 10.1016/j.patbio.2014.05.015. [DOI] [PubMed] [Google Scholar]
- 10.Lanfranchi P, Somers VK. Obstructive sleep apnea and vascular disease. Respir Res. 2001;2:315–9. doi: 10.1186/rr79. [DOI] [PMC free article] [PubMed] [Google Scholar]
- 11.Yaggi HK, Concato J, Kernan WN, Lichtman JH, Brass LM, Mohsenin V. Obstructive sleep apnea as a risk factor for stroke and death. N Engl J Med. 2005;353:2034–41. doi: 10.1056/NEJMoa043104. [DOI] [PubMed] [Google Scholar]
- 12.Cho ER, Kim H, Seo HS, Suh S, Lee SK, Shin C. Obstructive sleep apnea as a risk factor for silent cerebral infarction. J Sleep Res. 2013;22:452–8. doi: 10.1111/jsr.12034. [DOI] [PubMed] [Google Scholar]
- 13.Placidi F, Diomedi M, Cupini LM, Bernardi G, Silvestrini M. Impairment of daytime cerebrovascular reactivity in patients with obstructive sleep apnoea syndrome. J Sleep Res. 1998;7:288–92. doi: 10.1046/j.1365-2869.1998.00120.x. [DOI] [PubMed] [Google Scholar]
- 14.Urbano F, Roux F, Schindler J, Mohsenin V. Impaired cerebral autoregulation in obstructive sleep apnea. J Appl Physiol. 2008;105:1852–7. doi: 10.1152/japplphysiol.90900.2008. [DOI] [PubMed] [Google Scholar]
- 15.Nasr N, Traon AP, Czosnyka M, Tiberge M, Schmidt E, Larrue V. Cerebral autoregulation in patients with obstructive sleep apnea syndrome during wakefulness. Eur J Neurol. 2009;16:386–91. doi: 10.1111/j.1468-1331.2008.02505.x. [DOI] [PubMed] [Google Scholar]
- 16.Yadav SK, Kumar R, Macey PM, et al. Regional cerebral blood flow alterations in obstructive sleep apnea. Neurosci Lett. 2013;555:159–64. doi: 10.1016/j.neulet.2013.09.033. [DOI] [PMC free article] [PubMed] [Google Scholar]
- 17.Joo EY, Tae WS, Han SJ, Cho JW, Hong SB. Reduced cerebral blood flow during wakefulness in obstructive sleep apnea-hypopnea syndrome. Sleep. 2007;30:1515–20. doi: 10.1093/sleep/30.11.1515. [DOI] [PMC free article] [PubMed] [Google Scholar]
- 18.Yaouhi K, Bertran F, Clochon P, et al. A combined neuropsychological and brain imaging study of obstructive sleep apnea. J Sleep Res. 2009;18:36–48. doi: 10.1111/j.1365-2869.2008.00705.x. [DOI] [PubMed] [Google Scholar]
- 19.Ju G, Yoon IY, Lee SD, Kim YK, Yoon E, Kim JW. Modest changes in cerebral glucose metabolism in patients with sleep apnea syndrome after continuous positive airway pressure treatment. Respiration. 2012;84:212–8. doi: 10.1159/000338117. [DOI] [PubMed] [Google Scholar]
- 20.Shiota S, Inoue Y, Takekawa H, et al. Effect of continuous positive airway pressure on regional cerebral blood flow during wakefulness in obstructive sleep apnea. Sleep Breath. 2014;18:289–95. doi: 10.1007/s11325-013-0881-9. [DOI] [PubMed] [Google Scholar]
- 21.Young T, Peppard PE, Gottlieb DJ. Epidemiology of obstructive sleep apnea: a population health perspective. Am J Respir Crit Care Med. 2002;165:1217–39. doi: 10.1164/rccm.2109080. [DOI] [PubMed] [Google Scholar]
- 22.Leenders KL, Perani D, Lammertsma AA, et al. Cerebral blood flow, blood volume and oxygen utilization. Normal values and effect of age. Brain. 1990;113:27–47. doi: 10.1093/brain/113.1.27. [DOI] [PubMed] [Google Scholar]
- 23.Gozal D, Row BW, Kheirandish L, et al. Increased susceptibility to intermittent hypoxia in aging rats: changes in proteasomal activity, neuronal apoptosis and spatial function. J Neurochem. 2003;86:1545–52. doi: 10.1046/j.1471-4159.2003.01973.x. [DOI] [PubMed] [Google Scholar]
- 24.Beebe DW, Gozal D. Obstructive sleep apnea and the prefrontal cortex: towards a comprehensive model linking nocturnal upper airway obstruction to daytime cognitive and behavioral deficits. J Sleep Res. 2002;11:1–16. doi: 10.1046/j.1365-2869.2002.00289.x. [DOI] [PubMed] [Google Scholar]
- 25.Fung SJ, Xi MC, Zhang JH, et al. Apnea promotes glutamate-induced excitotoxicity in hippocampal neurons. Brain Res. 2007;1179:42–50. doi: 10.1016/j.brainres.2007.08.044. [DOI] [PMC free article] [PubMed] [Google Scholar]
- 26.Tumeh PC, Alavi A, Houseni M, et al. Structural and functional imaging correlates for age-related changes in the brain. Semin Nucl Med. 2007;37:69–87. doi: 10.1053/j.semnuclmed.2006.10.002. [DOI] [PubMed] [Google Scholar]
- 27.Beck AT, Steer RA, Ball R, Ranieri W. Comparison of Beck Depression Inventories -IA and -II in psychiatric outpatients. J Pers Assess. 1996;67:588–97. doi: 10.1207/s15327752jpa6703_13. [DOI] [PubMed] [Google Scholar]
- 28.Beck AT, Epstein N, Brown G, Steer RA. An inventory for measuring clinical anxiety: psychometric properties. J Consult Clin Psychol. 1988;56:893–7. doi: 10.1037//0022-006x.56.6.893. [DOI] [PubMed] [Google Scholar]
- 29.Johns MW. A new method for measuring daytime sleepiness: the Epworth sleepiness scale. Sleep. 1991;14:540–5. doi: 10.1093/sleep/14.6.540. [DOI] [PubMed] [Google Scholar]
- 30.Villeneuve S, Belleville S, Massoud F, Bocti C, Gauthier S. Impact of vascular risk factors and diseases on cognition in persions with mild cognitive impairment. Dement Geriatr Cogn Disord. 2009;27:375–81. doi: 10.1159/000209965. [DOI] [PubMed] [Google Scholar]
- 31.Villeneuve S, Massoud F, Bocti C, Gauthier S, Belleville S. The nature of episodic memory deficits in MCI with and without vascular burden. Neuropsychologia. 2011;49:3027–35. doi: 10.1016/j.neuropsychologia.2011.07.001. [DOI] [PubMed] [Google Scholar]
- 32.Berry RB, Budhiraja R, Gottlieb DJ, et al. Rules for scoring respiratory events in sleep: update of the 2007 AASM Manual for the scoring of sleep and associated events. Deliberations of the Sleep Apnea Definitions Task Force of the American Academy of Sleep Medicine. J Clin Sleep Med. 2012;15:597–619. doi: 10.5664/jcsm.2172. [DOI] [PMC free article] [PubMed] [Google Scholar]
- 33.Iber C, Ancoli-Israel S, Chesson AL, Jr, Quan SF for the American Academy of Sleep Medicine, 1st ed. Westchester: American Academy of Sleep Medicine; 2007. The AASM manual for the scoring of sleep and associated events: rules, terminology and technical specifications. [Google Scholar]
- 34.Genovese CR, Lazar NA, Nichols T. Thresholding of statistical maps in functional neuroimaging using the false discovery rate. Neuroimage. 2002;15:870–8. doi: 10.1006/nimg.2001.1037. [DOI] [PubMed] [Google Scholar]
- 35.Masterman DL, Mendez MF, Fairbanks LA, Cummings JL. Sensitivity, specificity, and positive predictive value of technetium 99-HMPAO SPECT in discriminating Alzheimer's disease from other dementias. J Geriatr Psychiatry Neurol. 1997;10:15–21. doi: 10.1177/089198879701000104. [DOI] [PubMed] [Google Scholar]
- 36.Farid K, Volpe-Gillot L, Caillat-Vigneron N. Perfusion brain SPECT and Alzheimer disease. Presse Med. 2010;39:1127–31. doi: 10.1016/j.lpm.2010.06.013. [DOI] [PubMed] [Google Scholar]
- 37.Alexopoulos P, Sorg C, Förschler A, et al. Perfusion abnormalities in mild cognitive impairment and mild dementia in Alzheimer's disease measured by pulsed arterial spin labeling MRI. Eur Arch Psychiatry Clin Neurosci. 2012;262:69–77. doi: 10.1007/s00406-011-0226-2. [DOI] [PubMed] [Google Scholar]
- 38.Jacobs HI, Van Boxtel MP, Jolles J, Verhey FR, Uylings HB. Parietal cortex matters in Alzheimer's disease: an overview of structural, functional and metabolic findings. Neurosci Biobehav Rev. 2012;36:297–309. doi: 10.1016/j.neubiorev.2011.06.009. [DOI] [PubMed] [Google Scholar]
- 39.Warkentin S, Ohlsson M, Wollmer P, Edenbrandt L, Minthon L. Regional cerebral blood flow in Alzheimer's disease: classification and analysis of heterogeneity. Dement Geriatr Cogn Disord. 2004;17:207–14. doi: 10.1159/000076358. [DOI] [PubMed] [Google Scholar]
- 40.Yaffe K, Laffan AM, Harrison SL, et al. Sleep-disordered breathing, hypoxia, and risk of mild cognitive impairment and dementia in older women. JAMA. 2011;306:613–9. doi: 10.1001/jama.2011.1115. [DOI] [PMC free article] [PubMed] [Google Scholar]
- 41.Chang WP, Liu ME, Chang WC, et al. Sleep apnea and the risk of dementia: a population-based 5-year follow-up study in Taiwan. PLoS One. 2013;8:e78655. doi: 10.1371/journal.pone.0078655. [DOI] [PMC free article] [PubMed] [Google Scholar]
- 42.Pan W, Kastin AJ. Can sleep apnea cause Alzheimer's disease? Neurosci Biobehav Rev. 2014;47:656–69. doi: 10.1016/j.neubiorev.2014.10.019. [DOI] [PubMed] [Google Scholar]
- 43.Daulatzai MA. Death by a thousand cuts in Alzheimer's disease: hypoxia--the prodrome. Neurotox Res. 2013;24:216–43. doi: 10.1007/s12640-013-9379-2. [DOI] [PubMed] [Google Scholar]
- 44.Khayat R, Patt B, Hayes D., Jr Obstructive sleep apnea: the new cardiovascular disease. Part I: Obstructive sleep apnea and the pathogenesis of vascular disease. Heart Fail Rev. 2009;14:143–53. doi: 10.1007/s10741-008-9112-z. [DOI] [PMC free article] [PubMed] [Google Scholar]
- 45.de la Torre JC. Cerebral hemodynamics and vascular risk factors: setting the stage for Alzheimer's disease. J Alzheimers Dis. 2012;32:553–67. doi: 10.3233/JAD-2012-120793. [DOI] [PubMed] [Google Scholar]
- 46.Reichmuth KJ, Dopp JM, Barczi SR, et al. Impaired vascular regulation in patients with obstructive sleep apnea: effects of continuous positive airway pressure treatment. Am J Respir Crit Care Med. 2009;180:1143–50. doi: 10.1164/rccm.200903-0393OC. [DOI] [PMC free article] [PubMed] [Google Scholar]
- 47.Prilipko O, Huynh N, Thomason ME, Kushida CA, Guilleminault C. An fMRI study of cerebrovascular reactivity and perfusion in obstructive sleep apnea patients before and after CPAP treatment. Sleep Med. 2014;15:892–8. doi: 10.1016/j.sleep.2014.04.004. [DOI] [PubMed] [Google Scholar]
- 48.Xu W, Chi L, Row BW, et al. Increased oxidative stress is associated with chronic intermittent hypoxia-mediated brain cortical neuronal cell apoptosis in a mouse model of sleep apnea. Neuroscience. 2004;126:313–23. doi: 10.1016/j.neuroscience.2004.03.055. [DOI] [PubMed] [Google Scholar]
- 49.Veasey S. Insight from animal models into the cognitive consequences of adult sleep-disordered breathing. ILAR J. 2009;50:307–11. doi: 10.1093/ilar.50.3.307. [DOI] [PubMed] [Google Scholar]
- 50.Paemeleire K. The cellular basis of neurovascular metabolic coupling. Acta Neurol Belg. 2002;102:153–7. [PubMed] [Google Scholar]
- 51.Santarnecchi E, Sicilia I, Richiardi J, et al. Altered cortical and subcortical local coherence in obstructive sleep apnea: a functional magnetic resonance imaging study. J Sleep Res. 2013;22:337–47. doi: 10.1111/jsr.12006. [DOI] [PubMed] [Google Scholar]
- 52.Zhang Q, Wang D, Qin W, et al. Altered resting-state brain activity in obstructive sleep apnea. Sleep. 2013;36:651–9B. doi: 10.5665/sleep.2620. [DOI] [PMC free article] [PubMed] [Google Scholar]
- 53.Peng DC, Dai XJ, Gong HH, Li HJ, Nie X, Zhang W. Altered intrinsic regional brain activity in male patients with severe obstructive sleep apnea: a resting-state functional magnetic resonance imaging study. Neuropsychiatr Dis Treat. 2014;10:1819–26. doi: 10.2147/NDT.S67805. [DOI] [PMC free article] [PubMed] [Google Scholar]
- 54.Macey PM, Henderson LA, Macey KE, et al. Brain morphology associated with obstructive sleep apnea. Am J Respir Crit Care Med. 2002;166:1382–7. doi: 10.1164/rccm.200201-050OC. [DOI] [PubMed] [Google Scholar]
- 55.Canessa N, Castronovo V, Cappa SF, et al. Obstructive sleep apnea: brain structural changes and neurocognitive function before and after treatment. Am J Respir Crit Care Med. 2011;15:1419–26. doi: 10.1164/rccm.201005-0693OC. [DOI] [PubMed] [Google Scholar]
- 56.Joo EY, Jeon S, Kim ST, Lee JM, Hong SB. Localized cortical thinning in patients with obstructive sleep apnea syndrome. Sleep. 2013;36:1153–62. doi: 10.5665/sleep.2876. [DOI] [PMC free article] [PubMed] [Google Scholar]
- 57.Binks AP, Cunningham VJ, Adams L, Banzett RB. Gray matter blood flow change is unevenly distributed during moderate isocapnic hypoxia in humans. J Appl Physiol. 2008;104:212–7. doi: 10.1152/japplphysiol.00069.2007. [DOI] [PubMed] [Google Scholar]
- 58.Ficker JH, Feistel H, Möller C, et al. Changes in regional CNS perfusion in obstructive sleep apnea syndrome: initial SPECT studies with injected nocturnal 99mTc-HMPAO. Pneumologie. 1997;51:926–30. [PubMed] [Google Scholar]
- 59.Buckner RL, Andrews-Hanna JR, Schacter DL. The brain's default network: anatomy, function, and relevance to disease. Ann N Y Acad Aci. 2008;1124:1–38. doi: 10.1196/annals.1440.011. [DOI] [PubMed] [Google Scholar]
- 60.Fjell AM, Amlien IK, Sneve MH, et al. The roots of Alzheimer's disease: are high-expanding cortical areas preferentially targeted? Cereb Cortex. 2014 Mar 21; doi: 10.1093/cercor/bhu055. [Epub ahead of print] [DOI] [PMC free article] [PubMed] [Google Scholar]
- 61.Sweet LH, Jerskey BA, Aloia MS. Default network response to a working memory challenge after withdrawal of continuous positive airway pressure treatment for obstructive sleep apnea. Brain Imaging Behav. 2010;4:155–63. doi: 10.1007/s11682-010-9095-y. [DOI] [PubMed] [Google Scholar]
- 62.Prilipko O, Huynh N, Schwartz S, et al. Task positive and default mode networks during a parametric working memory task in obstructive sleep apnea patients and healthy controls. Sleep. 2011;34:293–301. doi: 10.1093/sleep/34.3.293. [DOI] [PMC free article] [PubMed] [Google Scholar]
- 63.Prilipko O, Huynh N, Schwartz S, et al. The effects of CPAP treatment on task positive and default mode networks in obstructive sleep apnea patients: an fMRI study. PLoS One. 2012;7:e47433. doi: 10.1371/journal.pone.0047433. [DOI] [PMC free article] [PubMed] [Google Scholar]
- 64.Nishibayashi M, Miyamoto M, Miyamoto T, Suzuki K, Hirata K. Correlation between severity of obstructive sleep apnea and prevalence of silent cerebrovascular lesions. J Clin Sleep Med. 2008;4:242–7. [PMC free article] [PubMed] [Google Scholar]
- 65.Kamba M, Suto Y, Ohta Y, Inoue Y, Matsuda E. Cerebral metabolism in sleep apnea. Evaluation by magnetic resonance spectroscopy. Am J Respir Crit Care Med. 1997;156:296–8. doi: 10.1164/ajrccm.156.1.9611063. [DOI] [PubMed] [Google Scholar]
- 66.Alkan A, Sharifov R, Akkoyunlu ME, et al. MR spectroscopy features of brain in patients with mild and severe obstructive sleep apnea syndrome. Clin Imaging. 2013;37:989–92. doi: 10.1016/j.clinimag.2013.07.010. [DOI] [PubMed] [Google Scholar]
- 67.Sforza E, Roche F, Thomas-Anterion C, et al. Cognitive function and sleep related breathing disorders in a healthy elderly population: the SYNAPSE study. Sleep. 2010;33:515–21. doi: 10.1093/sleep/33.4.515. [DOI] [PMC free article] [PubMed] [Google Scholar]
- 68.Chen R, Xiong KP, Huang JY, et al. Neurocognitive impairment in Chinese patients with obstructive sleep apnoea hypopnoea syndrome. Respirology. 2011;16:842–8. doi: 10.1111/j.1440-1843.2011.01979.x. [DOI] [PubMed] [Google Scholar]
- 69.Ayappa I, Rapaport BS, Norman RG, Rapoport DM. Immediate consequences of respiratory events in sleep disordered breathing. Sleep Med. 2005;6:123–30. doi: 10.1016/j.sleep.2004.08.005. [DOI] [PubMed] [Google Scholar]
- 70.Biggs SN, Nixon GM, Horne RS. The conundrum of primary snoring in children: what are we missing in regards to cognitive and behavioural morbidity? Sleep Med Rev. 2014;18:463–75. doi: 10.1016/j.smrv.2014.06.009. [DOI] [PubMed] [Google Scholar]
- 71.Joo EY, Tae WS, Lee MJ, et al. Reduced brain gray matter concentration in patients with obstructive sleep apnea syndrome. Sleep. 2010;33:235–41. doi: 10.1093/sleep/33.2.235. [DOI] [PMC free article] [PubMed] [Google Scholar]
- 72.Torelli F, Moscufo N, Garreffa G, et al. Cognitive profile and brain morphological changes in obstructive sleep apnea. Neuroimage. 2011;54:787–93. doi: 10.1016/j.neuroimage.2010.09.065. [DOI] [PMC free article] [PubMed] [Google Scholar]
- 73.Kumar R, Farahvar S, Ogren JA, et al. Brain putamen volume changes in newly-diagnosed patients with obstructive sleep apnea. Neuroimage Clin. 2014;4:383–91. doi: 10.1016/j.nicl.2014.01.009. [DOI] [PMC free article] [PubMed] [Google Scholar]
- 74.Pagani M, Salmaso D, Jonsson C, et al. Regional cerebral blood flow as assessed by principal component analysis and (99m)Tc-HMPAO SPET in healthy subjects at rest: normal distribution and effect of age and gender. Eur J Nucl Med Mol Imaging. 2002;29:67–75. doi: 10.1007/s00259-001-0676-2. [DOI] [PubMed] [Google Scholar]
- 75.Morrell MJ, McRobbie DW, Quest RA, Cummin AR, Ghiassi R, Corfield DR. Changes in brain morphology associated with obstructive sleep apnea. Sleep Med. 2003;4:451–4. doi: 10.1016/s1389-9457(03)00159-x. [DOI] [PubMed] [Google Scholar]
- 76.Gale SD, Hopkins RO. Effects of hypoxia on the brain: neuroimaging and neuropsychological findings following carbon monoxide poisoning and obstructive sleep apnea. J Int Neuropsychol Soc. 2004;10:60–71. doi: 10.1017/S1355617704101082. [DOI] [PubMed] [Google Scholar]
- 77.Dusak A, Ursavas A, Hakyemez B, Gokalp G, Taskapilioglu O, Parlak M. Correlation between hippocampal volume and excessive daytime sleepiness in obstructive sleep apnea syndrome. Eur Rev Med Pharmacol Sci. 2013;17:1198–204. [PubMed] [Google Scholar]
- 78.O'Donoghue FJ, Wellard RM, Rochford PD, et al. Magnetic resonance spectroscopy and neurocognitive dysfunction in obstructive sleep apnea before and after CPAP treatment. Sleep. 2012;35:41–8. doi: 10.5665/sleep.1582. [DOI] [PMC free article] [PubMed] [Google Scholar]
- 79.Bartlett DJ, Rae C, Thompson CH, et al. Hippocampal area metabolites relate to severity and cognitive function in obstructive sleep apnea. Sleep Med. 2004;5:593–6. doi: 10.1016/j.sleep.2004.08.004. [DOI] [PubMed] [Google Scholar]
- 80.Tartar JL, Ward CP, McKenna JT, et al. Hippocampal synaptic plasticity and spatial learning are impaired in a rat model of sleep fragmentation. Eur J Neurosci. 2006;23:2739–48. doi: 10.1111/j.1460-9568.2006.04808.x. [DOI] [PMC free article] [PubMed] [Google Scholar]
- 81.Golbart AD, Row BW, Kheirandish-Gozal L, Cheng Y, Brittian KR, Gozal D. High fat/refined carbohydrate diet enhances the susceptibility to spatial learning deficits in rats exposed to intermittent hypoxia. Brain Res. 2006;1090:190–6. doi: 10.1016/j.brainres.2006.03.046. [DOI] [PubMed] [Google Scholar]
- 82.Leal SL, Yassa MA. Perturbations of neural circuitry in aging, mild cognitive impairment, and Alzheimer's disease. Ageing Res Rev. 2013;12:823–31. doi: 10.1016/j.arr.2013.01.006. [DOI] [PMC free article] [PubMed] [Google Scholar]
- 83.Morrell MJ, Glasser M. The brain in sleep-disordered breathing: a vote for the chicken? Am J Respir Crit Care Med. 2011;183:1292–4. doi: 10.1164/rccm.201103-0562ED. [DOI] [PubMed] [Google Scholar]
- 84.Pae EK, Chien P, Harper RM. Intermittent hypoxia damages cerebellar cortex and deep nuclei. Neurosci Lett. 2005;375:123–8. doi: 10.1016/j.neulet.2004.10.091. [DOI] [PubMed] [Google Scholar]
- 85.Harper RM, Kumar R, Ogren JA, Macey PM. Sleep-disordered breathing: effects on brain structure and function. Respir Physiol Neurobiol. 2013;188:383–91. doi: 10.1016/j.resp.2013.04.021. [DOI] [PMC free article] [PubMed] [Google Scholar]
- 86.Cosgrove KP, Mazure CM, Staley JK. Evolving knowledge of sex differences in brain structure, function, and chemistry. Biol Psychiatry. 2007;62:847–55. doi: 10.1016/j.biopsych.2007.03.001. [DOI] [PMC free article] [PubMed] [Google Scholar]
- 87.Li ZJ, Matsuda H, Asada T, et al. Gender difference in brain perfusion 99mTc-ECD SPECT in aged healthy volunteers after correction for partial volume effects. Nucl Med Commun. 2004;25:999–1005. doi: 10.1097/00006231-200410000-00003. [DOI] [PubMed] [Google Scholar]
- 88.Pendlebury ST, Pépin JL, Veale D, Lévy P. Natural evolution of moderate sleep apnoea syndrome: significant progression over a mean of 17 months. Thorax. 1997;52:872–8. doi: 10.1136/thx.52.10.872. [DOI] [PMC free article] [PubMed] [Google Scholar]