

Abstract
Study Objectives:
To evaluate the accuracy in measuring nighttime sleep of a fitness tracker (Jawbone UP) compared to polysomnography (PSG).
Design:
Jawbone UP and PSG data were simultaneously collected from adolescents during an overnight laboratory recording. Agreements between Jawbone UP and PSG sleep outcomes were analyzed using paired t tests and Bland-Altman plots. Multiple regressions were used to investigate which PSG sleep measures predicted Jawbone UP “Sound sleep” and “Light sleep.”
Setting:
SRI International Human Sleep Laboratory.
Participants:
Sixty-five healthy adolescents (28 females, mean age ± standard deviation [SD]: 15.8 ± 2.5 y).
Interventions:
N/A.
Measurements and Results:
Outcomes showed good agreements between Jawbone UP and PSG for total sleep time (mean differences ± SD: −10.0 ± 20.5 min), sleep efficiency (mean differences ± SD: −1.9 ± 4.2 %), and wake after sleep onset (WASO) (mean differences ± SD: 10.6 ± 14.7 min). Overall, Jawbone UP overestimated PSG total sleep time and sleep efficiency and underestimated WASO but differences were small and, on average, did not exceed clinically meaningful cutoffs of > 30 min for total sleep time and > 5% for sleep efficiency. Multiple regression models showed that Jawbone UP “Sound sleep” measure was predicted by PSG time in N2 (β = 0.25), time in rapid eye movement (β = 0.29), and arousal index (β = −0.34). Jawbone UP “Light sleep” measure was predicted by PSG time in N2 (β = 0.48), time in N3 (β = 0.49), arousal index (β = 0.38) and awakening index (β = 0.28). Jawbone UP showed a progression from slight overestimation to underestimation of total sleep time and sleep efficiency with advancing age. All relationships were similar in boys and girls.
Conclusions:
Jawbone UP shows good agreement with polysomnography in measures of total sleep time and wake after sleep onset in adolescent boys and girls. Further validation is needed in other age groups and clinical populations before advocating use of these inexpensive and easy-to-use devices in clinical sleep medicine and research.
Citation:
de Zambotti M, Baker FC, Colrain IM. Validation of sleep-tracking technology compared with polysomnography in adolescents. SLEEP 2015;38(9):1461–1468.
Keywords: actigraphy, adolescence, fitness tracker, polysomnography, sleep
INTRODUCTION
Polysomnography (PSG) is the gold standard for evaluating sleep in basic and clinical sleep research. However, there are several disadvantages of this technique; it is expensive, intrusive, time consuming for individuals and evaluators, impractical for long-term in-laboratory and at home recordings, and has limited availability. These limitations have led to the development of other methodologies to objectively evaluate sleep.
Wrist actigraphy is firmly established as the main alternative to PSG, particularly in a non-laboratory setting. Actigraphy is based on the assumption that people move most during wake states with a progressive reduction in motion as they approach the deepest stages of sleep, such that sleep/wake states may be discriminated by measuring and analyzing these movements.1 Actigraph devices are relatively accessible in terms of cost, are easy to use, and can be worn for prolonged period of time (24 h/day for more than 1 w) providing an exhaustive picture of sleep/wake cycles. Also, actigraphy does not require any particular effort from individuals and can be used in their natural environment. Several actigraph devices are available on the market having different levels of agreement with PSG, which mainly depend on the scoring algorithm used.2 Even though actigraphy shows a limited ability to detect wakefulness after sleep onset (low specificity) with a decrease in accuracy associated with an increase in wake time3; the ability of detecting sleep states (sensitivity) is relatively good in adults.4–6
Actigraphy has also been validated in pediatric populations7; however, there are challenges unique to this population. Adolescence is characterized by dramatic changes in sleep duration, timing, and composition.8,9 With advancing age, adolescents tend to go to bed later, have a shorter sleep duration, and show a ∼40% reduction in slow wave sleep (SWS).10 Motor activity is highest in epochs of waking and Stage 1 sleep, and duration of immobility is longest in SWS11 and thus, the marked age-related changes in sleep architecture across adolescence may affect the algorithms used by actigraphic devices to detect sleep/wake patterns. A recent study reported age-dependent changes in the agreement between PSG and actigraphy, with actigraphic devices underestimating total sleep time (TST) in preschoolers and school-aged children (age 6–12 y) and overestimating TST in adolescents (age 13–18 y).12 Also, within adolescents, Short and colleagues13 found changes in the agreement between subjective and actigraphic WASO with pubertal status; higher agreement was found in less pubertally mature boys than in more mature adolescent boys. Sex also may affect the accuracy of actigraphy. Adolescent boys move more than girls during sleep,14 leading to inflated amounts of WASO being scored with actigraphy compared with PSG in boys.15 Adherence is another challenging issue in pediatric populations. In an investigation of how many nights are necessary to provide reliable actigraphic data in children and adolescents, Acebo and colleagues16 showed that noncompliance together with illness and technical problems contributed to a loss of 28% of weekly actigraphic data; these authors suggested that at least 7 nights are necessary to obtain 5 nights of reliable actigraphic data.
In recent years, the increasing availability of novel wearable health technology17–23 and in particular the explosion of fitness trackers (e.g. Fitbit Flex, Nike+ FuelBand, Jawbone UP band, Garmin vίvofit, Misfit shine, and flash) has made actigraphy available to the general population and it is now considered normal to track one's daily activity and sleep and receive feedback about one's overall health. This technology, with three-axis accelerometer sensors, high memory storage capability, and a high sampling rate, offers an inexpensive, appealing, and accessible way to measure sleep with simple interfaces with a dedicated app that runs on iPhones, iPod, iPad, Android phones, and other devices. Although the spread of wearable sleep tracking technology opens the possibility of recording sleep on a large scale, it remains to be determined how accurately these devices assess sleep and wake.17,18
To our knowledge, among the commercially available activity trackers, the reliability and validity of only one device (Fitbit Flex) has been tested against PSG and actigraphy.24 The study authors simultaneously recorded PSG, actigraphic, and Fitbit data from a single laboratory-based overnight recording in 24 healthy adults (age range: 19–41 y). They showed that both Fitbit and actigraphs had a high sensitivity. Also, similar to actigraphy, Fitbit overestimated sleep efficiency (mean ± standard deviation [SD]: 14.5 ± 10.7 %) and total sleep time (mean ± SD: 67.1 ± 51.3 min) with poorest agreement against PSG in individuals with lower sleep efficiencies and sleep time. These results suggest that Fitbit may be an acceptable sleep tracker device for use in healthy adults. No studies have investigated the validity of commercial activity tracker devices in an adolescent population.
The aim of our study was to test the agreement between a commercially available activity tracker (Jawbone UP) and gold-standard PSG in assessing sleep outcomes from a laboratory-based overnight recording in a large sample of male and female adolescents, accounting for potential confounding effects of age and sex.
METHOD
Participants
Sixty-five adolescents age 12–22 y (28 females; age, mean ± SD: 15.8 ± 2.5 y; ethnicity, 49 Caucasian; body mass index, mean ± SD: 21.2 ± 3.5 kg/m2) recruited from schools in the San Francisco Bay area constituted the final sample. They were participants at SRI International in an ongoing multisite study of adolescents (National Consortium on Alcohol and NeuroDevelopment in Adolescence, NCANDA). Participants were screened with questionnaires and the Semi-Structured Assessment for the Genetics of Alcoholism (SSAGA)25 to ensure they were healthy and did not suffer from any psychiatric disorder including alcohol dependence. None of the participants suffered from a sleep disorder (e.g. sleep disordered breathing, periodic limb movement disorder, narcolepsy) based on clinical measures including air flow, oxygen saturation, and leg movements recorded during a laboratory PSG adaptation night.
All participants gave their written informed consent and received payment for their participation. The study was approved by the Institutional Review Board at SRI International.
Procedure
All assessments took place in the sleep laboratory at SRI International. Participants slept in sound-attenuated, temperature-controlled bedrooms. Lights-out and lights-on times were self-selected by participants.
Polysomnographic Recording
PSG included electroencephalographic (EEG; F3-M2, F4-M1, C3-M2, C4-M1, O1-M2, O2-M1), bipolar submental electromyographic (EMG), and electrooculographic (EOG; E1-M2, E2-M1) recordings performed according to American Academy of Sleep Medicine (AASM) rules.26 Sleep stages (Wake, N1, N2, N3, rapid eye movement [REM] sleep) were scored in 30- sec epochs according to standard criteria.26 EEG, EMG, and EOG signals were sampled at 256 Hz; EEG and EOG were filtered at 0.3–35Hz; EMG was filtered at 10–100Hz.
The following standard sleep parameters were calculated: time in bed (TIB, min) as time from lights-out to lights-on, TST (min), total wake time (TWT, min) as time awake within TIB, sleep efficiency (SE, %) as TST/TIB*100, sleep onset latency (SOL, min) as time from the lights-out to the first epoch of any sleep stage, wake after sleep onset (WASO, min) as the amount of wake after the sleep onset, REM latency (min), awakening index as average number of awakenings per hour of sleep, and arousal index as average number of arousals (defined as an abrupt shift in EEG frequency that lasts at least 3 sec according to AASM26) per hour of sleep, and time spent in each stage of sleep (N1, N2, N3, and REM sleep, min).
Jawbone UP
Each participant was fitted with a Jawbone UP device, placed on their nondominant hand for the duration of the overnight recording. Data were collected via a dedicated Jawbone UP app running on an iPad. Jawbone UP (https://jawbone.com/up) powered by MotionX (Fullpower Technologies, Inc.) consists of a sweat-proof, water-resistant wristband designed to be worn 24 h, 7 days a week; it is equipped with a precision motion sensor (three-axis accelerometer) that tracks body movements. Using proprietary algorithms, Jawbone UP calculates daily activity as well as sleep. A small button on the band allows switching from “active mode” to “sleep mode” and vice versa. Sleep laboratory technicians were responsible for switching on the Jawbone UP active/sleep tracking mode in synchronization with the times of lights-out and lights-on (the average of the mean differences in TIB [PSG minus Jawbone UP] was −0.05 ± 2.4 min).
From Jawbone UP we used the following standard sleep measures that are provided in the app: “In bed for” (min; the equivalent of PSG TIB), “You slept” (min; the equivalent of PSG TST), “Awake for” (min; the equivalent of PSG TWT), “Fell asleep” (min; the equivalent of PSG SOL), time spent in “Sound sleep” (min) and time spent in “Light sleep” (min). From these outcome measures we also calculated the amount of wake spent after sleep onset (calculated as “Awake for” minus “Fell asleep”, min; the equivalent of PSG-WASO) and the efficiency of sleep (calculated as “You Slept” divided by “In bed for” multiplied by 100, %; the equivalent of PSG SE).
To our knowledge, it is not possible to access the raw data collected by Jawbone UP and no information on the algorithm is publicly available.
Analyses
Mean, SD, ± 95% confidence interval (CI) for all PSG and Jawbone UP sleep measures were calculated. P was set at 0.05 for all analyses.
Differences between Jawbone UP and PSG sleep variables were compared with paired t tests. Agreement between methods was estimated according to Bland and Altman.27 Mean (or bias) and SD of the differences between Jawbone UP and PSG outcomes, lower and upper agreement limits (mean difference ± 1.96 SD) and 95% CI for mean differences and agreement limits are provided. A positive value of the mean difference between Jawbone UP and PSG sleep indicates that Jawbone UP underestimates PSG, whereas a negative value indicates that Jawbone UP overestimates PSG sleep.
Similar to others,12,24,28 we defined a priori differences between Jawbone UP and PSG of ≤ 30 min for TST, TWT, WASO, and < 5% for SE as satisfactory. The percentage of participants falling within these ranges is provided.
Because adolescence is a period marked by dramatic age-dependent changes in sleep patterns,9 we tested the relationship between age and mean differences (PSG – Jawbone UP) of selected PSG and Jawbone UP sleep variables using Pearson correlations. Because relationships between PSG and actigraphy measures may differ in adolescent boys and girls,13,15 we also compared the mean differences between PSG and Jawbone UP in males and females using independent t tests and ran correlations between age and mean differences between PSG and Jawbone UP outcomes separately in males and females. Correlation coefficients (r), P values, and linear equations are provided for each analysis.
Finally, we investigated which PSG sleep measures better predicted Jawbone UP “Sound sleep” and “Light sleep.” Given the explorative nature of the analyses and the number of potential predictors we used forward stepwise regression models with PSG WASO, time in REM, N1, N2, and N3 sleep, awakening index, and arousal index as independent factors. Variables were entered into the model if they were significant contributors to the variance (F-to-enter = 3.84). F values and P values for the models, as well as beta coefficients (β) and P values of the significant predictors are provided for each analysis.
RESULTS
Jawbone UP and PSG Sleep Measures
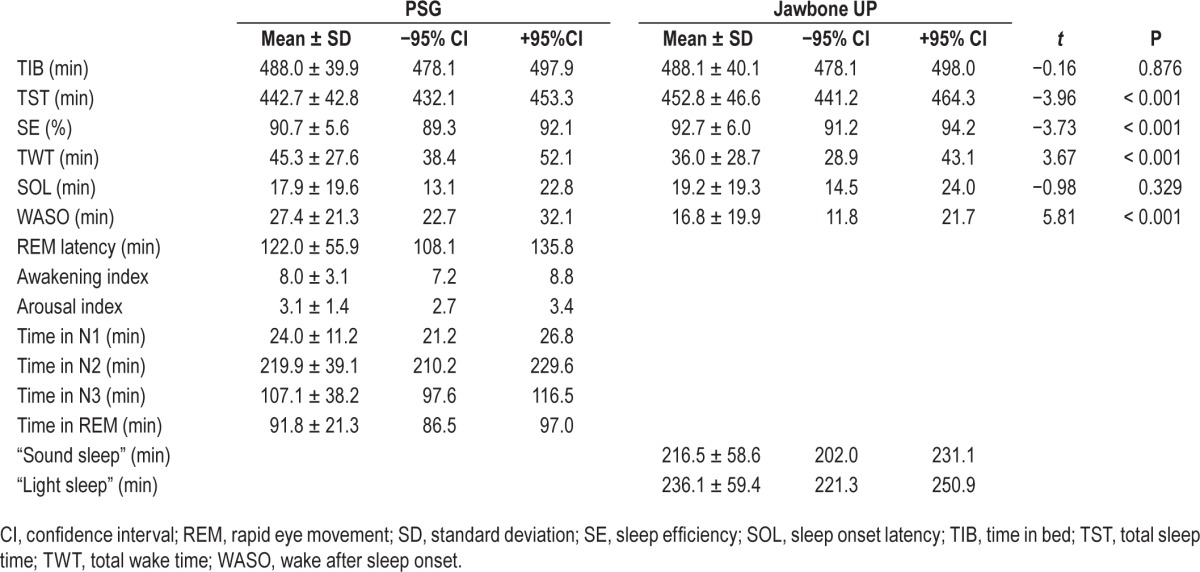
Mean, SD and ± 95% CI for all PSG and Jawbone UP sleep measures are provided in Table 1.
Table 1.
PSG and Jawbone UP sleep outcomes (mean, standard deviation, ± 95% confidence interval) from one overnight recording in 65 healthy adolescents.
Agreement between Jawbone UP and PSG Sleep Outcomes
Bland-Altman plots for TST, SE, TWT, SOL, and WASO are displayed in Figure 1. Bias and agreement limits are summarized in Table 2.
Figure 1.

Bland-Altman plots for total sleep time (TST), sleep efficiency (SE), total wake time (TWT), sleep onset latency (SOL), and wake after sleep onset (WASO) recorded by Jawbone UP and polysomnography. Average, mean (or bias) of the differences between Jawbone UP and PSG outcomes, lower and upper agreement limits (mean difference ± 1.96 standard deviation) and 95% confidence interval for mean differences and agreement limits (dotted line) are displayed for each Bland-Altman plot.
Table 2.
Bias and agreement limits for Bland-Altman plot between Jawbone UP and polysomnography sleep outcomes in 65 adolescents.
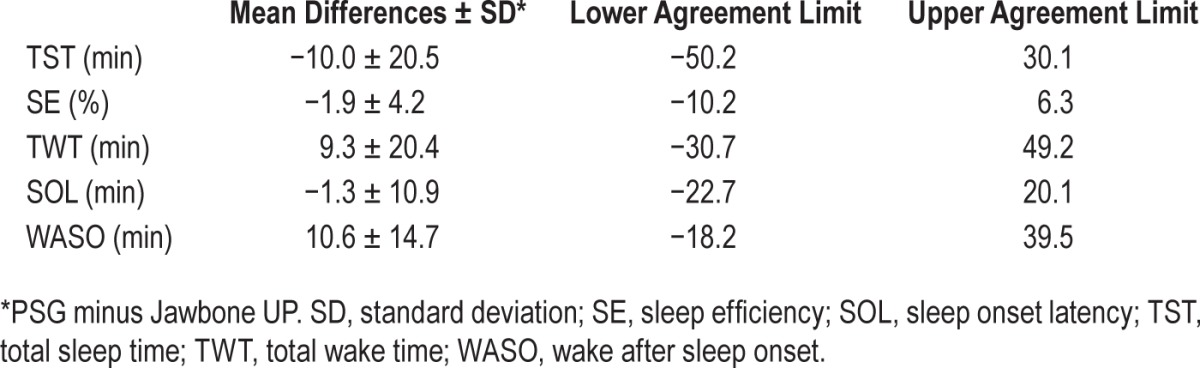
Paired t tests showed that all sleep outcomes from Jawbone UP were significantly different from corresponding PSG measures (all P < 0.001) apart from SOL (P = 0.329). Jawbone UP overestimated PSG TST by, on average, 10.0 min (± 95% CI: −15.1, −5.0) with three participants falling outside the agreement limits (lower limit = −50.2 min; upper limit = 30.1 min). The mean difference between PSG and Jawbone measures of TST fell within the a priori established satisfactory range, with 85.6% of the sample falling within this range. Similarly, Jawbone UP overestimated PSG SE by, on average, 1.9% (± 95% CI: −3.0, −0.9) with four participants falling outside the agreement limits (lower limit = −10.2%; upper limit = 6.3%). The mean difference between PSG and Jawbone measures of SE fell within the a priori established satisfactory range, with 73.8% of the sample falling within this range. Jawbone UP underestimated PSG TWT by, on average, 9.3 min (± 95% CI: 4.2, 14.3) with three participants falling outside the limits of agreement (−30.7 min, lower limit; 49.2, upper limit). The mean difference between PSG and Jawbone measures of TWT fell within the a priori established satisfactory range, with 83.1% of the sample falling within this range. Even though it was not significantly different from PSG, Jawbone UP overestimated SOL by, on average, 1.3 min (± 95% CI: −4.0, 1.4) with all but four most participants falling within narrow intervals of agreement (lower limit = −22.7 min; upper limit = 20.1 min). Finally, Jawbone UP underestimated PSG WASO by, on average, 10.6 min (± 95% CI: 7.0, 14.3) with three participants falling outside the limits of agreement (−18.2 min, lower limit; 39.5, upper limit). The mean difference between PSG and Jawbone measures of WASO fell within the a priori established satisfactory range, with 89.2% of the sample falling within this range.
Multiple Regression Models to Predict Jawbone UP “Sound sleep” and “Light sleep” Outcomes
PSG time in N2 (β = 0.25, P = 0.031), time in REM (β = 0.29, P = 0.009), and arousal index (β = −0.34, P = 0.003) were significant pre -dictors of UP band “Sound sleep” (F3,61 = 10.70, P < 0.001) explaining 34.5% of the total variance. PSG time in N2 (β = 0.48, P < 0.001), time in N3 (β = 0.49, P < 0.001), arousal index (β = 0.38, P = 0.002) and awakening index (β = 0.28, P = 0.018) were significant predictors of UP band “Light sleep” (F4,60 = 6.52, P < 0.001), explaining 30.0% of the total variance.
Age- and Sex-Dependent Changes in the Mean Differences between PSG and Jawbone UP Outcomes
Age (x) significantly correlated with the mean differences (PSG – Jawbone UP; y) of TST (r = −0.62, P < 0.001, y = −5.1x + 70.4) and SE (r = −0.63, P < 0.001, y = −0.01x + 0.1) with Jawbone Up showing a progression from underestimation to overestimation of PSG sleep with advancing age (Figure 2). Age also correlated with mean differences of TWT (r = 0.62, P < 0.001, y = 5.1x - 70.8), SOL (r = 0.47, P < 0.001, y = 2.1x - 34.0) and WASO (r = 0.51, P < 0.001, y = 3.0x - 36.9). Jawbone UP showed a progression from overestimation to underestimation of PSG measures of these variables with advancing age. From Figure 2, it is notable that the agreement between PSG and Jawbone UP sleep outcomes progressively decreased from younger to older adolescents.
Figure 2.

Correlations between age and mean differences (PSG – Jawbone UP) in total sleep time (TST), sleep efficiency (SE), total wake time (TWT), sleep onset latency (SOL) and wake after sleep onset (WASO) in male and female adolescents. Pearson product-moment correlation coefficients (r) and P values are displayed on each graph separately for males and females.
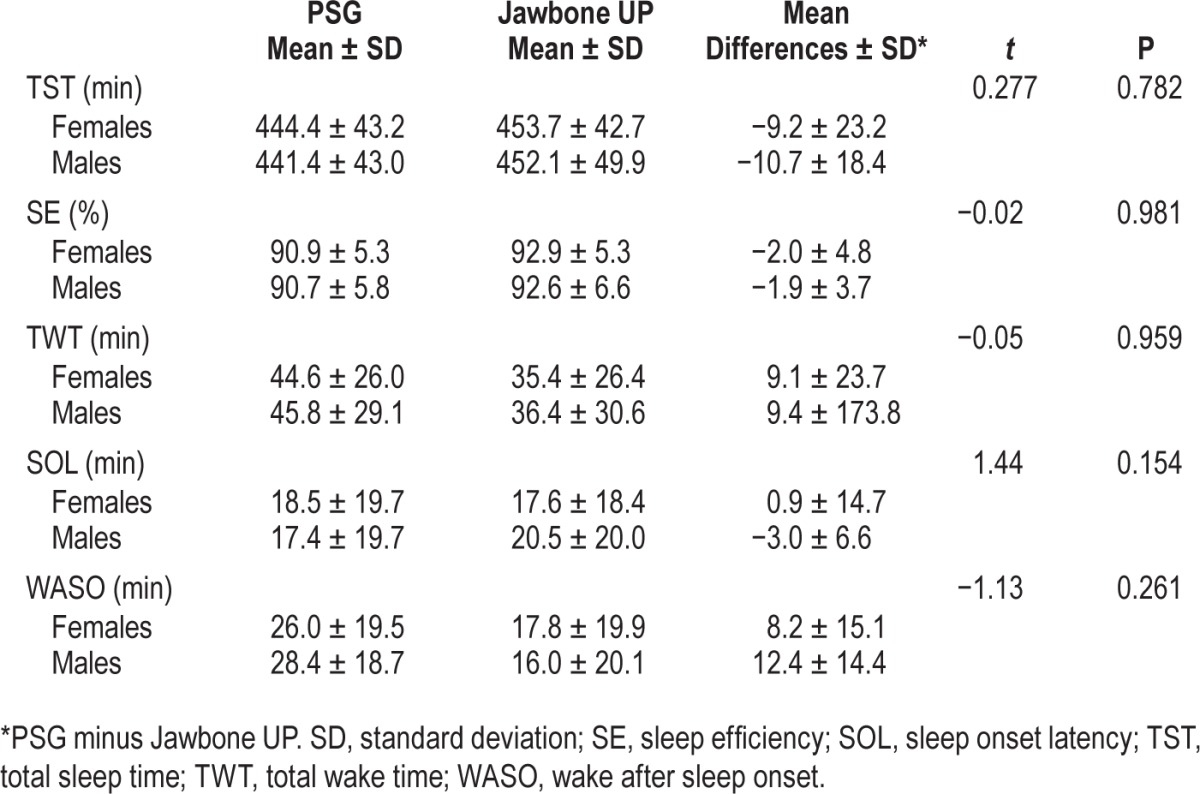
The average of the mean differences between PSG and Jawbone UP were not significantly different in males than females in any of the sleep outcomes (P > 0.05) (Table 3). All correlations between age and mean differences between PSG and Jawbone UP outcomes run separately for male and female adolescents remained significant (P < 0.05) with Fisher r-toz transformation that failed to find any significant sex differences in correlation coefficients (P > 0.05). Correlations are displayed in Figure 2 for males and females separately.
Table 3.
Mean values and standard deviation, and average of the mean differences (polysomnography-Jawbone UP) for selected sleep outcomes in 37 male and 28 female adolescents with corresponding statistical measures.
DISCUSSION
Jawbone UP has good agreement with PSG particularly in the estimation of TST, SE, and SOL in a large sample of healthy adolescent boys and girls without sleep disorders.
Similar to the majority of the literature testing the validity of actigraphy against PSG in adolescents,7,12,15,29 our data indicated that Jawbone UP tends to overestimate PSG TST and SE. The only other published study testing the reliability and validity of a similar fitness tracker device (Fitbit) in healthy adults also found that the device overestimated PSG TST and sleep efficiency.24 The Jawbone UP band tended to underestimate WASO when the whole sample of adolescents was considered in our study. However, although the Bland-Altman intervals of agreements were quite wide, the mean differences between PSG and Jawbone UP TWT (9.3 ± 20.4 min) and WASO (10.6 ± 14.7 min) were small and were, on average, nonclinically meaningful based on a priori determined cutoffs. Similar to Montgomery-Downs et al.,24 the percentage of participants falling outside satisfactory limits of agreement ranged from 10.8% to 26.2%, especially when PSG amount of wake was high; all participants falling outside satisfactory limits were in the higher half of the data sample based on the median value of TWT). Further validation of this and other similar devices, therefore, should be performed in clinical populations who may have high amounts of wakefulness.
Interestingly, our results showed strong age-dependent effects in the estimate of PSG sleep outcomes from Jawbone UP. Jawbone UP underestimated PSG TST and SE in the youngest adolescents and progressively overestimated them in older adolescents; also, Jawbone UP overestimated the PSG-derived TWT and SOL in the youngest adolescents and progressively underestimated these variables in older adolescents. Our results also suggested that the agreement between PSG and Jawbone UP decreased with increasing age (Figure 2). Similarly, Meltzer and colleagues12 found that, on average, actigraphy underestimated TST in preschool children (3–5 y), and in school-age children (6–12 y), although to a lesser extent, and overestimated the TST in adolescents (13–18 y); the same but inverted pattern was obtained for the amount of WASO. These results suggest a continuum from childhood to adolescence in the extent of agreement between movement-based tracking devices and PSG, showing that age is an important factor to be considered in the development of novel algorithms for motion analysis in sleep-wake assessment. Similarly, Short and colleagues13 found changes in the agreement between subjective and actigraphic WASO with developmental stage (based on pubertal ratings, using age as a covariate), with a higher agreement in less pubertally mature boys than in more mature adolescent boys. Even if highly correlated with each other, the reciprocal contributions of pubertal status and chronological age to the discrepancies between PSG and actigraphy remain to be determined. Another possible explanation for the age-dependent changes in accuracy may be related to the sample tested by companies in the validation of the algorithm used to detect sleep/wake pattern. In fact, Meltzer and colleagues12 explained the stronger underestimation of TST and SE by Motionlogger Sleep Watch (Ambulatory Monitoring Inc.) in the preschool group compared to school-age children and adolescents by the fact that the Sadeh algorithm used was developed and validated in a sample of adolescents/young adults. Those authors concluded that Motionlogger Sleep Watch performed best for their group of adolescents.
Our results did not confirm the previous results of Johnson and colleagues15 showing sex-related differences in the discrepancy between actigraphic and PSG measures of sleep. Our results indicated similar discrepancies between Jawbone UP and PSG sleep outcomes in male and female adolescents, who also showed similar age-dependent changes in the discrepancy between Jawbone UP and PSG sleep. Thus, sex did not affect the accuracy of Jawbone UP in detecting sleep and wake states. A direct comparison between Jawbone UP and standard actigraphy is needed to clarify if these differences are due to a different accuracy of the devices (Jawbone UP versus standard actigraphy) in assessing sleep/wake pattern or if it is due to other factors more related to the population studied.
Our findings indicated that Jawbone UP “Sound sleep” was positively associated with PSG time in N2 and time in REM, and negatively associated with the arousal index. These significant predictors accounted for about a third of the overall variance. Jawbone “Sound sleep” seems to represent stages of PSG sleep associated with fewer movements but surprisingly, what is commonly defined “the deepest PSG sleep stage,” i.e. N3,30 failed to enter in the model. Jawbone UP “Light sleep” was positively associated with the PSG arousal index, awakening index, and time in N2 and N3. These significant predictors accounted for about one-third of the overall variance. PSG awakenings as well as brief arousals frequently occur in light sleep, but they do not strictly represent what is commonly considered PSG light sleep, i.e., N1 or N1+N2 sleep.30 Surprisingly, PSG time in N3, but not time in N1, was a significant predictor of Jawbone UP “Light sleep” even though N3 is considered the deepest stage of sleep. For both models, the awakening index but not WASO entered in the models, probably because the awakening index better reflects movements. In summary, we can only speculate on the meaning of these results given the lack of an exhaustive definition of “Sound sleep” and “Light sleep” publicly available from Jawbone Company. As a recognized limitation,31 activity monitors are accurate in distinguishing sleep from wake but not in measuring depth of sleep as defined with PSG.
Our study has several limitations: (1) It is based on a single overnight recording, which does not allow the examination of the within-subject reliability of PSG and Jawbone UP sleep outcomes. (2) Our sample only consisted of healthy adolescents without any sleep issues and our results therefore cannot be extended to a clinical population. (3) The study was conducted in a sleep laboratory environment in which participants, even if free to decide light-off and light-on times, had to follow a strict protocol and where technicians ensured the quality of the data collection. For instance, the active/sleep mode of Jawbone UP was switched on and off by the sleep technicians who ensured synchronization between PSG and Jawbone UP time in bed. This study therefore needs to be replicated in an at-home environment. (4) We compared Jawbone UP to standard PSG only. Thus, further comparisons of Jawbone UP with standard actigraphy are also needed. (5) We were unable to evaluate epoch-by-epoch comparisons between Jawbone UP and PSG sleep/wake state, and thus sensitivity and specificity of Jawbone UP remain to be determined.
We need to acknowledge that three participants repeatedly fell outside the Bland-Altman intervals of agreement for all the variables analyzed. By exploring the distribution of these participants within each variable, none of them were outliers (> 3 SD from the mean) or showed extreme values in any of the PSG sleep variables analyzed. A combination of several other unknown factors may have driven the Jawbone UP algorithm to fail in accurately detecting sleep/wake pattern in these participants.
Technological advancements in health care have led to the wide availability of user-friendly and accessible devices (e.g., activity tracking devices based on accelerometer sensors) capable of assessing an individual's fitness and recently, sleep. The market for these wearable tracker bands is large and growing, involving several millions of consumers.18 Our findings show the validity of one of these devices, Jawbone UP, in tracking sleep-wake activity in healthy adolescents, compared with PSG. Further validation needs to be performed in different age groups and clinical populations, particularly in individuals with fragmented sleep, to allow future use of these devices in basic and clinical sleep medicine.
DISCLOSURE STATEMENT
This was not an industry supported study. This study was supported by National Consortium on Alcohol and NeuroDevelopment in Adolescence (NCANDA); grant: U01 AA021696. The authors have indicated no financial conflicts of interest.
ACKNOWLEDGMENTS
The authors thank Justin Greco, David Sugarbaker, David Dresser, Stephanie Claudatos, Sarah Inkelis, and Lena Kardos for their effort in the data collection process.
Footnotes
A commentary on this article appears in this issue on page 1351.
REFERENCES
- 1.Ancoli-Israel S, Cole R, Alessi C, Chambers M, Moorcroft W, Pollak C. The role of actigraphy in the study of sleep and circadian rhythms. Sleep. 2003;26:342–92. doi: 10.1093/sleep/26.3.342. [DOI] [PubMed] [Google Scholar]
- 2.Van de Water A, Holmes A, Hurley D. Objective measurements of sleep for non-laboratory settings as alternatives to polysomnography--a systematic review. J Sleep Res. 2011;20:183–200. doi: 10.1111/j.1365-2869.2009.00814.x. [DOI] [PubMed] [Google Scholar]
- 3.Paquet J, Kawinska A, Carrier J. Wake detection capacity of actigraphy during sleep. Sleep. 2007;30:1362–9. doi: 10.1093/sleep/30.10.1362. [DOI] [PMC free article] [PubMed] [Google Scholar]
- 4.de Souza L, Benedito-Silva A, Pires M, Poyares D, Tufik S, Calil H. Further validation of actigraphy for sleep studies. Sleep. 2003;26:81–5. doi: 10.1093/sleep/26.1.81. [DOI] [PubMed] [Google Scholar]
- 5.Sadeh A. The role and validity of actigraphy in sleep medicine: an update. Sleep Med Rev. 2011;15:259–67. doi: 10.1016/j.smrv.2010.10.001. [DOI] [PubMed] [Google Scholar]
- 6.Martin J, Hakim A. Wrist actigraphy. Chest. 2011;139:1514–27. doi: 10.1378/chest.10-1872. [DOI] [PMC free article] [PubMed] [Google Scholar]
- 7.Meltzer LJ, Montgomery-Downs HE, Insana SP, Walsh CM. Use of actigraphy for assessment in pediatric sleep research. Sleep Med Rev. 2012;16:463–75. doi: 10.1016/j.smrv.2011.10.002. [DOI] [PMC free article] [PubMed] [Google Scholar]
- 8.Campbell I, Bromberger J, Buysse D, et al. Evaluation of the association of menopausal status with delta and beta EEG activity during sleep. Sleep. 2011;34:1561–8. doi: 10.5665/sleep.1398. [DOI] [PMC free article] [PubMed] [Google Scholar]
- 9.Colrain I, Baker F. Changes in sleep as a function of adolescent development. Neuropsychol Rev. 2011;21:5–21. doi: 10.1007/s11065-010-9155-5. [DOI] [PMC free article] [PubMed] [Google Scholar]
- 10.Carskadon M. The second decade. In: Guilleminault C, editor. Sleeping and waking disorders: indications and techniques. Menlo Park, CA: Addison-Wesley Publishing Co., Medical/Nursing Division; 1982. pp. 99–125. [Google Scholar]
- 11.Middelkoop H, Van Hilten B, Kramer C, Kamphuisen H. Actigraphically recorded motor activity and immobility across sleep cycles and stages in healthy male subjects. J Sleep Res. 1993;2:28–33. doi: 10.1111/j.1365-2869.1993.tb00057.x. [DOI] [PubMed] [Google Scholar]
- 12.Meltzer L, Walsh C, Traylor J, Westin A. Direct comparison of two new actigraphs and polysomnography in children and adolescents. Sleep. 2012;35:159–66. doi: 10.5665/sleep.1608. [DOI] [PMC free article] [PubMed] [Google Scholar]
- 13.Short M, Gradisar M, Lack L, Wright H, Carskadon M. The discrepancy between actigraphic and sleep diary measures of sleep in adolescents. Sleep Med Rev. 2012;13:378–84. doi: 10.1016/j.sleep.2011.11.005. [DOI] [PubMed] [Google Scholar]
- 14.Gaina A, Sekine M, Hamanishi S, Chen X, Kagamimori S. Gender and temporal differences in sleep-wake patterns in Japanese schoolchildren. Sleep. 2005;28:337–42. [PubMed] [Google Scholar]
- 15.Johnson N, Kirchner H, Rosen C, et al. Sleep estimation using wrist actigraphy in adolescents with and without sleep disordered breathing: a comparison of three data modes. Sleep. 2007;30:899–905. doi: 10.1093/sleep/30.7.899. [DOI] [PMC free article] [PubMed] [Google Scholar]
- 16.Acebo C, Sadeh A, Seifer R, et al. Estimating sleep patterns with activity monitoring in children and adolescents: how many nights are necessary for reliable measures? Sleep. 1999;22:95–103. doi: 10.1093/sleep/22.1.95. [DOI] [PubMed] [Google Scholar]
- 17.Grifantini K. How's my sleep? Personal sleep trackers are gaining in popularity, but their accuracy is still open to debate. IEEE Pulse. 2014;5:14–8. doi: 10.1109/MPUL.2014.2339252. [DOI] [PubMed] [Google Scholar]
- 18.Fischer S. Sleep on it: sleep might just be the most important part of daily health--and the biggest new target for biomedical engineering. IEEE Pulse. 2014;5:8–13. doi: 10.1109/MPUL.2014.2339251. [DOI] [PubMed] [Google Scholar]
- 19.Chen K, Bassett D., Jr The technology of accelerometry-based activity monitors: current and future. Med Sci Sports Exerc. 2005;37:S490–S500. doi: 10.1249/01.mss.0000185571.49104.82. [DOI] [PubMed] [Google Scholar]
- 20.Steins D, Dawes H, Esser P, Collett J. Wearable accelerometry-based technology capable of assessing functional activities in neurological populations in community settings: a systematic review. J Neuroeng Rehabil. 2014;11:36. doi: 10.1186/1743-0003-11-36. [DOI] [PMC free article] [PubMed] [Google Scholar]
- 21.Guo F, Li Y, Kankanhalli MS, Brown MS. An evaluation of wearable activity monitoring devices. Proceedings of PDM ‘13, the 1st ACM international workshop on personal data meets distributed multimedia; October 21-25, 2013; Barcelona, Spain. New York, NY: Association for Computing Machinery; 2013. pp. 31–4. [Google Scholar]
- 22.Dobkin B. Wearable motion sensors to continuously measure real-world physical activities. Curr Opin Neurol. 2013;26:602–8. doi: 10.1097/WCO.0000000000000026. [DOI] [PMC free article] [PubMed] [Google Scholar]
- 23.Lowe S, Olaighin G. Monitoring human health behaviour in one's living environment: a technological review. Med Eng Phys. 2014;36:147–68. doi: 10.1016/j.medengphy.2013.11.010. [DOI] [PubMed] [Google Scholar]
- 24.Montgomery-Downs H, Insana S, Bond J. Movement toward a novel activity monitoring device. Sleep Breath. 2012;16:913–7. doi: 10.1007/s11325-011-0585-y. [DOI] [PubMed] [Google Scholar]
- 25.Bucholz K, Cadoret R, Cloninger C, et al. A new, semi-structured psychiatric interview for use in genetic linkage studies: a report on the reliability of the SSAGA. J Stud Alcohol. 1994;55:149–58. doi: 10.15288/jsa.1994.55.149. [DOI] [PubMed] [Google Scholar]
- 26.Iber C, Ancoli-Israel S, Chesson A, Quan SF for the American Academy of Sleep Medicine. The AASM manual for the scoring of sleep and associated events: rules, terminology and technical specifications. 1st ed. Westchester, IL: American Academy of Sleep Medicine; 2007. [Google Scholar]
- 27.Bland J, Altman D. Statistical methods for assessing agreement between two methods of clinical measurement. Lancet. 1986;1:307–10. [PubMed] [Google Scholar]
- 28.Werner H, Molinari L, Guyer C, Jenni O. Agreement rates between actigraphy, diary, and questionnaire for children's sleep patterns. Arch Pediatr Adolesc Med. 2008;162:350–8. doi: 10.1001/archpedi.162.4.350. [DOI] [PubMed] [Google Scholar]
- 29.Weiss A, Johnson N, Berger N, Redline S. Validity of activity-based devices to estimate sleep. J Clin Sleep Med. 2010;6:336–42. [PMC free article] [PubMed] [Google Scholar]
- 30.Carskadon M, Dement W. Normal human sleep: an overview. In: Kryger M, Roth T, Dement W, editors. Principles and practice of sleep medicine. St. Louis, MO: Elsevier Saunders; 2011. pp. 16–26. [Google Scholar]
- 31.Tryon W. Issues of validity in actigraphic sleep assessment. Sleep. 2004;27:158165. doi: 10.1093/sleep/27.1.158. [DOI] [PubMed] [Google Scholar]