Abstract
Background:
The human immune response to Mycobacterium tuberculosis is mediated by macrophages and T-lymphocytes. The alveolar macrophage phagocyting mycobacterium produces interleukin (IL)-1 as an inflammatory mediator, and IL-8 as a cytokine for leukocyte recruitment and granuloma formation. Interleukin-1 receptor antagonist (IL-1ra) is an internal antagonist of IL-1.
Methods:
Plasma levels of IL-1ra and IL-8 and other serologic markers were measured in 18 patients with active tuberculosis before treatment and after 2 months and 6 months of treatment.
Results:
During treatment with antituberculous medication, patients showed significant changes in hemoglobin, hematocrit, white blood cells (WBC), platelet, erythrocyte sedimentation rate (ESR), C-reactive protein (CRP), ferritin and plasma IL-1ra. After 2 months of treatment, ESR and CRP diminished significantly; after 6 months, hemoglobin increased while WBC, platelet, ESR, CRP and ferritin decreased significantly compared to their pre-treatment levels. There were two groups: patients with delayed therapeutic responses, and patients with early responses. At each point of observation, the former group of patients showed lower body weight and lower levels of hemoglobin and hematocrit, and higher levels of WBC, platelet, ESR, IL-8 and IL-1ra than the latter group. During the course of the treatment, we observed considerable differences in body weight, body mass index, hemoglobin, hematocrit, WBC and platelet counts, ESR, CRP and ferritin in both the early-response and delayed-response groups.
Conclusion:
We believe that the plasma concentrations of IL-1ra and IL-8, which showed different peaks during the course of treatment, reflected their different functions and patterns of secretion. Moreover the concentrations did not seem as sensitive as other inflammatory markers to evaluate disease activity during antituberculosis treatment. However, IL-1ra can be considered a marker for disease activity and response to treatment.
Keywords: Tuberculosis, Receptor Antagonist Interleukin-1, Interleukin-8
INTRODUCTION
Tuberculosis is an infectious disease with a long history. Despite the development of effective anti-tuberculosis drugs, its prevalence has been increasing associated with appearances of acquired immunodeficiency syndrome and drug-resistant tuberculosis, which make it difficult to manage and prevent tuberculosis. Understanding the pathogenesis of tuberculosis will help advance therapy from one currently based on anti-tuberculosis drugs to one using immune regulation.
Cell-mediated immune response to Mycobacterium tuberculosis is primarily mediated by macrophages and T-lymphocytes1, 2). M. tuberculosis can invade and multiply in tissue macrophages as well as in alveolar macrophages2). Macrophages ingesting M. tuberculosis produce a characteristic pattern of cytokines, including tumor necrosis factor (TNF)-α, interleukin (IL)-1, IL-6, IL-8, IL-10, IL-12, transforming growth factor (TGF)-β, monocyte chemoattractant protein (MCP)-1, and regulated on activation, normal T-cell expressed and secreted (RANTES)2–4). In addition, they process and present mycobacterial antigens to T-lymphocytes, which in turn produce additional cytokines. These cytokines produced by macrophages and T-lymphocytes reactivate macrophages, which remove M. tuberculosis more effectively. On the other hand, cytotoxic T-lymphocytes lyse macrophages and the other cells infected with M. tuberculosis. Cytotoxic T-cells can directly inhibit mycobacterial growth5) and release bacilli that can be ingested and killed by macrophages with greater anti-mycobacterial activity6).
In this study, to evaluate the changes in plasma IL-1 receptor antagonist, the cytokine levels of an endogenous inhibitor of IL-1, a pivotal proinflammatory cytokine, and IL-8, a chemokine for leukocytes recruitment and granuloma formation, they were compared with other inflammatory markers as patients with active pulmonary tuberculosis received treatment.
MATERIALS AND METHODS
1. Subject
Among patients that visited the Ewha Womans Mokdong Hospital from February 2000, 18 patients with active pulmonary tuberculosis were selected. In order to be diagnosed with active pulmonary tuberculosis, patients needed to show at least one of the following: lesions suggesting active tuberculosis on chest X-rays that are associated with positive acid-fast bacilli (AFB) staining of sputum, endobronchial tuberculosis on bronchoscopy, or a biopsy finding consistent with tuberculosis.
Depending on how patients responded, they were classified into early-response and delayed-response. Delayed-response patients were defined as those that showed either no clinical improvement or no negative conversion of positive sputum AFB after 2 month. At the same time, they exhibited at least one of the following: drug resistance, associated illness compromising host immune response, endobronchial tuberculosis involving main bronchus, and associated extrapulmonary tuberculosis. Those that did not fit this criteria were considered early-response7–9) (Table 1).
Table 1.
Definition of delayed response*
| Major criteria |
| No clinical improvement at 2 months treatment (e.g., fever, weight loss, etc) |
| No conversion of positive sputum AFB to negative at 2 months treatment |
| Minor criteria |
| Drug resistance of Mycobacterium tuberculosis |
| Associated illness compromising host immune response (e.g., diabetes mellitus, etc) |
| Endobronchial tuberculosis involving main bronchus |
| Pulmonary tuberculosis with extrapulmonary involvement |
It needs at least one among major criteria and at least one among minor criteria.
2. Methods
For all patients, we recorded their age, sex, height, presence of hemoptysis, past history of anti-tuberculosis treatment, presence of associated illness and history of hospitalization. In addition, we examined chest X-rays and sputum AFB smears, and in AFB-positive cases, we performed culture and drug-sensitivity tests for M. tuberculosis.
Before treatment and after 2 and 6 months of treatment, we measured body weight and calculated body mass index (BMI). Three milliliters of blood was extracted into a tube containing anticoagulant potassium EDTA and centrifuged at 4°C and 3,500 rpm for 10 minutes. The plasma was collected and stored at −80°C. We measured the concentrations of IL-1ra and IL-8 three times for each sample using a commercialized IL-1ra ELISA kit (R&D Systems, MN, USA) and IL-8 ELISA kit (Endogen, MA, USA), and calculated the mean values.
As hematologic markers, hemoglobin, hematocrit, white blood cells (WBC) and platelets were measured with the Coulter Model STKS electronic automated counter (Beckman Coulter Electronics, Hialeah, Florida, USA), while the erythrocyte sedimentation rate (ESR) was measured using the Westergren method. As other serologic markers, C-reactive protein (CRP) was measured by rate nephelometry using the analyzer of a specific protein and a CRP calibrator (Beckman Coulter Electronics, Hialeah, Florida, USA). Serum lactate dehydrogenase (LD) was measured by ultraviolet method (Olympus, Japan), and serum ferritin was measured by radioimmunoassay using kit (Diagnostic Products Co., USA).
We calculated the data into mean and SD and used SPSS-PC for statistic analysis. To compare variables at the three intervals, we applied one-way ANOVA and Scheffe’s post-hoc test. We used repeated GLM measurements to analyze differences between early response and delayed response patients.
RESULTS
The mean age of the 18 subjects (11 males and 7 females) was 43.6±21.9 years. On diagnosis, the mean BMI was 19.5±2.4 kg/m2. There were 3 retreatment cases and 3 diabetic patients. Twelve patients had positive sputum AFB smears; one had negative smear but positive AFB culture, and one showed positive AFB in bronchial washing. Among 12 patients receiving drug-sensitivity tests, we found two drug resistant cases. Five patients had endobronchial tuberculosis, and two patients with confirmative biopsy were complicated with TB lymphadenitis and intestinal TB, respectively (Table 2). Thirteen patients belonged to the early-response group, and 5 patients belonged to the delayed-response group according to the criteria in Table 1.
Table 2.
Clinical characteristics in patients with tuberculosis
| Variables | Mean±SD (range) or frequency (percentage) |
|---|---|
| Age (years) | 43.6±21.9 (20–84) |
| Male Sex | 11/18 (61.1%) |
| Body mass index (kg/m2) before treatment | 19.5±2.4 (16.4–26.1) |
| Past history of anti-tuberculosis treatment | 3/18 (16.7%) |
| Family history of anti-tuberculosis treatment | 2/8 (25%) |
| Hemoptysis | 5/18 (27.8%) |
| Associated with diabetes mellitus | 3/18 (16.7%) |
| Hospitalization | 12/18 (66.7%) |
| Evidence of active tuberculosis | |
| Radiologic tuberculosis | 18/18 (100%) |
| Sputum AFB positive | 12/18 (66.7%) |
| Endobronchial tuberculosis | 4/18 (22.2%) |
| Biopsy confirmed tuberculosis | 1/18 (5.6%) |
| Drug-resistant tuberculosis | 2/12 (16.6%) |
Hemoglobin, hematocrit, WBCs, platelets, ESR, CRP, ferritin, and plasma IL-1ra changed significantly during the treatment period. After 2 months of treatment, ESR and CRP were significantly diminished. After 6 months of treatment, hemoglobin increased and WBCs, platelets, ESR, and ferritin decreased significantly from pre-treatment levels (Table 3).
Table 3.
Changes of serologic markers and cytokines during antituberculous treatment
| Time from chemotherapy | Before (N=18) | 2 months (N=18) | 6 months (N=18) |
|---|---|---|---|
| Body weight (kg) | 52.9±8.2 | 54.1±9.0 | 55.4±10.1 |
| Body mass index (kg/m2) | 19.5±2.4 | 20.0±2.7 | 20.4±2.9 |
| Hemoglobin† (g/dL) | 11.6±1.7 | 12.6±1.4 | 13.0±1.8* |
| Hematocrit† (%) | 34.7±4.9 | 37.8±3.6 | 38.2±4.7 |
| WBC count†† (×1,000/mm3) | 9.0±2.6 | 7.4±2.0 | 6.1±2.2** |
| Platelet count† (×1,000/mm3) | 379.8±132.6 | 313.8±115.8 | 278.9±107.1* |
| ESR††† (mm/hour) | 71.6±28.8 | 39.4±36.5* | 22.5±26.7*** |
| CRP††† (mg/dL) | 7.1±7.1 | 1.5±2.4** | 0.3±60.72*** |
| Ferritin (mg/dL) | 273.0±214.5 | 189.4±158.9 | 103.7±104.7* |
| LD (U/L) | 337.9±113.2 | 303.1± 54.3 | 317.8±59.1 |
| IL-1ra† (pg/mL) | 387.3±311.3 | 210.7±203.3 | 224.5±128.2 |
| IL-8 (pg/mL) | 1.59±2.95 | 3.8±16.48 | 2.13±5.87 |
Data are mean±SD.
p<0.05,
p<0.01,
p<0.001 by one-way ANOVA.
p<0.05,
p<0.01,
p<0.001 vs. before treatment by multiple comparison using post-hoc test of Scheffe. ESR, erythrocyte sedimentation rate; CRP, C-reactive protein; LD, lactate dehydrogenase; IL-1ra, interleukin-1 receptor antagonist; IL-8, interleukin-8
At each measurement, the delayed-response patients showed lower body weight, hemoglobin and hematocrit, and higher WBCs, platelets, ESR, IL-8 and IL-1ra than the early-response patients. During the course of the treatment, there were significant differences in body weight, body mass index, hemoglobin, hematocrit, WBCs, platelets, ESR, CRP and ferritin within both groups (Table 4, Figure 1–6).
Table 4.
Changes of serologic markers and cytokines according to clinical response during antituberculous treatment
| Variables | Before treatment | 2 months’ treatment | 6 months’ treatment |
|---|---|---|---|
| Body weight (kg) | |||
| Early response | 55.5±6.4 | 56.8±7.2* | 57.7±8.7* |
| Delayed response† | 46.1±9.0 | 47.1±10.0* | 49.6±12.4* |
| Body mass index (kg/m2) | |||
| Early response | 20.1±2.4 | 20.6±2.7* | 20.9±2.8* |
| Delayed response | 17.9±1.5 | 18.3±2.0* | 19.2±3.2* |
| Hemoglobin (g/dL) | |||
| Early response | 12.1±1.4 | 13.0±1.2** | 13.5±1.3** |
| Delayed response† | 10.2±1.8 | 11.5±1.4** | 11.5±2.2** |
| Hematocrit (%) | |||
| Early response | 36.2±3.6 | 38.8±3.0** | 39.5±3.6** |
| Delayed response† | 30.8±6.2 | 35.2±4.2** | 34.7±6.0** |
| WBC count (1,000/mm3) | |||
| Early response | 8.9±2.9 | 6.7±1.1** | 5.4±1.0** |
| Delayed response† | 9.3±2.1 | 9.2±2.7** | 8.2±3.2** |
| Platelet count (1,000/mm3) | |||
| Early response | 350.6±110.4 | 271.9±81.4*** | 240.0±58.5*** |
| Delayed response† | 455.6±167.9 | 422.8±128.7*** | 380.2±144.1*** |
| ESR (mm/hour) | |||
| Early response | 61.2±25.7 | 21.8±23.7*** | 12.5±18.5*** |
| Delayed response†† | 98.4±17.7 | 85.0±19.7*** | 48.4±28.8*** |
| CRP (mg/dL) | |||
| Early response | 6.30±7.46 | 0.4±81.07** | 0.01±0.14** |
| Delayed response | 9.06±6.55 | 4.0±82.93** | 1.04±1.15** |
| Ferritin (mg/dL) | |||
| Early response | 268.3±221.9 | 180.4±166.9** | 110.3±112.0** |
| Delayed response | 285.3±218.4 | 212.8±151.0** | 86.7±92.1** |
| LD (U/L) | |||
| Early response | 333.3±99.3 | 308.4±59.4 | 322.1±68.1 |
| Delayed response | 350.0±157.1 | 289.4±40.4 | 306.8±26.8 |
| IL-1ra (pg/mL) | |||
| Early response | 356.0±331.0 | 151.9±56.6 | 169.0±44.0 |
| Delayed response† | 442.2±289.7 | 348.6±362.3 | 380.8±166.7 |
| IL-8 (pg/mL) | |||
| Early response | 0.73±1.68 | 1.25±3.03 | 0.38±0.92 |
| Delayed response††† | 3.61±4.66 | 10.35±8.49 | 6.75±10.42 |
Data are mean±SD.
p<0.05,
p<0.01,
p<0.001 vs. early response by GLM, repeated measure, between subjects.
p<0.05,
p<0.01,
p<0.001 vs. before treatment by GLM, repeated measure, within subject. All abbreviations as in Table 3.
Figure 1.
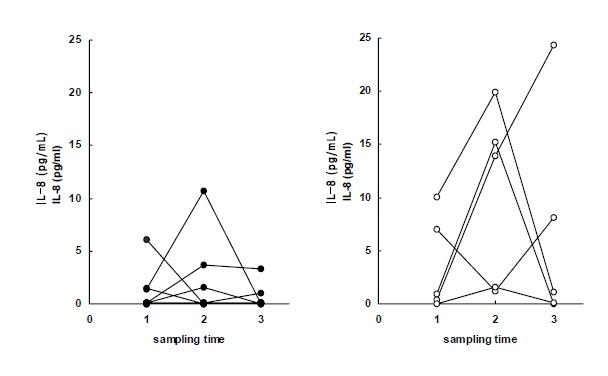
Plasma levels of IL-8 in early response group (left) and delayed response group (right) to anti-tuberculous treatment. Sampling time (1) just before chemotherapy, (2) after 2 months of chemotherapy, (3) after 6 months of chemotherapy.
Figure 2.
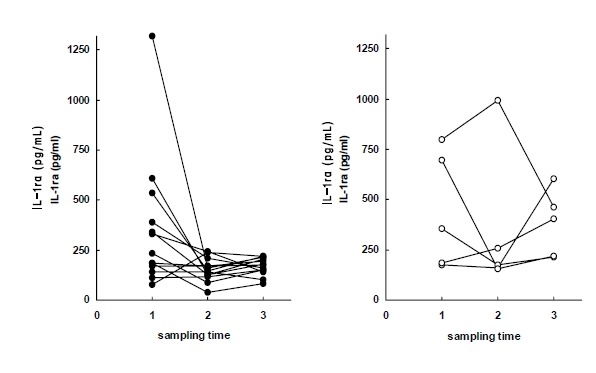
Plasma levels of IL-1ra in early response group (left) and delayed response group (right) to antituberculous treatment. Sampling time (1) just before chemotherapy, (2) after 2 months of chemotherapy, (3) after 6 months of chemotherapy.
Figure 3.
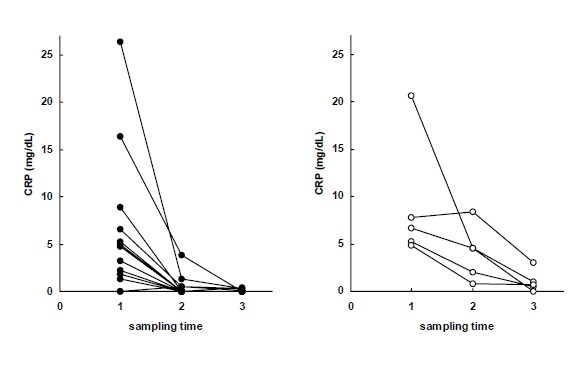
Serum levels of CRP in early response group (left) and delayed response group (right) to antituberculous treatment. Sampling time (1) just before chemotherapy, (2) after 2 months of chemotherapy, (3) after 6 months of chemotherapy.
Figure 4.
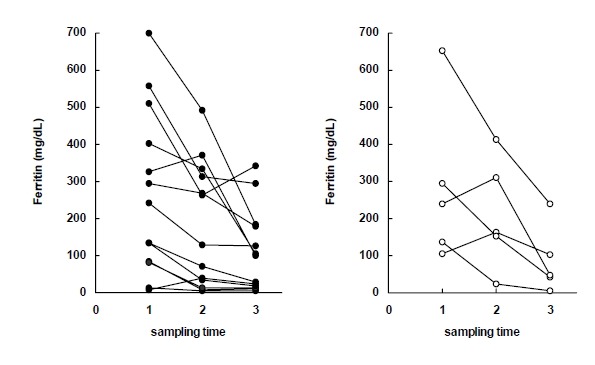
Serum levels of Ferritin in early response group (left) and delayed response group (right) to antituberculous treatment. Sampling time (1) just before chemotherapy, (2) after 2 months of chemotherapy, (3) after 6 months of chemotherapy.
Figure 5.
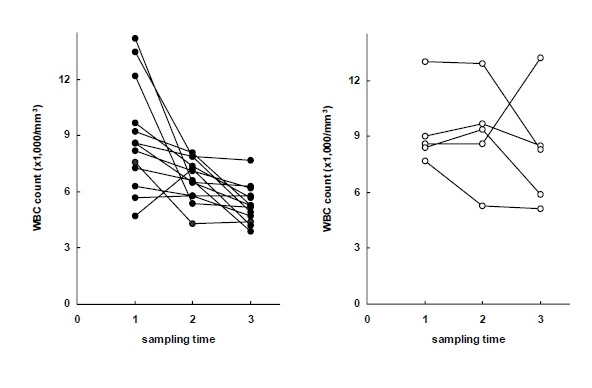
WBC counts in early response group (left) and delayed response group (right) to antituberculous treatment. Sampling time (1) just before chemotherapy, (2) after 2 months of chemotherapy, (3) after 6 months of chemotherapy.
Figure 6.
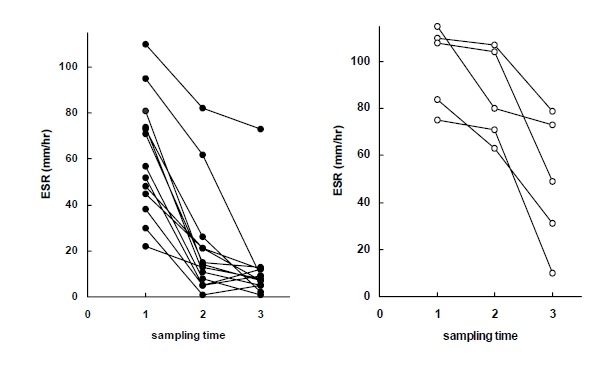
ESR in early response group (left) and delayed response group (right) to antituberculous treatment. Sampling time (1) just before chemotherapy, (2) after 2 months of chemotherapy, (3) after 6 months of chemotherapy.
DISCUSSION
Cytokines have multiple functions as intercellular signaling substances through intracellular signal transduction and the second messenger pathway10, 11). So far, among many known cytokines, IL-1 and TNF-α are the earliest cytokines secreted by infection and play a central role in orchestrating an inflammatory response. When infected by M. tuberculosis, not only do alveolar macrophages recruit T-lymphocytes and secret IL-1 for antigen presentation, but they also inhibit the effect of IL-1 by producing IL-1ra12). While plasma IL-1 and TNF-α were not easily detectable, IL-1ra serum concentrations increased in patients with severe symptoms, such as fever, and correlated with clinical courses13). Since IL-1ra acts by binding to a IL-1 receptor and alveolar macrophages are known to normally produce IL-1ra after their elaboration of IL-1, we assumed IL-1ra to be an integral, self-limiting measure. Under stimulation from IL-4, which are produced by Th2 CD4 cells, there was early and enhanced production of IL-1ra and reduced production of IL-1, potentially a mechanism to preserve the lung from excessive inflammation14). In previous studies, the plasma IL-1ra level increased at the early stage of sepsis15–17). Moreover, in experimental models, injection of endotoxin increased plasma IL-1ra16, 17). Tsao et al. noted an imbalance between cytokines and their endogenous receptors or antagonists by demonstrating increased ratios of TNF-α to soluble TNF-α receptors and IL-1 to IL-1ra in bronchoalveolar lavage (BAL) fluids of patients with cavitary pulmonary tuberculosis18).
In this study, to evaluate the dynamics of plasma IL-1ra and IL-8 levels, we compared these with other hematologic and serologic parameters. During treatment, body weight, BMI, hemoglobin, and hematocrit improved and WBCs platelets, ESR, CRP, and ferritin diminished. Since these findings were consistent with previous studies19–21), these parameters served as a good standard for evaluating IL-1ra and IL-8. The plasma IL-1ra level was highest before treatment and this indirectly reflects increased production of IL-1. In particular the concentration of IL-1ra declined rapidly in the early-response group after treatment. Similar to ESR and CRP, IL-1ra could be useful as a marker reflecting disease activity and treatment response in patients with tuberculosis.
IL-8 is a chemokine that attracts lymphocytes as well as polymorphonuclear neutrophils. M. tuberculosis, ingested by human monocytes, is a strong stimulus for gene expression and secretion of IL-8 and chemotaxis of antigen-specific T-lymphocytes22–24). IL-8 plays a role in leukocytes recruitment and granuloma formation25). Following phagocytosis of M. tuberculosis, human polymorphonuclear neutrophils secrete IL-8 to attract inflammatory cells to the inflammation site26, 27). Considering the role of IL-8, its local concentration was expected to be much higher than its systemic concentration and IL-8 concentration of BAL, pleural fluid, and cerebrospinal fluid in tuberculous patients were appreciated28–30), whereas some reports showed blood level of IL-8 was relatively higher than the other chemokines were28, 31) and high plasma IL-8 level was observed in patients dying of tuberculosis32). In addition, others observed high plasma concentration of IL-8 in patients with severe sepsis and Plasmodium falciparum infections33, 34).
Since early inflammatory cytokines act on effecter cells, which Secrete IL-8, we assumed the peak point of IL-8 secretion to be different from that of IL-1ra. We observed higher plasma IL-8 levels after 2 months of treatment than those before treatment. Furthermore, delayed-response patients exhibited higher plasma IL-8 concentrations than early response patients at all three intervals. In particular, the IL-8 level after 6 months was higher than pre-treatment level in the delayed-response group. IL-8 seemed to be an indicator for delayed inflammatory response. In order to confirm this, an investigation using a longer follow-up period and a larger pool is needed. Moreover, plasma IL-8 measurements may not be enough to elucidate the role of IL-8 related to local infection or inflammation35), and considering IL-8 activity in tissue, its plasma concentration should be different from the tissue’s concentration.
In this study, IL-1ra and IL-8 did not seem to be as sensitive as other serologic markers to reflect diminished inflammatory responses related to treatment. While other markers were easily measured, measurements of IL-1ra and IL-8 by ELISA showed low reproducibility, and their clinical application may be limited. IL-1ra is an endogenous inhibitor of IL-1, which is a proinflammatory cytokine that induces fever, weight loss, and hypotension with TNF-α, and indirectly reflects the degree of IL-1 production. In patients with active pulmonary tuberculosis, IL-1ra could be a marker to evaluate disease activity and treatment response. A study including a long follow-up period is required to better evaluate the significance of IL-8 as an indicator of delayed response.
REFERENCES
- 1.Daniel TM, Boom WH, Ellner JJ. Immunology of tuberculosis. In: Reichman LB, Hershfield ES, editors. Tuberculosis: a comprehensive international approach. 2nd ed. New York: Marcel Dekker; 2000. pp. 187–214. [Google Scholar]
- 2.Barnes PF. Tuberculosis. In: Nelson S, Martin TR, editors. Cytokines in pulmonary disease. New York: Marcel Dekker; 2000. pp. 189–212. [Google Scholar]
- 3.Toossi Z, Kleinhenz ME, Ellner JJ. Defective interleukin-2 production and responsiveness in human pulmonary tuberculosis. J Exp Med. 1986;163:1162–1172. doi: 10.1084/jem.163.5.1162. [DOI] [PMC free article] [PubMed] [Google Scholar]
- 4.Toossi Z, Gogate P, Shiratsuchi H, Young T, Ellner JJ. Enhanced production of TGF-beta by blood monocytes from patients with active tuberculosis and presence of TGF-beta in tuberculosis granulomatous lung lesions. J Immunol. 1995;154:465–473. [PubMed] [Google Scholar]
- 5.Stenger S, Mazzaccaro RJ, Uyemura K, Cho S, Barnes PF, Rosat JP, Sette A, Brenner MB, Procelli SA, Bloom BR, Modlin RL. Differential effects of cytolytic T cell subsets on intracellular infection. Science. 1997;276:1684–1687. doi: 10.1126/science.276.5319.1684. [DOI] [PubMed] [Google Scholar]
- 6.Kaufmann SH. Immunity to intracellular microbial pathogens. Immunol Today. 1995;16:338–342. doi: 10.1016/0167-5699(95)80151-0. [DOI] [PubMed] [Google Scholar]
- 7.Horsburgh CR, Jr, Feldman S, Ridzon R. Practice Guideline for the treatment of tuberculosis. Clin Infect Dis. 2000;31:633–639. doi: 10.1086/314007. [DOI] [PubMed] [Google Scholar]
- 8.Shim YS. Endobronchial tuberculosis. Respirology. 1996;1:95–106. doi: 10.1111/j.1440-1843.1996.tb00017.x. [DOI] [PubMed] [Google Scholar]
- 9.Stelianides S, Belmatoug N, Fantin B. Manifestations and diagnosis of extrapulmonary tuberculosis. Rev Mal Respir. 1997;14:S72–S87. [PubMed] [Google Scholar]
- 10.Corrigan CJ. Cytokines (Interleukins) In: Kay AB, editor. Allergy and allergic disease. 1st ed. Malden: Blackwell Science; 1997. pp. 340–353. [Google Scholar]
- 11.Paul WE. T-cell-derived lymphokines in the immune response. Cell. 1989;57:521–524. doi: 10.1016/0092-8674(89)90121-9. [DOI] [PubMed] [Google Scholar]
- 12.Galve-de Rochemonteix B, Nicod LP, Chicheportice R, Lacraz S, Baumberger C, Dayer JM. Regulation of interleukin-1ra, interleukin-1 alpha, and interleukin-1 beta production by human alveolar macrophages with phorbol myristate acetate, lipopolysaccharide, and interleukin-4. Am J Respir Cell Mol Biol. 1993;8:160–168. doi: 10.1165/ajrcmb/8.2.160. [DOI] [PubMed] [Google Scholar]
- 13.Juffermans NP, Verbon A, van Deventer SJ, van Deutekom H, Speelman P, van der Poll T. Tumor necrosis factor and interleukin-1 inhibitors as markers of disease activity of tuberculosis. Am J Respir Crit Care Med. 1998;157:1328–1331. doi: 10.1164/ajrccm.157.4.9709126. [DOI] [PubMed] [Google Scholar]
- 14.Iseman MD. Immunity and pathogenesis. In: Iseman MD, editor. A clinician’s guide to tuberculosis. 1st ed. Philadelphia: Williams & Wilkins; 2002. pp. 63–96. [Google Scholar]
- 15.Giri JG, Wells J, Dower SK, McCall CE, Guzman RN, Slack J, Bird TA, Shanebeck K, Grabstein KH, Sims JE, Alderson MR. Elevated levels of shed type II IL-1 receptor in sepsis. Potential role for type II receptor in regulation of IL-1 responses. J Immunol. 1994;153:5802–5809. [PubMed] [Google Scholar]
- 16.van der Poll T, de Waal Malefyt R, Coyle SM, Lowry SF. Antiinflammatory cytokine responses during clinical sepsis and experimental endotoxemia: sequential measurements of plasma soluble interleukin-1 receptor type II, IL-10, and IL-13. J Infect Dis. 1997;175:118–122. doi: 10.1093/infdis/175.1.118. [DOI] [PubMed] [Google Scholar]
- 17.Fischer E, van Zee KJ, Marano MA, Rock CS, Kenney JS, Poutsiaka DD, Dinarello CA, Lowry SF, Moldawer LL. Interleukin-1 receptor antagonist circulates in experimental inflammation and in human disease. Blood. 1992;79:2196–2200. [PubMed] [Google Scholar]
- 18.Tsao TC, Hong J, Li LF, Hsieh MJ, Liao SK, Chang KS. Imbalances between tumor necrosis factor-alpha and its soluble receptor forms, and interleukin-1 beta and interleukin-1 receptor antagonist in BAL fluid of cavitary pulmonary tuberculosis. Chest. 2000;117:103–109. doi: 10.1378/chest.117.1.103. [DOI] [PubMed] [Google Scholar]
- 19.Baynes RD, Flax H, Bothwell TH, Bezwoda WR, MacPhail AP, Atkinson P, Lewis D. Haematological and iron-related measurements in active pulmonary tuberculosis. Scand J Haematol. 1986;36:280–287. doi: 10.1111/j.1600-0609.1986.tb01735.x. [DOI] [PubMed] [Google Scholar]
- 20.Baynes R, Bezwoda W, Bothwell T, Khan Q, Mansoor N. The non-immune inflammatory response: serial changes in plasma iron, iron-binding capacity, lactoferrin, ferritin and C-reactive protein. Scand J Clin Lab invest. 1986;46:695–704. doi: 10.3109/00365518609083733. [DOI] [PubMed] [Google Scholar]
- 21.Lawn SD, Obeng J, Acheampong JW, Griffin GE. Resolution of the acute-phase response in West African patients receiving treatment for pulmonary tuberculosis. Int J Tuberc Lung Dis. 2000;4:340–344. [PubMed] [Google Scholar]
- 22.Pace E, Gjomarkaj M, Melis M, Profita M, Spatafora M, Vignola AM, Bonsignore G, Mody CH. Interleukin-8 induces lymphocyte chemotaxis into the pleural space. Role of pleural macrophages. Am J Respir Crit Care Med. 1999;159:1592–1599. doi: 10.1164/ajrccm.159.5.9806001. [DOI] [PubMed] [Google Scholar]
- 23.Friedland JS, Remick DG, Shattock R, Griffin GE. Secretion of interleukin-8 following phagocytosis of Mycobacterium tuberculosis by human monocyte cell lines. Eur J Immunol. 1992;22:1373–1378. doi: 10.1002/eji.1830220607. [DOI] [PubMed] [Google Scholar]
- 24.Zhang Y, Broser M, Cohen H, Bodkin M, Law K, Reibman J, Rom WN. Enhanced interleukin-8 release and gene expression in macrophages after exposure to Mycobacterium tuberculosis and its components. J Clin Invest. 1995;95:586–592. doi: 10.1172/JCI117702. [DOI] [PMC free article] [PubMed] [Google Scholar]
- 25.Friedland JS. Chemokines and human infection. Clin Sci. 1995;88:393–400. doi: 10.1042/cs0880393. [DOI] [PubMed] [Google Scholar]
- 26.Riedel DD, Kaufmann SH. Chemokine secretion by human polymorphonuclear granulocytes alter stimulation with Mycobacterium tuberculosis and lipoarabinomannan. Infect Immun. 1997;65:4620–4623. doi: 10.1128/iai.65.11.4620-4623.1997. [DOI] [PMC free article] [PubMed] [Google Scholar]
- 27.Kasahara K, Sato I, Ogura K, Takeuchi H, Kobayashi K, Adachi M. Expression of chemokines and induction of rapid cell death in human blood neutrophils by Mycobacterium tuberculosis. J Infect Dis. 1998;178:127–137. doi: 10.1086/515585. [DOI] [PubMed] [Google Scholar]
- 28.Kurashima K, Mukaida N, Fujimura M, Yasui M, Nakazumi Y, Matsuda T, Matsushima K. Elevated chemokine levels in bronchoalveolar lavage fluid of tuberculosis patients. Am J Respir Crit Care Med. 1997;155:1474–1477. doi: 10.1164/ajrccm.155.4.9105097. [DOI] [PubMed] [Google Scholar]
- 29.Hoheisel G, Izbicki G, Roth M, Chan CH, Leung JC, Reichenberger F, Schauer J, Perruchoud AP. Compartmentalization of proinflammatory cytokines in tuberculous pleurisy. Respir Med. 1998;92:14–17. doi: 10.1016/s0954-6111(98)90025-7. [DOI] [PubMed] [Google Scholar]
- 30.Mastroianni CM, Lancella L, Mengoni F, Lichtner M, Santopadre P, D'Agostino C, Ticca F, Vullo V. Chemokine profiles in the cerebrospinal fluid (CSF) during the course of pyogenic and tuberculous meningitis. Clin Exp Immunol. 1998;114:210–214. doi: 10.1046/j.1365-2249.1998.00698.x. [DOI] [PMC free article] [PubMed] [Google Scholar]
- 31.Sadek MI, Sada E, Toossi Z, Schwander SK, Rich EA. Chemokines induced by infection of mononuclear phagocytes with mycobacteria and present in lung alveoli during active pulmonary tuberculosis. Am J Respir Cell Mol Biol. 1998;19:513–521. doi: 10.1165/ajrcmb.19.3.2815. [DOI] [PubMed] [Google Scholar]
- 32.Friedland JS, Hartley JC, Hartley CG, Shattock RJ, Griffin GE. Inhibition of ex vivo proinflammatory cytokine secretion in fatal Mycobacterium tuberculosis infection. Clin Exp Immunol. 1995;100:233–238. doi: 10.1111/j.1365-2249.1995.tb03659.x. [DOI] [PMC free article] [PubMed] [Google Scholar]
- 33.Friedland JS, Ho M, Remick DG, Bunnag D, White NJ, Griffin GE. Interleukin-8 and Plasmodium falciparum malaria in Thailand. Trans R Soc Trop Med Hyg. 1993;87:54–55. doi: 10.1016/0035-9203(93)90417-o. [DOI] [PubMed] [Google Scholar]
- 34.Gimbrone MA, Jr, Obin MS, Brock AF, Luis EA, Hass PE, Hebert CA, Yip YK, Leung DW, Lowe DG, Kohr WJ. Endothelial interleukin-8: a novel inhibitor of leucocyte-endothelial interactions. Science. 1989;246:1601–1603. doi: 10.1126/science.2688092. [DOI] [PubMed] [Google Scholar]
- 35.Rot A. Neutrophil attractant/activation protein-1 (interleukin-8) induces in vitro neutrophil migration by haptotactic mechanism. Eur J Immunol. 1993;23:303–306. doi: 10.1002/eji.1830230150. [DOI] [PubMed] [Google Scholar]


