Abstract
During development, cells interpret complex, often conflicting signals to make optimal decisions. Plant stomata, the cellular interface between a plant and the atmosphere, develop according to positional cues including a family of secreted peptides, EPIDERMAL PATTERNING FACTORS (EPFs). How these signaling peptides orchestrate pattern formation at a molecular level remains unclear. Here we report that Stomagen/EPF-LIKE9 peptide, which promotes stomatal development, requires ERECTA (ER)-family receptor kinases and interferes with the inhibition of stomatal development by the EPF2-ER module. Both EPF2 and Stomagen directly bind to ER and its co-receptor TOO MANY MOUTHS. Stomagen peptide competitively replaced EPF2 binding to ER. Furthermore, application of EPF2, but not Stomagen, elicited rapid phosphorylation of downstream signaling components in vivo. Our findings demonstrate how a plant receptor agonist and antagonist define inhibitory and inductive cues to fine-tune tissue patterning on the plant epidermis.
Introduction
Development and pattern formation of multicellular organisms rely on diffusible signals that instruct cells to adopt specific fate for optimal function, and hence organismal fitness. Often such signals are encoded by multiple gene families, which impose the question of how a given cell orchestrates the decision-making process. For instance, a family of secreted signals, such as FGFs, are used in an iterative manner to specify multiple, diverse developmental processes in animals1. While peptide signaling has recently emerged as a critical regulator of plant development2, how specific members of plant peptide families share and distribute functions remains unclear. Patterning of stomata, valves on the plant epidermis that mediate carbon-dioxide acquisition and water control, relies on cell-cell communication, which specifies a subset of seemingly-uniform protodermal cells to acquire stomatal-progenitor fate. Two secreted cysteine-rich peptides, EPIDERMAL PATTERNING FACTOR 1 (EPF1) and EPF2, are expressed in later and earlier stages of stomatal precursors, respectively, and are perceived by the cell-surface receptors, ER-family leucine-rich repeat receptor kinases (LRR-RKs): ER, ER-LIKE1 (ERL1) and ERL2, to inhibit stomatal development3-7. A receptor-like protein TOO MANY MOUTHS (TMM) modulates the signaling strengths of ER-family in a region-specific manner6,8. Genetic evidence suggests that the signals are mediated via a MAP kinase cascade, which eventually downregulates the transcription factor responsible for initiating stomatal-lineage via direct phosphorylation9-12.
Recently, EPF-LIKE9 (EPFL9) peptide, also known as Stomagen, was identified as a positive regulator of stomatal development, a role opposite to EPF1 and EPF213-17. Structural modeling of the EPF/EPFL-family peptides using the NMR-solved structure of Stomagen predicts that they all adopt related structures16. How can structurally-related peptides confer completely opposite developmental responses? The molecular mechanism for Stomagen action remains unknown.
Stomagen acts downstream of ER-family
To place Stomagen into a genetic framework of the core stomatal signaling pathway, we first examined the effects of induced STOMAGEN overexpression (iSTOMAGEN) on er erl1 erl2 phenotypes by estradiol-induction system or co-suppression by artificial micro RNA (STOMAGEN-ami)(Fig. 1, Extended Data Figs. 1, 2). As previously reported13,14, ectopic iSTOMAGEN resulted in increases in stomatal density (SD: number of stomata per mm2), stomatal index (SI: percentage of stomata per total number of stomatal and non-stomatal epidermal cells), and severe stomatal clustering in wild-type cotyledon epidermis (Fig. 1a, b, j, Extended Data Figs. 1-3). In contrast, iSTOMAGEN had no effects on SD, SI, or stomatal clusters in er erl1 erl2 cotyledons just like in tmm (Fig. 1, Extended Data Fig. 3)13,14, suggesting that STOMAGEN and ER-family act in the same pathway.
Fig. 1. Complete loss of ER-family genes confers insensitivity to STOMAGEN overexpression and co-suppression.
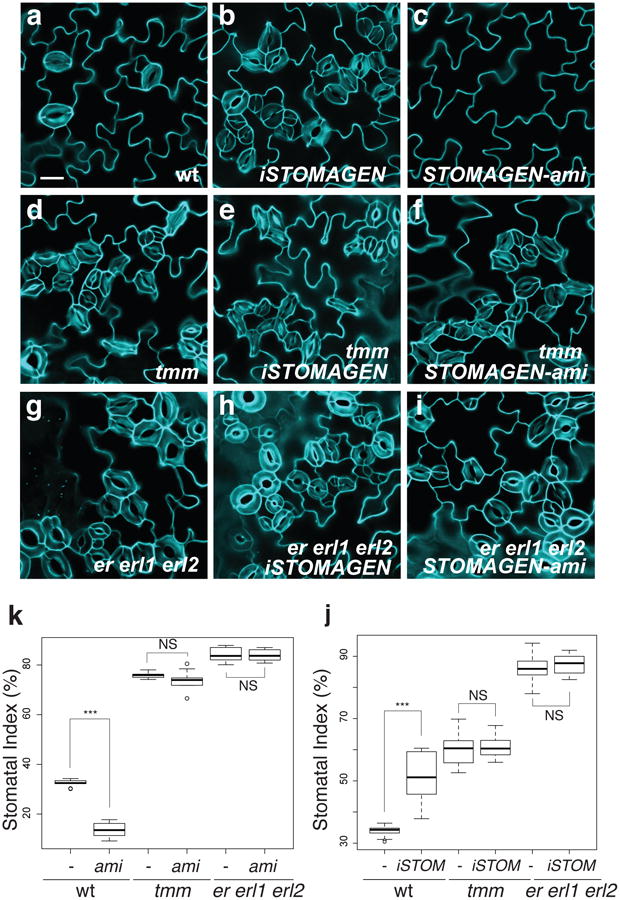
(a-i) Representative confocal images of cotyledon abaxial epidermis from 10-day-old light grown seedlings of wild type (a-c), tmm (d-f), and er erl1 erl2 (g-i), with induced Stomagen overexpression (iSTOMAGEN,)(b, e, h) or STOMAGEN-ami construct (c, f, i). Uninduced controls show no effects (see Extended Data Figs. 2-4). Images were taken under the same magnification. Scale bar = 30 μm. n=13 (a); n=18 (b); n=26 (c); n=16 (d); n=24 (e); n=26 (f); n=16 (g); n=24 (h); n=12 (i). (j) Stomatal index. -, control; ami, Stomagen-ami. *** p<0.005 (Wilcoxon rank sum test). NS=Not significant (p= 0.653 for tmm; p=0.539 for er erl1 erl2). n=8 for each genotype. (k) Stomatal Index. -, uninduced; iSTOM, induced. *** p<0.005 (Wilcoxon rank sum test). NS=Not significant (p= 0.114 for tmm; p=0.688 for er erl1 erl2). No induction, n=16; iSTOM, n=14; tmm no induction, tmm iSTOM, er erl1 erl2, er erl1 erl2 iSTOM, n=15 for each genotype. For the total numbers of stomata counted, see legends for Extended Data Figs. 3 and 4.
As reported, STOMAGEN-ami lines dramatically reduced stomatal development in wild-type cotyledons (Fig. 1a, c, k, Extended Data Fig. 4)13. In contrast, STOMAGEN-ami had no effect on SD, SI, and stomatal clustering phenotype of er erl1 erl2 cotyledons, just like in tmm (Fig. 1, Extended Data Fig. 4). Thus, ER-family RKs are required for Stomagen's hypermorphic and hypomorphic effects. The epistasis of er erl1 erl2 stomatal cluster phenotype over STOMAGEN-ami's phenotype places ER-family downstream of STOMAGEN, consistent with the molecular identity of their gene products as receptor kinases and a secreted peptide.
Genetic dissection of Stomagen action
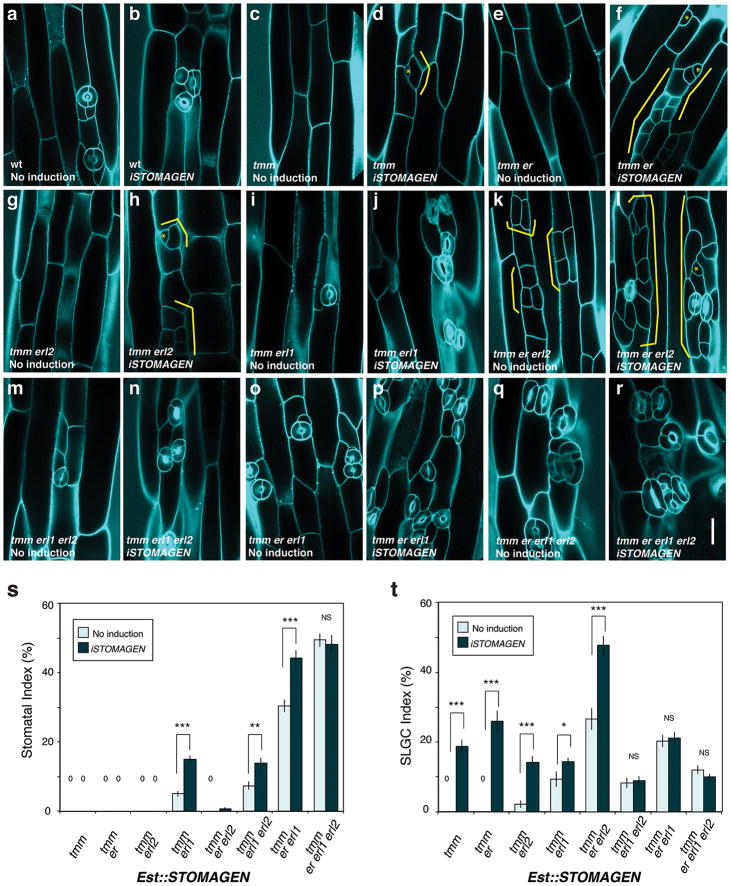
To dissect the role of Stomagen on the TMM/ER module, we comprehensively investigated the effects of iSTOMAGEN on stomatal differentiation in tmm hypocotyls with additional er-family mutations (Fig. 2, Extended Data Fig. 5). In hypocotyls, TMM and ER-family have opposite functions: tmm hypocotyls lack stomata18, whereas er erl1 erl2 hypocotyls produce stomatal clusters19. While tmm is epistatic to er-single mutation in hypocotyls, consecutive loss of ER-family genes revert stomatal development in a dosage-dependent manner, with er erl1 erl2 being epistatic to tmm7. iSTOMAGEN does not confer stomatal differentiation in tmm hypocotyls13. However, in some instances arrested stomatal precursor cells (stomatal-lineage ground cells: SLGCs) were observed, indicating that, in the absence of TMM, iSTOMAGEN could initiate stomatal development in hypocotyls (Fig. 2a, b, Extended Data Fig. 5c, d). Additional er-family mutations exaggerated this effect: iSTOMAGEN in tmm er and tmm erl2 hypocotyls, both of which lack stomata, resulted in SLGC clusters (Fig. 2c, d, Extended Fig. 5e-h). iSTOMAGEN triggered stomatal cluster formation in tmm erl1, tmm erl1 erl2, and tmm er erl1 hypocotyls, while intensifying stomatal entry divisions in tmm er erl2 hypocotyls (Fig. 2e, f, Extended Data Fig. 5i-p). Different effects of iSTOMAGEN on the higher-order mutants lacking ER (e.g. tmm er and tmm er erl2) from those lacking ERL1 (e.g. tmm erl1 and tmm erl1 erl2) reflect the overlapping yet unique roles of ER and ERL1 in stomatal development6. Finally, iSTOMAGEN failed to enhance the severe stomatal clustering phenotype in tmm er erl1 erl2 (Fig. 2g, h, Extended Data Fig. 5q, r). Quantitative analysis of SI and SLGC-Index (SLGCI: percentage of SLGCs in total epidermal cells) support these findings (Extended Data Fig. 5s, t). Together, the results suggest that in the hypocotyls, where TMM and ER-family act antagonistically, Stomagen primarily acts via three ER-family RKs.
Fig. 2. STOMAGEN overexpression on stomatal development in tmm hypocotyl epidermis with combinatorial loss-of-function in ER-family genes.
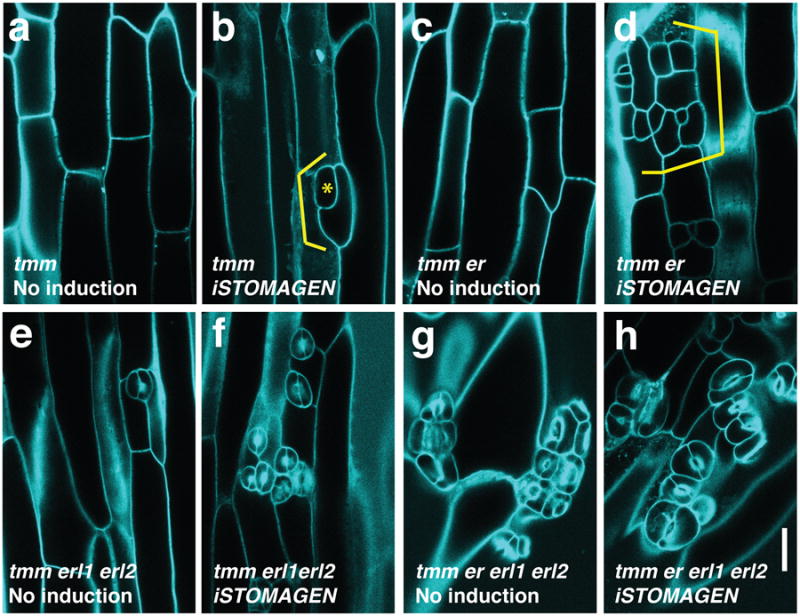
(a-h) Representative confocal microscopy images of hypocotyl epidermis from 10-day-old light-grown transgenic Est∷STOMAGEN seedlings of tmm (a, b); tmm er (c, d); tmm erl1 erl2 (e, f); and tmm er erl1 erl2 (g, h). A control, uninduced phenotype (a, c, e, g); iSTOMAGEN (b, d, f, h). iSTOMAGEN results in arrested stomatal precursor cells (asterisk) and stomatal-lineage ground cells (SLGCs: bracket) in tmm hypocotyls (b). Additional er mutation exaggerated this effect (d), while additional erl1 erl2 mutations increased stomata (f). Images were taken under the same magnification. Scale bar = 30 μm. n=20 (a); n=20 (b); n=19 (c); n=22 (d); n=17 (e); n=20 (f); n=20 (g), n=20 (h). For a complete set of higher-order mutant phenotypes and quantitative data, see Extended Data Fig. 5.
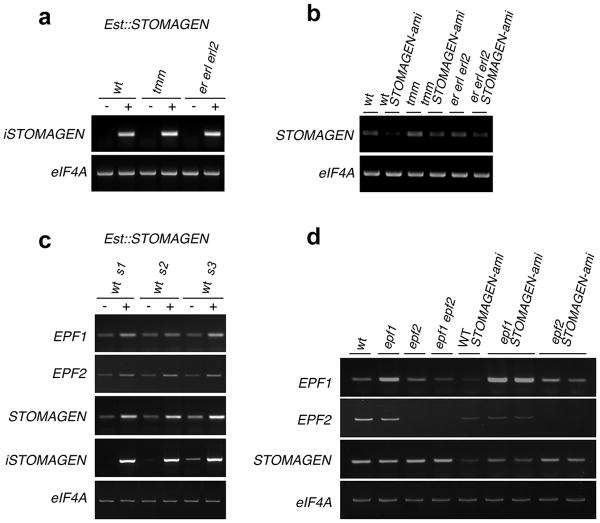
Among the ER-family, ER primarily perceives EPF2 to restrict initiation of stomatal cell lineages, while ERL1 primarily perceives EPF1 to orient stomatal spacing and prevent guard cell differentiation6. As such, epf2 increases SLGCs, whereas epf1 violates stomatal spacing3-5. Neither epf2 nor epf1 confers severe stomatal clustering phenotype like iSTOMAGEN, since only a subset of ER-family-mediated pathways has been compromised6. We delineated the role of Stomagen in each of these steps. First, we examined if EPF1, EPF2, and STOMAGEN transcripts are under feedback regulation, which may complicate the genetic analyses. EPF1 and EPF2 transcript levels were slightly upregulated by iSTOMAGEN, and conversely, slightly downregulated by STOMAGEN-ami (Extended Data Fig. 2c, d). On the other hand, the endogenous STOMAGEN transcript levels are unaffected by epf1, epf2, or epf1 epf2 (Extended Data Fig. 2d). Thus altered expression of EPF1 and EPF2 by STOMAGEN misregulation most likely reflects the numbers of stomatal-lineage cells13,14.
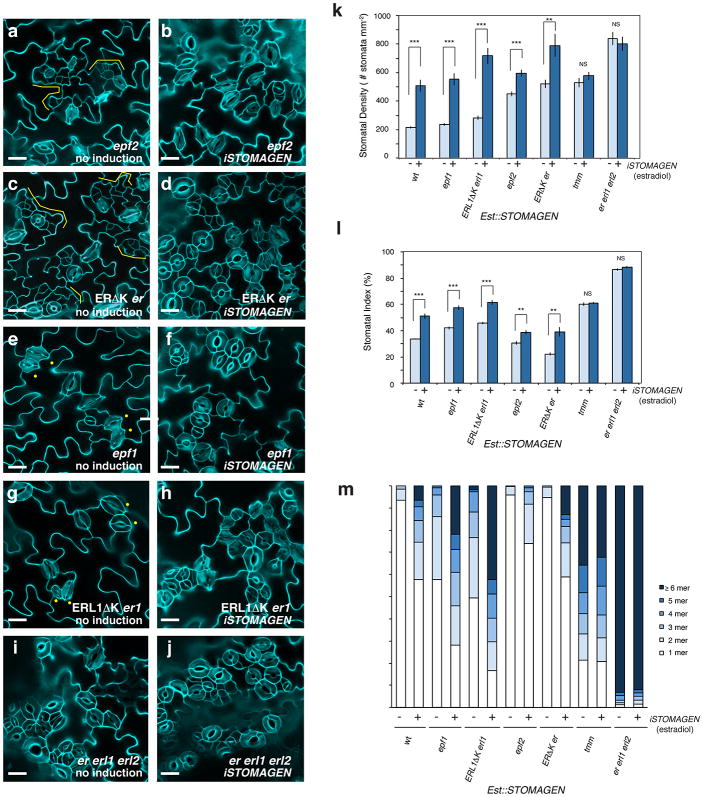
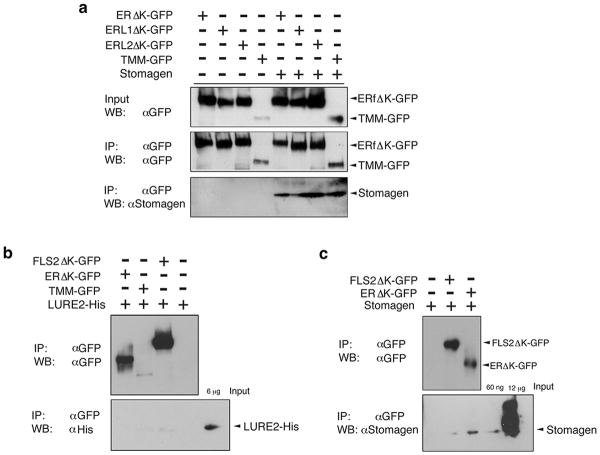
iSTOMAGEN compromised in EPF2-ER or EPF1-ERL1 signaling pathways all resulted in severe stomatal clusters, indicating that excessive Stomagen promotes stomatal differentiation when either pathway is compromised (Extended Data Fig. 3). These genetic data support the notion that Stomagen, when ectopically overexpressed, can bind to all ER-family RKs and inhibit signal transduction. Indeed, co-immunoprecipitation (Co-IP) experiments using Nicotiana benthamiana microsomal fraction expressing GFP-fused ectodomains of ER, ERL1, ERL2 or TMM incubated with synthetic Stomagen peptides demonstrated that Stomagen associates with all ER-family RKs and TMM (Extended Data Fig. 6a).
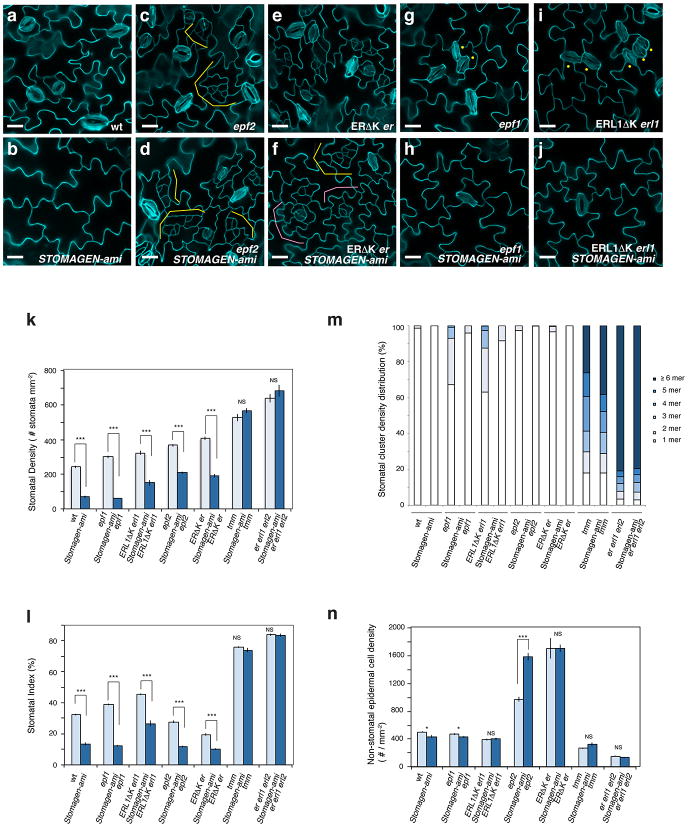
Unlike overexpression, Stomagen co-suppression imposed different effects on EPF2-ER and EPF1-ERL1 signaling pathways. STOMAGEN-ami suppressed the stomatal-pairing phenotype of epf1 and ERL1ΔK erl1 (Extended Data Fig. 4g-j, m). In contrast, STOMAGEN-ami exhibited complex interactions with epf2 and ERΔK er, reducing numbers of stomata but not that of SLGCs (Extended Data Fig. 4c-f, k-n). This supports the idea that Stomagen counteracts EPF2 for ER-mediated stomatal initiation13,14,16. This also suggests that, in the absence of both EPF2 and STOMAGEN, the default ER-pathway is not activated while the later ERL-mediated pathway remains capable of repressing the differentiation of mature stomata.
Competitive Binding of EPF2 and Stomagen
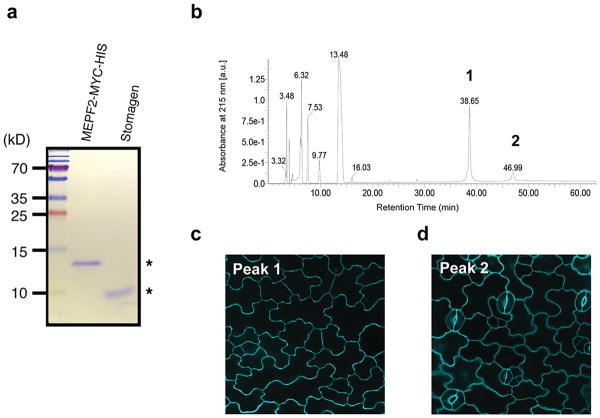
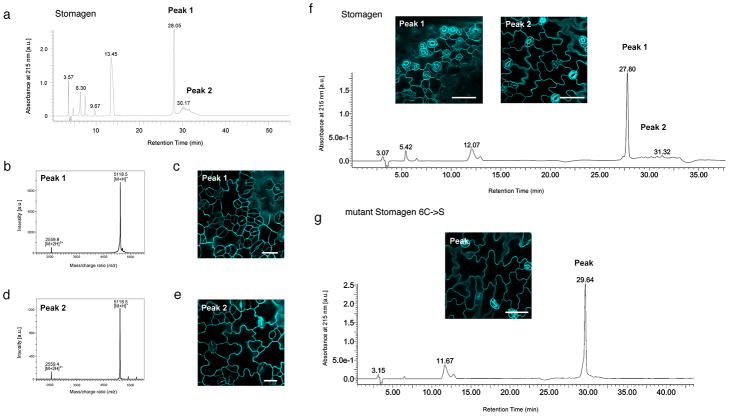
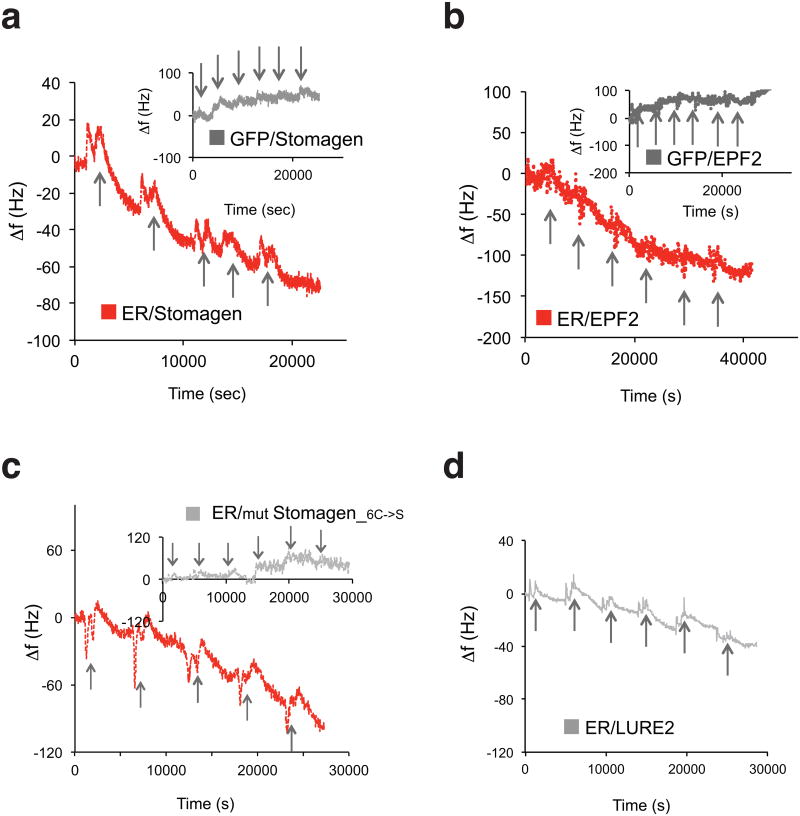
A series of genetic analyses leads to an intriguing possibility that Stomagen antagonizes EPF2's action via direct binding to ER. To address this, we produced bioactive Stomagen and predicted mature EPF2 (MEPF2) peptides (Extended Data Figs. 7, 8). Subsequently their direct binding to ER as well as to TMM was tested using previously-established quartz crystal microbalance (QCM) biosensor platforms (Extended Data Fig. 9)6. Briefly, we immobilized purified GFP-fused receptors or control GFP from N. benthamiana onto gold surfaces of QCM chips via anti-GFP antibody and then introduced the bioactive Stomagen or MEPF2 peptide solutions. The peptide-receptor binding was recorded as a function of frequency change (see Supplemental Methods)6. Both Stomagen and MEPF2 exhibited saturable binding to the ER ectodomain fused to GFP (ERΔK-GFP) with similar dissociation constants at a nanomolar range (Fig. 3a, b, Extended Data Fig. 9). Additionally, Stomagen and MEPF2 bound to TMM with high affinity (Fig. 3a, b). No significant binding of Stomagen or MEPF2 to control GFP was detected (Fig. 3a, b, Extended Data Fig. 9). To address the specificity of peptide-receptor interactions, two control peptides were subjected to the QCM analysis using ERΔK-GFP-functionalized chips: non-folding, inactive mutant Stomagen, in which six cysteines were substituted with serines (Extended Data Fig. 8g)16; and LURE2, an unrelated cysteine-rich peptide, which acts as a pollen-tube attractant20. Neither mutant Stomagen nor LURE2 exhibited binding above the background levels (Fig. 3c). Consistently, LURE2 did not associate with ER, TMM, or an innate immunity receptor FLS221,22 fused with GFP expressed in N. benthamiana in Co-IP assays (Extended Data 6b). Likewise, FLS2 failed to immunoprecipitate Stomagen above background level (Extended Data Fig. 6c). Together, the results emphasize the specificity of Stomagen-ERECTA/TMM interactions.
Fig. 3. Direct and competitive binding of Stomagen and EPF2 peptides to ER.
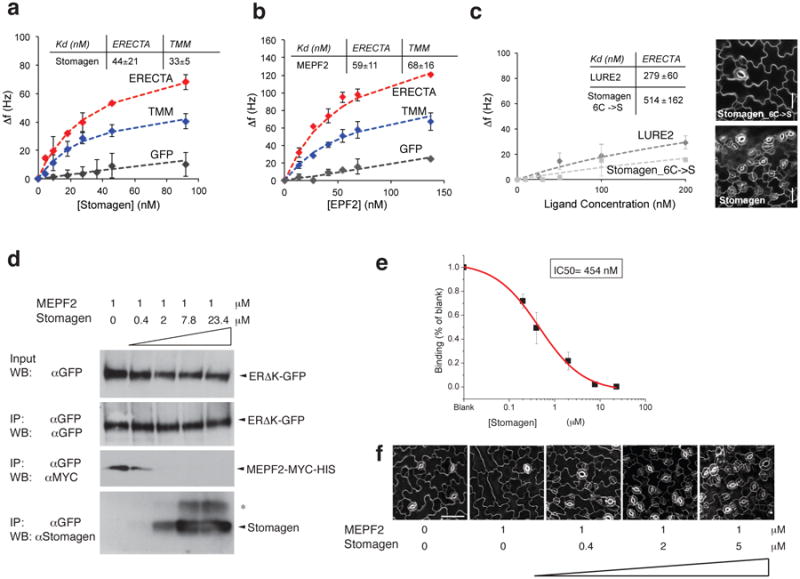
(a-c) QCM analysis for direct binding. (a, b) The averages of experimental frequency shift values recorded from two to four independent experiments for Stomagen (a) or MEPF2 (b) onto biosensor chips functionalized with ERΔK-GFP (red), TMM-GFP (blue), and GFP alone (gray) and fitted to the Langmuir adsorption model using least square regression. Error bars, SD. Stomagen/ER, n=4; Stomagen/TMM, n=2; Stomagen/GFP, n=3; MEPF2/ER, n=2; MEPF2/TMM, n=3; MEPF2/GFP, n=2. (c) The average experimental frequency shift values recorded for LURE2 (dark gray) and mutant Stomagen (light gray) on ERΔK-GFP. To calculate the Kd values, the ligand concentrations were increased to 1μM to obtain fitted curves. See Extended 9 for raw recording data. Stomagen_C6->S/ER, n=3; LURE2/ER: n=2. Right Insets: Wild-type cotyledon epidermis treated with 2.5 μM mutant or bioactive Stomagen. Scale bars, 30 μm. n=8 for each treatment. For (a-c), each QCM experiment (referred to as ‘n=1′) generates multi-point (10-20 point) data with average and SD values. (d) Competitive binding. Microsomal fractions expressing ERΔK-GFP were incubated with 1 μM of bioactive MEPF2 with increasing concentrations of bioactive Stomagen and subjected to IP. The MEPF2-MYC-HIS blot was re-probed with anti-Stomagen antibody. *, Most likely isomer. (e) Quantitative analysis of competition from four biological replicates. Error bars, S.E.M. The IC50 value is substantially higher than the Kd values for Stomagen-ER or Stomagen, presumably owing to the immunoblot-based quantification. (f) Wild-type cotyledon epidermis treated with MEPF2 alone or simultaneously co-treated with MEPF2 and increasing concentrations of Stomagen for five days. n=3 for each treatment. Images were taken under the same magnification. Scale bar, 50 μM.
Next, ligand competition assays between Stomagen and EPF2 were performed. Here, microsomal fractions from N. benthamiana expressing ER ectodomain (ERΔK-GFP) were incubated with bioactive epitope-tagged MEPF2 (MEPF2-MYC-HIS: 1 μM) and increasing concentrations of bioactive Stomagen peptides (0-23.4 μM) followed by immunoprecipitation of ER. Co-immunoprecipitated epitope-tagged MEPF2 was detected first. Then, the same blot was re-probed with anti-Stomagen antibody to detect co-immunoprecipitated Stomagen. Increasing concentrations of Stomagen peptide replaced MEPF2 for ER-binding (Fig. 3d). Quantitative analysis confirmed the competitive binding of Stomagen and MEPF2 to ER, with IC50 value of 454 nM (Fig. 3e). Combined, our results demonstrate that Stomagen and EPF2 peptides directly compete for binding to the same receptor, ER. Application of MEPF2 to wild-type seedlings inhibited stomatal development, while simultaneous treatments of MEPF2 with increasing concentration of Stomagen in a similar concentration range used in the competition experiments resulted in increased stomatal differentiation (Fig. 3f). The results align with a previous report16 and further emphasize the in vivo biological relevance of peptide competition.
Activation of downstream signaling
To unravel the mechanism of Stomagen as a competitive antagonist of EPF2, we examined the activation of downstream signaling, specifically, MPK3/6 phosphorylation as readout. Genetic studies suggest that EPF2-ER ligand-receptor signaling acts via a MAPK cascade9-12. However, recent report of co-expressed stomatal signaling components in N. benthamiana failed to detect MPK6 activation by EPF217, likely due to a limitation of the heterologous co-expression system for capturing fast and transient response. We therefore tested MAPK activation in vivo using Arabidopsis seedlings. Application of MEPF2 peptides to Arabidopsis wild-type seedlings rapidly elicited phosphorylation of MPK3 and MPK6 in 10 min, a characteristic signature of MAPK activation, which declined after 2 hours (Fig. 4a, b). The heat-denaturation of MEPF2 greatly diminished MAPK phosphorylation, correlating with its loss of bioactivity (Fig. 4b, c). By contrast, Stomagen peptide treatment failed to trigger MAPK phosphorylation (Fig. 4a). We conclude that EPF2 activates ER-signaling, leading to subsequent MAPK activation to inhibit stomatal development, while Stomagen prevents the signal transduction.
Fig. 4. EPF2, but not Stomagen, triggers downstream MAPK activation in Arabidopsis seedlings.
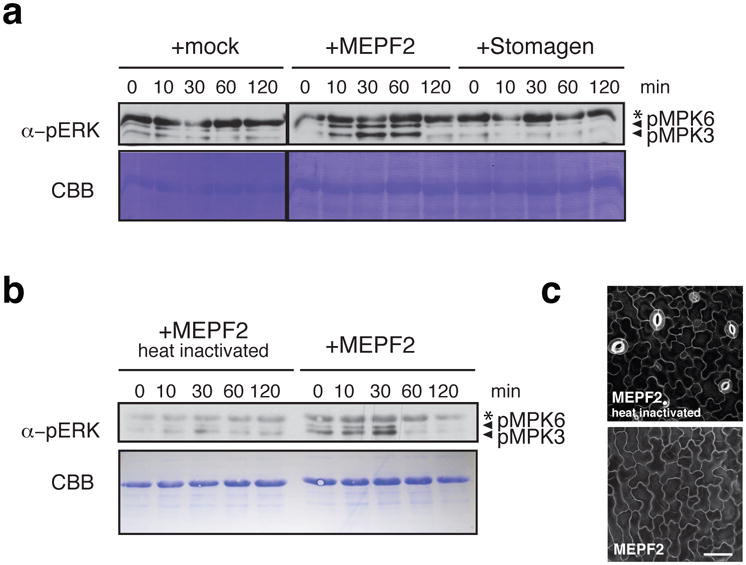
(a, b) Differential MAPK activation in Arabidopsis wild-type seedlings treated with buffer only (a, Mock), MEPF2 (a, b), Stomagen (a), and heat-denatured MEPF2 (b) for respective time intervals (min). The blots were probed with anti-phosphoERK antibody (αERK) to detect phosphorylated MPK6 (pMPK6) and pMPK3 upon peptide treatment. *non-specific band. CBB, total proteins stained. Four and two biological replicates were performed for (a) and (b), respectively. (c) Confocal microscopy of Arabidopsis wild-type cotyledon abaxial epidermis treated with heat-denatured MEPF2 (top) and control, non-denatured MEPF2 (bottom). Scale bar, 40 μm. n=3 for each treatment.
Discussion
Our work elucidates the competitive binding of Stomagen and EPF2 to ER as a molecular mechanism optimizing stomatal patterning. Plant genomes possess large numbers of peptide gene families, many with still unknown functions23. The concept of fine-tuning signal transduction by related endogenous peptides that assume opposing functions may extend to other peptide families. EPF2 is expressed in a subset of protodermal cells, while Stomagen is secreted from an underlying internal tissue4,5,13,14. Thus, it seems plausible that a protodermal cell might respond to differences in intrinsic concentrations of EPF2 and Stomagen on each neighboring side. It remains to be tested whether local concentrations of Stomagen in the apoplast reflect the IC50 values we have determined biochemically (Fig. 3e). The complex effects of STOMAGEN-OX on a series of er-family mutants in the tmm backgroud (Fig. 2) resemble that of challah (chal) higher-order mutants, which lack EPFL4/6 peptides, another set of ER ligands promoting stem growth24-26. This raises the fascinating possibility that complex fine-tuning of multiple EPF-family peptides may occur at multiple developmental contexts far beyond stomatal patterning. Quantitative visualization of each peptide in vivo during epidermal development, as well as precise documentation of the dose-response effects of simultaneous mixed peptide applications of wide concentration gradients may reveal the signaling complexity at the level of ligand-receptor association. EPF2 and Stomagen bind to ER and TMM with a similar affinity (Fig. 3), suggesting the formation of co-receptor complexes, a hallmark of receptor activation and signal transduction in plant LRR-RKs in development and innate immunity response27,28. Future structural and cell-biological studies may reveal the intricacy behind how a cell interprets conflicting signals to make decisions during developmental patterning.
Extended Data
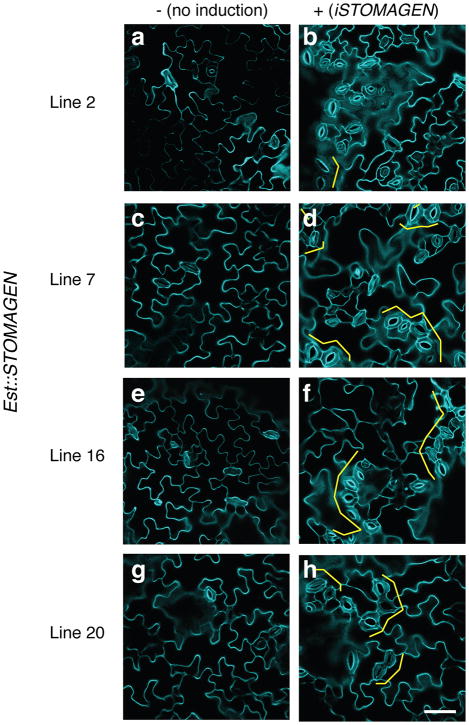
Extended Data Fig. 1. Stomatal clustering phenotype of induced STOMAGEN overexpression in multiple independent transgenic lines.
Shown are confocal microscopy images of abaxial cotyledon epidermis from 10-day-old light-grown seedlings of four independent transgenic lines carrying an estradiol-inducible STOMAGEN overexpression constructs (iSTOMAGEN). Left panels, no induction (control); Right panels, estradiol induction; Each row shows representative images from individual lines. Brackets, stomatal clusters. Images are taken under the same magnification. Scale bar, 40 μm. n=3 for each panel.
Extended Data Fig. 2. RT-PCR analysis of STOMAGEN transcripts in transgenic lines used in this study.
(a) Expression of estradiol-inducible STOMAGEN transgene (iSTOMAGEN) in transgenic lines expressing estradiol-inducible STOMAGEN overexpression (Est∷STOMAGEN) lines from wild-type (wt), tmm, and er erl1 erl2 triple mutant background with or without estradiol induction. (b) Expression of the endogenous STOMAGEN transcripts in each genotype carrying STOMAGEN-ami construct. tmm or er erl1 erl2 mutation does not seem to affect STOMAGEN transcript levels. (c) Expression of EPF1, EPF2, total STOMAGEN, and STOMAGEN transgene (iSTOMAGEN) transcripts in transgenic Est∷STOMAGEN lines (in 2 different T1 populations [s1 and s2] and a representative T3 line [s3]) with or without estradiol induction. iSTOMAGEN-OX causes modest increase in EPF1 and EPF2 transcripts, which accords with increased stomatal differentiation by iSTOMAGEN. (d) EPF1, EPF2, and STOMAGEN transcript accumulation in wild-type (wt) and single- and higher-order loss-of-function mutants of epf1, epf2, and stomagen (STOMAGEN-ami). For epf1 STOMAGEN-ami and epf2 STOMAGEN-ami lines, two different F3 populations derived from the same genetic crosses were used to test the reproducibility. STOMAGEN expression is not influenced by epf1 and epf2 mutations, consistent with the proto-mesophyll expression of STOMAGEN. On the other hand, EPF2 expression is reduced by STOMAGEN-ami, consistent with reduced stomatal cell lineages by STOMAGEN cosuppression. As reported, epf1 has a T-DNA insertion within the 5′UTR12, which results in accumulation of aberrant transcripts. For all experiments, elF4A was used as a control. For primer sequences see Extended Data Table 1.
Extended Data Fig. 3. STOMAGEN overexpression promotes stomatal differentiation in genetic backgrounds missing/blocking EPF2-ER and EPF1-ERL1 signaling components.
(a-j) Representative confocal images of cotyledon abaxial epidermis from 10-day-old light-grown transgenic seedlings of the following genotypes, each carrying Est∷STOMAGEN construct: epf2 (a, b); Dominant-negative ER (ERΔK) in er (c, d); epf1 (e, f); Dominant-negative ERL1 (ERLΔK) in erl1 (g, h); er erl1 erl2 (i, j). For each genotype, a control uninduced phenotypes (a, c, e, g, i) and induced STOMAGEN overexpression (iSTOMAGEN) (b, d, f, h, j) are shown. Blocking ER or lacking EPF2 produces small stomatal-lineage cells due to excessive entry divisions (a and c; brackets). iSTOMAGEN confers stomatal clusters and small stomatal-lineage cells are no longer present (b and d). Blocking ERL1 or lacking EPF1 causes a stomatal pairing due to a violation of one-cell-spacing rule (e and g; dots). iSTOMAGEN enhances stomatal cluster phenotype in these genotypes (f and h). iSTOMAGEN does not enhance stomatal clustering defects in er erl1 erl2 (i and j). Images were taken under the same magnification. Scale bars = 30 μm. n=29 (a); n=24 (b); n=16 (c); n=17 (d); n=22 (e); n=23 (f); n=17 (g); n=20 (h); n=24 (i); n=24 (j). (k-m) Stomatal Density (SD: number of stomata per mm2) (k); Stomatal Index (SI: % of number of stomata per stomata+ non-stomatal epidermal cells) (l); and Stomatal Cluster Distribution (in %)(m) from 10-day-old abaxial cotyledons of transgenic lines of each genotype carrying Est∷STOMAGEN construct. -, no induction; +, induced by 10 μM estradiol. Stomagen overexpression significantly increases SD in all genotypes except for er erl1 erl2 and tmm. Error bars, S.E.M. ***, p< 0.001; **, p<0.01; NS, not significant; Welch 2-sample T test. Number of seedlings subjected to analysis, n=14-16. Total numbers of stomata counted: wt, no induction, 1277, induction, 2639; epf1 no induction, 1390, induction 3485; ERL1ΔK erl1, no induction 1573, induction, 3991; epf2, no induction, 2502, induction, 3317; ERΔKer, no induction, 2899, induction, 4397; tmm, no induction, 2948, induction, 3212; er erl1 erl2, no induction, 4454, induction, 4464. All genotypes carry Est∷STOMAGEN. wt, no induction, n=16, induction, n=14; epf1 no induction, n=16, induction n=17; ERL1ΔK erl1, no induction n=15, induction, n=15; epf2, no induction, n=15, induction, n=15; ERΔK er, no induction, n=15, induction, n=15; tmm, no induction, n=15, induction, n=15; er erl1 erl2, no induction, n=15, induction, n=15.
Extended Data Fig. 4. STOMAGEN co-suppression results in reduced stomatal development in genetic backgrounds missing or blocked in EPF2-ER and EPF1-ERL1 signaling pathways.
(a-j) Representative confocal images of cotyledon abaxial epidermis from 10-day-old light-grown transgenic seedlings of the following genotypes, wild type (a); STOMAGEN-ami (b); epf2 (c); epf2 STOMAGEN-ami (d); Dominant-negative ER (ERΔK) in er (e); ERΔK er STOMAGEN-ami (f); epf1 (g); epf1 STOMAGEN-ami (h); Dominant-negative ERL1 (ERLΔK) in erl1 (i); ERLΔK erl1 STOMAGEN-ami (j). STOMAGEN-ami dramatically reduces stomatal differentiation in wild type (a, b). Blocking ER or lacking EPF2 produces small stomatal-lineage cells due to excessive entry divisions (c and e; yellow brackets). STOMAGEN-ami rather exaggerates the small stomatal-lineage cells of epf2 (d; yellow brackets). STOMAGEN-ami ERΔK er shows excessive asymmetric entry as well as amplifying divisions (f; yellow and pink brackets, respectively). Blocking ERL1 or lacking EPF1 causes a stomatal pairing due to a violation of one-cell-spacing rule (g and i; dots). STOMAGEN-ami suppresses these mild stomatal pairing phenotypes and reduces stomatal differentiation (h, j). Images were taken under the same magnification. Scale bars = 30 μm. n=13 (a); n=26 (b); n=15 (c); n=23 (d); n=11 (e); n=17 (f); n=12 (g); n=22 (h); n=18 (i); n=13 (j).(k-n) Stomatal Density (k) Stomatal Index (l), Stomatal Cluster Distribution (in %: m), and non-stomatal epidermal cell density (n) from 10-day-old abaxial cotyledons of each genotype with or without carrying STOMAGEN-ami construct. Error bars, S.E.M. ***, p< 0.001; *, p≤0.05, NS, not significant; Welch 2-sample T test. n=9-16. Total numbers of stomata counted: wt, 719; STOMAGEN-ami, 204; epf1, 1004, epf1 STOMAGEN-ami, 383; ERL1ΔK erl1, 1558; ERL1ΔK erl1 STOMAGEN-ami, 504; epf2, 1505; epf2 STOMAGEN-ami, 1165; ERΔK er, 1361; ERΔK er STOMAGEN-ami, 782; tmm, 2495; tmm STOMAGEN-ami, 2688; er erl1 erl2, 1853; er erl1 erl2 STOMAGEN-ami, 2028. Total numbers of non-stomatal epidermal cells counted: wt, 1494; STOMAGEN-ami, 1299; epf1, 1584, epf1 STOMAGEN-ami, 2711; ERL1ΔK erl1, 871; ERL1ΔK erl1 STOMAGEN-ami, 1348; epf2, 3980; epf2 STOMAGEN-ami, 8808; ERΔK er, 5739; ERΔK er STOMAGEN-ami, 6939; tmm, 790; tmm STOMAGEN-ami, 962; er erl1 erl2, 479; er erl1 erl2 STOMAGEN-ami, 391. wt, n=8; STOMAGEN-ami, n=8; epf1, n=9, epf1 STOMAGEN-ami, n=17; ERL1ΔK erl1, n=13; ERL1ΔK erl1 STOMAGEN-ami, n=9; epf2, n=11; epf2 STOMAGEN-ami, n=15; ERΔK er, n=9; ERΔK er STOMAGEN-ami, n=11; tmm, n=8; tmm STOMAGEN-ami, n=8; er erl1 erl2, n=8; er erl1 erl2 STOMAGEN-ami, n=8.
Extended Data Fig. 5. STOMAGEN overexpression on stomatal development in tmm hypocotyl epidermis with combinatorial loss-of-function in ER-family genes: A complete set.
(a-r) Representative confocal microscopy images of hypocotyl epidermis from 10-day-old light-grown transgenic seedlings of the following genotypes, each carrying Est∷STOMAGEN: wild-type (wt) (a, b); tmm (c, d); tmm er (e, f); tmm erl2 (g, h); tmm erl1 (i, j); tmm er erl2 (k, l); tmm erl1 erl2 (m, n); tmm er erl1 (o, p); and tmm er erl1 erl2 (q, r). A control, uninduced phenotype (a, c, e, g, i, k, m, o, q); iSTOMAGEN (b, d, f, h, j, l, n, p, r). iSTOMAGEN results in arrested stomatal precursor cells (asterisk) and stomatal-lineage ground cells (SLGCs: bracket) in tmm hypocotyls (d). iSTOMAGEN triggers entry divisions in tmm er and tmm erl2 (f, h: bracket), and exaggerate the SLGC clusters in tmm er erl2 (k and l: brackets). Images were taken under the same magnification. Scale bar = 30 μm. n=19 (a); n=19 (b); n=20 (c); n=20 (d); n=19 (e); n=22 (f); n=20 (g); n=17 (h); n=18 (i); n=19 (j); n=19 (k), n=21 (l); n=17 (m); n=20 (n); n=19 (o); n=21 (p); n=20 (q); n=20 (r). (s, t) Stomatal Index (SI) and SLGC Index (SLGCI). (s). *** p<0.0001, ** p<0.01, * p<0.5 (Wilcoxon rank sum test). NS=Not significant. 0=No stomata or SLGC observed; n=15. Total number of stomata and SLGCs counted; tmm non-induced, 0 and 0; induced, 0 and 211; tmm er non-induced, 0 and 0; induced, 0 and 308; tmm erl2 non-induced, 0 and 32; induced, 0 and 171; tmm erl1 non-induced, 58 and 116; induced, 142 and 138;tmm er erl2 non-induced, 0 and 270; induced, 10 and 676; tmm er erl1 non-induced, 422 and 283; induced, 817 and 422; tmm erl1 erl2 non-induced, 72 and 83; induced, 163 and 97; tmm er erl1 erl2 non-induced, 1229 and 295; induced, 1068 and 222. n=15 for all genotypes (s, t).
Extended Data Fig. 6. Association of Stomagen with ER-family receptors and TMM.
Shown are Co-IP assays of ligand-receptor pairs expressed in N. benthamiana leaves. The ectodomains and membrane-spanning domains of ER, ERL1, and ERL2 fused with GFP were separately expressed in N. benthamiana, and microsomal fractions were incubated with 1 μM Stomagen peptides followed by immunoprecipitation using anti-GFP (αGFP) antibody. Inputs and immunoprecipitates were immunoblotted using anti-GFP (αGFP) or anti-Stomagen (αStomagen) antibodies. Experiments were repeated three times (3 biological replicates). (b) Co-IP of LURE2 peptide fused with hexa-histidine tag (LURE2-His) with N. benthamiana microsomal fractions expressing the ectodomains and membrane-spanning domains of ER and FLS2 fused with GFP, a full-length TMM fused with GFP, or a control, uninoculated leaf sample. Immunopreciptation was performed using αGFP and immunoblotted using αGFP (for detection of receptors) or αHis (for detection of LURE2-His) antibodies. Experiments were repeated twice (two biological replicates). (c) Co-IP of Stomagen peptide with N. benthamiana microsomal fractions expressing the ectodomains and manbrane-spanning domains of ER and FLS2 fused with GFP or a control, uninoculated leaf sample. Immunopreciptation was performed using αGFP and immunoblotted using αGFP (for detection of receptors) or αStomagen antibodies. Experiments were repeated four times (four biological replicates).
Extended Data Fig. 7. Purified MEPF2 and Stomagen recombinant peptides and separation of bioactive MEPF2 by reverse-phase chromatography.
(a) SDS-PAGE gel of purified and refolded MEPF2-MYC-HIS and Stomagen recombinant peptides (asterisks). Left: Molecular mass markers. (b) HPLC chromatogram of purified, refolded MEPF2. Peaks 1 and 2 in UV chromatogram were collected and subjected to bioassays. (c) Confocal image of cotyledon epidermis from wild-type seedling grown a solution with Peak 1 for five days. No stoma is visible indicating the peak 1 contains bioactive MEPF2. Scale bar, 20 μm. n=19.(d) Confocal image of cotyledon epidermis from wild-type seedling grown in a solution with Peak 2 for five days, with normal stomatal differentiation, indicating that the peptide is not bioactive. Scale bar, 20 μm. n=9.
Extended Data Fig. 8. Separation of properly-folded, bioactive Stomagen and mutant Stomagen peptides by reverse-phase chromatography followed by mass-spectrometry and bioassays.
(a) HPLC chromatogram of purified, refolded Stomagen. Peaks 1 and 2 in UV chromatogram were collected and subjected to MALDI-TOF mass spectrometry (b and d) as well as for bioassays (c and e). (b) MALDI-TOF spectrum of Peak 1 from (a). A single-charged peptide corresponding to synthetic Stomagen peptide was observed at m/z = 5,118.5 ([M+H]+) and a double-charged at m/z = 2,559.8 ([M+2H]2+). (c) Confocal image of cotyledon epidermis from wild-type seedling grown a solution with Peak 1. Severe stomatal clustering and overproduction of stomata are observed. Scale bar, 20 μm. n=8. (d) MALDI-TOF spectrum of Peak 2 from (a). (e) Confocal image of cotyledon epidermis from wild-type seedling grown in a solution with Peak 2 from (a), with no stomatal clustering, indicating that the fraction is not bioactive. Scale bar, 20 μm. n=6. (f) HPLC chromatogram and bioassays of an independent batch of Stomagen peptides used for QCM analysis in direct comparison with non-folding mutant Stomagen peptides in Fig. 3c. Peaks 1 and 2 in UV chromatogram were collected and subjected for bioassays. Insets: Confocal microscopy images of cotyledon epidermis from wild-type seedling grown a solution with Peak 1 (bioactive) and Peak 2 (non-active) for five days. Scale bars, 50 μm. n=8 (Peak 1); n=6 (Peak 2). (g) HPLC chromatogram of purified, mutant Stomagen peptide in which all cysteine residues were substituted to serine residues (Stomagen_6C→S). The mutant Stomagen peptide yielded a single peak, which was subjected for bioassays followed by confocal microscopy (Inset). No stomatal clustering was observed, indicating that non-folding Stomagen peptide is not bioactive, confirming the previous results18. Scale bar, 50 μm. n=8 for each peptide treatment.
Extended Data Fig. 9. Raw QCM recording data.
Shown are raw recording data of frequency shifts for representative QCM analysis using biosensor chips immobilized with ERΔK-GFP and GFP (a, b, inset) after sequential injection of active Stomagen (a and c), MEPF2 (b), non-folding, inactive mutant Stomagen (c, inset), or LURE2 (d) in increasing concentrations. Bioactive Stomagen and inactive Stomagen experiments in (e) were performed side-by-side. Arrows: time of additional peptide application. Numbers of experiments performed for each analysis: Stomagen/ER, n=4; Stomagen/TMM, n=2; Stomagen/GFP, n=3; MEPF2/ER, n=2; MEPF2/TMM, n=3; MEPF2/GFP, n=2; Stomagen_C6->S/ER, n=3; and LURE2/ER: n=2.
Extended Data Table 1. List of Plasmids and Primers Used in This Study.
| Plasmid ID | Description | Insert | Vector | Bac R | Plant R |
|---|---|---|---|---|---|
| pKUT608 | STOMAGEN in pENTR | STOMAGEN cDNA | pENTR | KAN | NA |
| pKMP127 | proEst∷STOMAGEN in pER8 | STOMAGEN cDNA | pER8 | SPEC/STREP | HYG |
| pJSL92 | ERL2 genomic ΔKinase in pENTR | ERL2 genomic ΔKinase | pENTR | KAN | NA |
| pJSL93 | 35S∷gERL2-ΔKinase-GFP in pGWB5 | ERL2 genomic ΔKinase | pGWB5 | KAN/HYG | KAN/HYG |
| pJSL73 | FLS2ΔK in pENTR | FLS2ΔK cDNA no stop | pENTR | KAN | NA |
| pJSL75 | 35S:FLS2ΔK-GFP in pGWB5 | FLS2ΔK cDNA no stop | pGWB5 | KAN/HYG | KAN/HYG |
|
| |||||
| Primer names | Sequences (5′ to 3′) | Purpose | |||
|
| |||||
| EPFL9 1 XhoIf | CACCTCGAGATGAAGCATGAA | molecular cloning (pKUT608) | |||
| EPFL9 289 SpeI rc | ACTAGTTATCTATGACAAACAC | molecular cloning (pKUT608) | |||
| FLS2 1 (GW) F | CACCATGAAGTTACTCTCAAAGACCTTTTTG | molecular cloning (pJSL73) | |||
| FLS2 2625 rc | GATGTTGGCACTGTTGAATGAATCTGTTGC | molecular cloning (pJSL73) | |||
| FLS2 591 F | TGTAGCAGCTGGTAACCAT | Sequencing | |||
| eIF4A F | AGCCAGTGAGAATCTTGGTGAAGC | RT-PCR | |||
| eIF4A R | CTAGTACGGCAGAGCAAACACAGC | RT-PCR | |||
| STOMAGEN F | TGTAGTTCAAGCCTCAAGACCTC | RT-PCR | |||
| STOMAGEN R | ACTCGTTGTACGTACAAGTTGGT | RT-PCR | |||
| pER8 Term R | TCGAAACCGATGATACGGACG | RT-PCR | |||
| EPF1+207F | ATGCCGTCTTGTGATGGTTAG | RT-PCR | |||
| EPF1+315rc | TCAAGGGACAGGGTAGGACTT | RT-PCR | |||
| EPF2.1.cDNA.xhoI | CACCCTCGAGATGACGAAGTTTGTACGCAAGT | RT-PCR | |||
| EPF2.360.cDNA.ecoRI.rc2 | CGGAATTCTAGCTCTAGATGGCACGTGATAG | RT-PCR | |||
Supplementary Material
Acknowledgments
We thank I. Hara-Nishimura for STOMAGEN-ami lines and anti-Stomagen antibody; K. Peterson for iSTOMAGEN construct and transgenic lines; M. Kanaoka and N. Kamiya for LURE2 peptides; D. Baulcomb for p19 plasmid; C. Tamerler and M. Sarikaya for letting us use the HPLC, QCM, and MALDI-ToF equipment; A. Hofstetter for technical assistance; and J. McAbee, K. Peterson, T. Imaizumi, B. Wakimoto, S. Di Rubbo, and R. Horst for comments. K.U.T. is an HHMI-GBMF Investigator and an Endowed Distinguished Professor of Biology; J.S.L. was an NSERC Postdoctoral Fellow. Y.C.L.L. was a Mary Gates Undergraduate Research Fellow of the University of Washington.
Footnotes
Author Contributions: J.S.L. and K.U.T. conceived the project. J.S.L., M.H., M.M., J.A., and Y.C.L.L. purified peptides and performed ligand-receptor binding and bioassays. J.S.L and S.K.H. performed RT-PCR.J.S.L. and A.P. performed MAPK assays. J.S.L. and Y.C.L.L. performed quantitative analysis of stomatal phenotypes. K.U.T constructed STOMGEN cDNA plasmid. K.U.T., J.S.L., M.H., M.M., Y.C.L.L., A.P., and S.K.H. analyzed the data. K.U.T. wrote the manuscript with inputs from co-authors.
References
- 1.Dorey K, Amaya E. FGF signalling: diverse roles during early vertebrate embryogenesis. Development. 2010;137:3731–3742. doi: 10.1242/dev.037689. [DOI] [PMC free article] [PubMed] [Google Scholar]
- 2.Fukuda H, Higashiyama T. Diverse functions of plant peptides: entering a new phase. Plant & cell physiology. 2011;52:1–4. doi: 10.1093/pcp/pcq193. [DOI] [PubMed] [Google Scholar]
- 3.Hara K, Kajita R, Torii KU, Bergmann DC, Kakimoto T. The secretory peptide gene EPF1 enforces the stomatal one-cell-spacing rule. Genes & development. 2007;21:1720–1725. doi: 10.1101/gad.1550707. [DOI] [PMC free article] [PubMed] [Google Scholar]
- 4.Hara K, et al. Epidermal cell density is auto-regulated via a secretory peptide, EPIDERMAL PATTERNING FACTOR2 in Arabidopsis leaves. Plant & cell physiology. 2009;50:1019–1031. doi: 10.1093/pcp/pcp068. [DOI] [PubMed] [Google Scholar]
- 5.Hunt L, Gray JE. The signaling peptide EPF2 controls asymmetric cell divisions during stomatal development. Curr Biol. 2009;19:864–869. doi: 10.1016/j.cub.2009.03.069. [DOI] [PubMed] [Google Scholar]
- 6.Lee JS, et al. Direct interaction of ligand-receptor pairs specifying stomatal patterning. Genes & development. 2012;26:126–136. doi: 10.1101/gad.179895.111. [DOI] [PMC free article] [PubMed] [Google Scholar]
- 7.Shpak ED, McAbee JM, Pillitteri LJ, Torii KU. Stomatal patterning and differentiation by synergistic interactions of receptor kinases. Science. 2005;309:290–293. doi: 10.1126/science.1109710. [DOI] [PubMed] [Google Scholar]
- 8.Nadeau JA, Sack FD. Control of stomatal distribution on the Arabidopsis leaf surface. Science. 2002;296:1697–1700. doi: 10.1126/science.1069596. [DOI] [PubMed] [Google Scholar]
- 9.Wang H, Ngwenyama N, Liu Y, Walker J, Zhang S. Stomatal development and patterning are regulated by environmentally responsive mitogen-activated protein kinases in Arabidopsis. The Plant cell. 2007;19:63–73. doi: 10.1105/tpc.106.048298. [DOI] [PMC free article] [PubMed] [Google Scholar]
- 10.Lampard GR, Macalister CA, Bergmann DC. Arabidopsis stomatal initiation is controlled by MAPK-mediated regulation of the bHLH SPEECHLESS. Science. 2008;322:1113–1116. doi: 10.1126/science.1162263. [DOI] [PubMed] [Google Scholar]
- 11.Bemis SM, Lee JS, Shpak ED, Torii KU. Regulation of floral patterning and organ identity by Arabidopsis ERECTA-family receptor kinase genes. J Exp Bot. 2013;64:5323–5333. doi: 10.1093/jxb/ert270. [DOI] [PubMed] [Google Scholar]
- 12.Bergmann DC, Lukowitz W, Somerville CR. Stomatal development and pattern controlled by a MAPKK kinase. Science. 2004;304:1494–1497. doi: 10.1126/science.1096014. [DOI] [PubMed] [Google Scholar]
- 13.Sugano SS, et al. Stomagen positively regulates stomatal density in Arabidopsis. Nature. 2010;463:241–244. doi: 10.1038/nature08682. [DOI] [PubMed] [Google Scholar]
- 14.Kondo T, et al. Stomatal density is controlled by a mesophyll-derived signaling molecule. Plant & cell physiology. 2010;51:1–8. doi: 10.1093/pcp/pcp180. [DOI] [PubMed] [Google Scholar]
- 15.Hunt L, Bailey KJ, Gray JE. The signalling peptide EPFL9 is a positive regulator of stomatal development. New Phytol. 2010;186:609–614. doi: 10.1111/j.1469-8137.2010.03200.x. [DOI] [PubMed] [Google Scholar]
- 16.Ohki S, Takeuchi M, Mori M. The NMR structure of stomagen reveals the basis of stomatal density regulation by plant peptide hormones. Nature communications. 2011;2:512. doi: 10.1038/ncomms1520. [DOI] [PubMed] [Google Scholar]
- 17.Jewaria PK, et al. Differential effects of the peptides Stomagen, EPF1 and EPF2 on activation of MAP kinase MPK6 and the SPCH protein level. Plant & cell physiology. 2013;54:1253–1262. doi: 10.1093/pcp/pct076. [DOI] [PubMed] [Google Scholar]
- 18.Geisler M, Yang M, Sack FD. Divergent regulation of stomatal initiation and patterning in organ and suborgan regions of the Arabidopsis mutants too many mouths and four lips. Planta. 1998;205:522–530. doi: 10.1007/s004250050351. [DOI] [PubMed] [Google Scholar]
- 19.Pillitteri LJ, Bogenschutz NL, Torii KU. The bHLH protein, MUTE, controls differentiation of stomata and the hydathode pore in Arabidopsis. Plant & cell physiology. 2008;49:934–943. doi: 10.1093/pcp/pcn067. [DOI] [PubMed] [Google Scholar]
- 20.Okuda S, et al. Defensin-like polypeptide LUREs are pollen tube attractants secreted from synergid cells. Nature. 2009;458:357–361. doi: 10.1038/nature07882. [DOI] [PubMed] [Google Scholar]
- 21.Gomez-Gomez L, Boller T. FLS2: An LRR receptor-like kinase involved in the perception of the bacterial elicitor flagellin in Arabidopsis. Molecular cell. 2000;5:1155–1163. doi: 10.1016/s1097-2765(00)80265-8. [DOI] [PubMed] [Google Scholar]
- 22.Zipfel C, et al. Bacterial disease resistance in Arabidopsis through flagellin perception. Nature. 2004;428:764–767. doi: 10.1038/nature02485. [DOI] [PubMed] [Google Scholar]
- 23.Hanada K, et al. Small open reading frames associated with morphogenesis are hidden in plant genomes. Proceedings of the National Academy of Sciences of the United States of America. 2013;110:2395–2400. doi: 10.1073/pnas.1213958110. [DOI] [PMC free article] [PubMed] [Google Scholar]
- 24.Abrash EB, Bergmann DC. Regional specification of stomatal production by the putative ligand CHALLAH. Development. 2010;137:447–455. doi: 10.1242/dev.040931. [DOI] [PubMed] [Google Scholar]
- 25.Abrash EB, Davies KA, Bergmann DC. Generation of Signaling Specificity in Arabidopsis by Spatially Restricted Buffering of Ligand-Receptor Interactions. The Plant cell. 2011;23:2864–2879. doi: 10.1105/tpc.111.086637. [DOI] [PMC free article] [PubMed] [Google Scholar]
- 26.Uchida N, et al. Regulation of inflorescence architecture by intertissue layer ligand-receptor communication between. Proceedings of the National Academy of Sciences of the United States of America. 2012;109:6337–6342. doi: 10.1073/pnas.1117537109. [DOI] [PMC free article] [PubMed] [Google Scholar]
- 27.Santiago J, Henzler C, Hothorn M. Molecular mechanism for plant steroid receptor activation by somatic embryogenesis co-receptor kinases. Science. 2013;341:889–892. doi: 10.1126/science.1242468. [DOI] [PubMed] [Google Scholar]
- 28.Sun Y, et al. Structural basis for flg22-induced activation of the Arabidopsis FLS2-BAK1 immune complex. Science. 2013;342:624–628. doi: 10.1126/science.1243825. [DOI] [PubMed] [Google Scholar]
Associated Data
This section collects any data citations, data availability statements, or supplementary materials included in this article.


