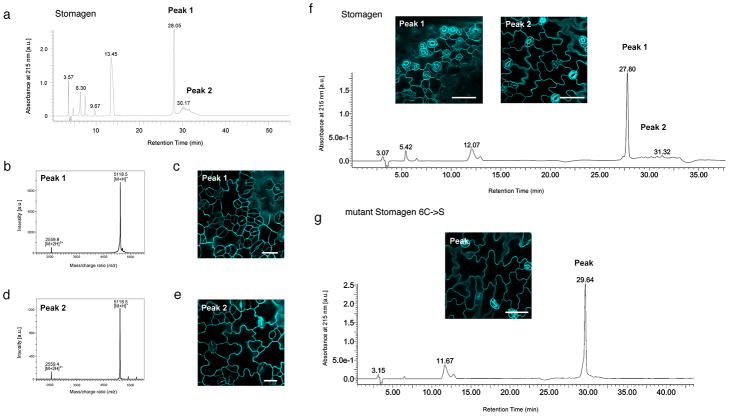
Extended Data Fig. 8. Separation of properly-folded, bioactive Stomagen and mutant Stomagen peptides by reverse-phase chromatography followed by mass-spectrometry and bioassays.
(a) HPLC chromatogram of purified, refolded Stomagen. Peaks 1 and 2 in UV chromatogram were collected and subjected to MALDI-TOF mass spectrometry (b and d) as well as for bioassays (c and e). (b) MALDI-TOF spectrum of Peak 1 from (a). A single-charged peptide corresponding to synthetic Stomagen peptide was observed at m/z = 5,118.5 ([M+H]+) and a double-charged at m/z = 2,559.8 ([M+2H]2+). (c) Confocal image of cotyledon epidermis from wild-type seedling grown a solution with Peak 1. Severe stomatal clustering and overproduction of stomata are observed. Scale bar, 20 μm. n=8. (d) MALDI-TOF spectrum of Peak 2 from (a). (e) Confocal image of cotyledon epidermis from wild-type seedling grown in a solution with Peak 2 from (a), with no stomatal clustering, indicating that the fraction is not bioactive. Scale bar, 20 μm. n=6. (f) HPLC chromatogram and bioassays of an independent batch of Stomagen peptides used for QCM analysis in direct comparison with non-folding mutant Stomagen peptides in Fig. 3c. Peaks 1 and 2 in UV chromatogram were collected and subjected for bioassays. Insets: Confocal microscopy images of cotyledon epidermis from wild-type seedling grown a solution with Peak 1 (bioactive) and Peak 2 (non-active) for five days. Scale bars, 50 μm. n=8 (Peak 1); n=6 (Peak 2). (g) HPLC chromatogram of purified, mutant Stomagen peptide in which all cysteine residues were substituted to serine residues (Stomagen_6C→S). The mutant Stomagen peptide yielded a single peak, which was subjected for bioassays followed by confocal microscopy (Inset). No stomatal clustering was observed, indicating that non-folding Stomagen peptide is not bioactive, confirming the previous results18. Scale bar, 50 μm. n=8 for each peptide treatment.

