

Abstract
The majority of the patients with type 2 diabetes (T2DM) show remission after Roux-en-Y gastric bypass (RYGB). This is the result of increased postoperative insulin sensitivity and β-cell secretion. The aim of the present study was to elucidate the importance of the preoperative β-cell function in T2DM for the chance of remission after RYGB. Fifteen patients with and 18 without T2DM had 25 g oral (OGTT) and intravenous (IVGTT) glucose tolerance tests performed at inclusion, after a diet-induced weight loss, and 4 and 18 months after RYGB. Postoperative first phase insulin secretion rate (ISR) during the IVGTT and β-cell glucose sensitivity during the OGTT increased in T2DM. Postoperative insulin sensitivity and the disposition index (DI) markedly increased in both groups. By stratifying the T2DM into two groups according to highest (T2DMhigh) and lowest (T2DMlow) baseline DI, a restoration of first phase ISR and β-cell glucose sensitivity were seen only in T2DMhigh. Remission of type 2 diabetes was 71 and 38% in T2DMhigh and T2DMlow, respectively. Postoperative postprandial GLP-1 concentrations increased markedly, but did not differ between the groups. Our findings emphasize the importance of the preoperative of β-cell function for remission of diabetes after RYGB.
Key points
Roux-en-Y gastric bypass surgery leads to remission of type 2 diabetes in the majority of patients suffering from the disease.
The gut hormone glucagon-like peptide-1 is believed to be of major importance for the remission process.
The present project demonstrates a marked difference in the chance of remission of type 2 diabetes in patients with low or high preoperative β-cell function in spite of a similar post-surgery increase in postprandial glucagon-like peptide-1 release.
Furthermore, post-surgery intravenous glucose administration, which does not stimulate release of glucagon-like peptide-1, leads to increased insulin secretion in the patients with the best preoperative β-cell function.
Together the present findings indicate that patients with type 2 diabetes with high preoperative β-cell function experience a glucagon-like peptide-1-independent increase in β-cell function after gastric bypass surgery.
Introduction
β-Cell dysfunction and insulin resistance are key features of type 2 diabetes. When pancreatic β-cells can no longer secrete the insulin required to meet the insulin demand, hyperglycaemia develops. Today Roux-en-Y gastric bypass (RYGB) is widely used as an effective treatment for both obesity and type 2 diabetes. The procedure results in loss of ∼60% of excess weight (Buchwald et al. 2009), and the majority of the patients with type 2 diabetes experience a rapid improvement in glycaemic control, often leading to long lasting remission of the disease (Sjostrom, 2013). This makes RYGB superior to the current optimal medical treatment for diabetes (Mingrone et al. 2012; Schauer et al. 2012,2014).
The remission process of type 2 diabetes following RYGB has been intensively studied in the last few years. The fasting endogenous glucose production decreases, and the suppression may be stronger after surgery (Camastra et al. 2011; Dunn et al. 2012; Jacobsen et al. 2012; Bojsen-Moller et al. 2014), and as body and fat mass decrease, insulin-mediated whole body glucose uptake increases (Campos et al. 2010; Kashyap et al. 2010; Camastra et al. 2011; Bojsen-Moller et al. 2014). In combination, these changes alone may improve glycaemic control, but in addition a major increase in postprandial glucagon-like peptide-1 (GLP-1) plasma concentration is a constant finding after RYGB (le Roux et al. 2007; Laferrere et al. 2007, 2008; Morinigo et al. 2006; Bose et al. 2010; Jorgensen et al. 2012; Salinari et al. 2013; Bojsen-Moller et al. 2014). GLP-1, along with the other incretin hormone, glucose-dependent insulinotropic polypeptide (GIP), potentiates the glucose-induced insulin secretion (known as the incretin effect), and this contributes to the improved postprandial insulin secretion and glucose disposal. In support of this notion, it has been shown that the incretin effect is increased in patients with type 2 diabetes after RYGB (Laferrere et al. 2007), and that blockade of the GLP-1 receptor abolishes the improved glucose homeostasis after surgery (Salehi et al. 2011; Jorgensen et al. 2013). Recently Salinari et al. (2013) showed that the insulin secretion rate (ISR) was increased in patients with type 2 diabetes 1 month after RYGB only when glucose was administered orally and not intravenously. Since the incretin hormones are only stimulated when glucose is ingested orally, this result further supports the role of GLP-1 in the rapid postoperative restoration of the β-cell function. However, in a recent study by Vetter et al. (2014), a similar improvement in β–cell function was seen in two groups of patients with type 2 diabetes, who had a matched diet or RYGB induced weight loss. Furthermore, the deterioration in β-cell function was similar in the two groups when exendin-9, a GLP-1 receptor antagonist, was administered (Vetter et al. 2014). Thus, factors apart from GLP-1 must also influence the postoperative restoration of the β-cell function in patients with type 2 diabetes.
The aim of the present study was to investigate β-cell function in morbidly obese patients with and without type 2 diabetes before and 4 and 18 months after RYGB. To elucidate the role of the increased postoperative GLP-1 release, the β-cell function was tested after both oral and intravenous glucose administration. Subsequently, the patients with type 2 diabetes were stratified into two subgroups with respect to their preoperative β-cell function in order to elucidate how this parameter affected their postoperative remission. We hypothesized that β-cell function in general would improve after surgery, and primarily when glucose was given orally. In addition, we hypothesized that a better β-cell function prior to surgery would predict a better postoperative recovery of the β-cells and thereby improve the chance of remission.
Methods
Thirty-three patients were recruited, 15 with type 2 diabetes (T2DM) and 18 without (OB), scheduled for a Roux-en-Y gastric bypass surgery procedure. Patient characteristics are shown in Table1. Inclusion criteria followed the Danish gastric bypass surgery guidelines (prior to January 2011): age 18–60 years, body mass index (BMI) >40 kg m−2 or BMI >35 kg m−2 with obesity-related co-morbidities (e.g. type 2 diabetes). Exclusion criteria were known cardiovascular disease, polycystic ovary syndrome, dysregulated hypertension, thyroid disease and other diseases demanding medication known to affect the test results. Remission of diabetes after RYGB was defined as glycosylated haemoglobin type A1c (HbA1c) <42.1 mmol mol−1, fasting glucose <5.7 mmol l−1 and no medication.
Table 1.
Subject characteristics in T2DM and OB
| OB | T2DM | Statistics | |||||||||
|---|---|---|---|---|---|---|---|---|---|---|---|
| A | B | C | D | A | B | C | D | Group | Time | G × T | |
| n | 18 | 18 | 18 | 13 | 14 | 13 | 15 | 12 | |||
| Sex (M/F) | 3/15 | 6/9 | |||||||||
| Age (years) | 36 ± 2 | 42 ± 1 | 0.02 | ||||||||
| Weight (kg) | 129 ± 5 | 123 ± 4† | 101 ± 4† | 90 ± 5† | 123 ± 5 | 119 ± 5† | 98 ± 4† | 90 ± 6† | 0.91 | < 0.001 | 0.18 |
| Weight loss (%) | 5 ± 1 | 22 ± 1† | 32 ± 2† | 5 ± 1 | 22 ± 1† | 29 ± 2† | 0.31 | < 0.001 | 0.42 | ||
| BMI (kg m−2) | 43 ± 1 | 41 ± 1† | 33 ± 1† | 30 ± 1† | 42 ± 1 | 41 ± 1† | 33 ± 1† | 30 ± 1† | 0.88 | < 0.001 | 0.07 |
| Fasting insulin (pmol l−1) | 96 ± 10 | 76 ± 11† | 40 ± 6† | 29 ± 3‡ | 120 ± 15 | 101 ± 9† | 47 ± 8† | 46 ± 7‡ | 0.02 | < 0.001 | 0.06 |
| Fasting C-peptide (pmol l−1) | 734 ± 47 | 647 ± 60 | 558 ± 73‡ | 365 ± 29‡ | 701 ± 47 | 721 ± 46 | 493 ± 36‡ | 449 ± 34‡ | 0.73 | < 0.001 | 0.36 |
| Fasting glucose (mmol l−1) | 5.5 ± 0.1 | 5.3 ± 0.1 | 5.1 ± 0.1‡ | 5.0 ± 0.1‡ | 7.9 ± 0.6 | 7.4 ± 0.3 | 6.4 ± 0.5‡ | 5.8 ± 0.4‡ | < 0.001 | < 0.001 | 0.06 |
| FFA (μmol l−1) | 675 ± 36 | 698 ± 37 | 649 ± 33 | 538 ± 45† | 649 ± 34 | 640 ± 41 | 577 ± 45 | 503 ± 30† | 0.21 | < 0.001 | 0.86 |
| Cholesterol (mmol l−1) | 4.2 ± 0.2 | 4.0 ± 0.1 | 3.5 ± 0.1‡ | 3.5 ± 0.2|| | 3.7 ± 0.3 | 3.6 ± 0.2 | 3.1 ± 0.2‡ | 3.6 ± 0.2|| | 0.07 | < 0.001 | 0.13 |
| Glycerol (μmol l−1) | 86 ± 4 | 84 ± 6 | 81 ± 6 | 67 ± 6† | 72 ± 6 | 65 ± 5 | 63 ± 7 | 52 ± 2† | 0.007 | 0.002 | 0.95 |
| HbA1c (mmol mol−1) | 37 ± 1* | 36 ± 1* | 35 ± 1* | 36 ± 1 | 55 ± 4 | 48 ± 3† | 42 ± 2‡ | 40 ± 3‡ | — | — | < 0.001 |
| HbA1c (%) | 5.5 ± 0.1* | 5.4 ± 0.1* | 5.3 ± 0.1* | 5.4 ± 0.1 | 7.2 ± 0.3 | 6.5 ± 0.3† | 6.0 ± 0.2‡ | 5.8 ± 0.2‡ | — | — | < 0.001 |
| Matsuda index (a.u.) | 2.2 ± 0.2 | 2.6 ± 0.3 | 3.7 ± 0.4‡ | 6.3 ± 0.4‡§ | 1.6 ± 0.2 | 1.8 ± 0.2 | 3.8 ± 0.5‡ | 4.0 ± 0.6‡ | — | — | 0.01 |
| HOMA-IR (a.u.) | 1.8 ± 0.2 | 1.4 ± 0.2† | 0.8 ± 0.1‡ | 0.6 ± 0.1‡ | 2.3 ± 0.3 | 2.0 ± 0.2† | 0.9 ± 0.1‡ | 0.9 ± 0.1‡ | 0.02 | < 0.001 | 0.07 |
| DIOGTT (a.u.) | 5.0 ± 1.7 | 4.2 ± 0.6 | 4.9 ± 0.6‡ | 6.5 ± 1.1‡ | 0.5 ± 0.1 | 0.9 ± 0.3 | 1.4 ± 0.4‡ | 2.2 ± 0.8‡ | < 0.001 | < 0.001 | 0.17 |
| DIIVGTT (a.u.) | 1.9 ± 0.3 | 2.3 ± 0.3 | 2.7 ± 0.3|| | 3.8 ± 0.3|| | 0.3 ± 0.1 | 0.6 ± 0.3 | 1.9 ± 0.5|| | 2.1 ± 0.7|| | < 0.001 | 0.004 | 0.37 |
| Diabetes (HbA1c > 42.1 mmol mol−1, fasting glucose > 5.6 mmol l−1 or medication) | 14 | 12 | 10 | 4 | |||||||
| Time since diagnosis (years) | 5.2 ± 2 | ||||||||||
| Medication (no. of patients) | |||||||||||
| Antihypertensive | 2 | 2 | 2 | 2 | 7 | 6 | 4 | 4 | |||
| Statins | 2 | 2 | 2 | 2 | |||||||
| Metformin | 7 | 7 | 1 | 1 | |||||||
| Insulin | 4 | 4 | 0 | 0 | |||||||
| GLP-1 analogue | 4 | 4 | 0 | 0 | |||||||
| DPP-4 inhibitor | 1 | 1 | 0 | 0 | |||||||
A: baseline
B: after a diet-induced weight loss
C: 4 months after RYGB
D: 18 months after RYGB. FFA: free fatty acids
HbA1c: glycosylated haemoglobin, type A1c
DIOGTT: disposition index calculated from the OGTT
DIIVGTT: disposition index calculated from the IVGTT
HOMA-IR: homeostatic model assessment of insulin resistance.
Significantly different from T2DM
significantly different from previous examinations
significantly different from preoperative values
significantly different from C
significantly different from A.
Data are means ± SEM.
Before enrollment subjects gave their informed signed consent. The study was approved by the Ethical Committee of Copenhagen (journal no. H-C-2009-050) and performed according to the Declaration of Helsinki. The present study is part of a larger project (GASMITO) investigating the metabolic and psycho-social effects of gastric bypass surgery. Results from other parts of the project have previously been published (Wimmelmann et al. 2014a,b2014).
Each patient was examined four times. The first examination was at baseline (A) and the second after a preoperative diet-induced weight loss just prior to surgery (B). Examination A and B were separated by 64 ± 8 days. Examination C was performed 4.5 ± 0.1 months and examination D 18.6 ± 0.8 months after RYGB when patients were weight stable. Each examination included an oral (OGTT) and an intravenous glucose tolerance test (IVGTT) and measurement of the body composition. Subjects were asked not to perform vigorous exercise the day before a test. GLP-1 analogues were paused 2 days before a test and any other medication (Table1) 1 day before. Seven (5 OB, 2 T2DM) subjects only performed the IVGTT protocol. A few patients did not complete all four tests due to technical difficulties in getting venous access, one patient could not complete the study due to complications after the RYGB procedure and one patient became pregnant before her last examination (Table1). Twelve OB and 10 T2DM completed all four tests. All patients completed at least one experiment prior to surgery.
Oral- and intravenous glucose tolerance test
Subjects reported to the laboratory after an overnight fast and a catheter was inserted in a cubital vein. Baseline blood samples were drawn, and 25 g glucose dissolved in 200 ml of water was ingested in 1 min. After ingestion blood samples were drawn every 30 min during the following 2 h, and plasma concentrations of metabolites, insulin, C-peptide, GLP-1 and GIP were determined. A dual-energy x-ray absorptiometry scan was performed to determine changes in fat mass, fat free mass and bone mass (GE Medical Systems, Lunar iDXA Series, Madison, WI, USA). On a separate day, subjects reported to the lab after an overnight fast and a catheter was placed in a cubital and in a dorsal vein of the hand, which was placed in a heating pad to provide arterialized blood. Baseline blood samples, including a sample for HbA1c measurement, were drawn and 25 g of glucose dissolved in 137 ml of saline (0.9%) was infused during 1 min. Blood samples were drawn frequently for 40 min, and plasma concentrations of glucose, insulin and C-peptide were determined. The OGTT and IVGTT were separated by at least 48 h.
Biochemistry
Blood samples for glucose, free fatty acids (FFA) and glycerol analyses were collected into EDTA-containing tubes during the OGTT and samples for glucose were collected into BD (Becton, Dickinson and Co., NJ, USA) sodium fluoride- and EDTA-containing tubes during the IVGTT. Blood samples for plasma cholesterol analysis were collected into heparinized tubes. Blood samples for insulin, C-peptide, GIP and GLP-1 analysis were collected into BD aprotinin-containing Vacutainers. All samples were immediately cooled to 4°C and centrifuged at 2000 g for 10 min whereafter plasma was collected and stored at –80°C until time of analysis.
Plasma glucose, FFA, glycerol and cholesterol were measured on a Hitachi Cobas 6000 chemistry analyser (Roche A/S, Hvidovre, Denmark). Insulin and C-peptide were assessed using commercial ELISA kits (insulin: Dako A/S, Glostrup, Denmark, cat. no. K6219. C-peptide: ALPCO Diagnostics, Salem, HN, USA, cat. no. 80-CPTHU-E01.1, E10). Samples were analysed on a Multiskan FC Microplate Photometer (Thermo Fisher Scientific, Slangerup, Denmark). Plasma for total GLP-1 and total GIP was extracted with 70% ethanol (vol/vol, final concentration) before measurement. GLP-1 was measured using antibody no. 89390 (Orskov et al. 1994), which is specific for the amidated C-terminus. GIP was measured using antibody 80867, which is specific for the C-terminus (Lindgren et al. 2011). Assay sensitivities were below 2 pmol l−1. Intra-assay coefficient of variation was below 6% at 20 pmol l−1, and recovery of standard, added to plasma before extraction, about 100% when corrected for losses inherent in the plasma extraction procedure. All samples were analysed in duplicate.
Calculations and statistical analysis
To investigate systematic effects of group (T2DM and OB), time (A, B, C and D) and possible interactions (group × time), a mixed model ANOVA (autoregressive correlation structure) with least squares post hoc test followed by a Tukey–Kramer adjustment was performed. Satterthwaite approximation was used in case of missing values. Data that were not normally distributed or had unequal variance were log-transformed before statistical analyses. Hormone concentrations during the OGTTs and IVGTTs were calculated as area under the curve (AUC) using the trapezoidal rule, and reported as change from baseline (incremental change). Reporting incremental AUCs allows us to compare a hormone response to glucose without the potential confounding effect of a change in the fasting hormone concentration during the study. Since the postprandial plasma GLP-1 concentration decreased during the OGTT at examination A the incremental AUC is negative. The insulin secretion rate (ISR) was calculated, using the ISEC software program (Hovorka et al. 1996) by deconvolution of C-peptide concentrations and using population-based estimates of C-peptide kinetics. The β-cell glucose sensitivity was calculated as the slope of the ISR curve vs. the prevailing plasma glucose concentration during the OGTT. The Matsuda index, calculated from OGTT data as: 10.000 × (√(fasting glucose × fasting insulin × mean glucose × mean insulin))−1, was used as an index of insulin sensitivity (Matsuda & Defronzo, 1999). The ability of the β-cells to compensate for the insulin resistance (the disposition index (DI)) was calculated as: (incremental AUC ISR0-30 × incremental AUC glucose0-30−1) / (Matsuda index−1) and (incremental AUC ISR0-10 × incremental AUC glucose0-10−1) / (Matsuda index−1) from OGTT and IVGTT data, respectively. The T2DM patients with the highest (T2DMhigh) and lowest (T2DMlow) DI calculated from the IVGTT at the first examination were stratified into two equally sized subgroups to investigate the role of the preoperative β-cell function for the outcome of RYGB. A P value <0.05 was considered significant. Statistical analysis was performed in SAS Enterprise 6.1 (SAS Institute Inc., Cary, NC, USA). Data are presented as means ± SEM.
Results
Weight, weight loss and BMI were similar in the two groups, but T2DM were ∼6 years older than OB (Table1). Fasting plasma insulin concentrations were higher and fasting C-peptide similar in T2DM compared with OB. Fasting insulin decreased after the diet-induced weight loss, and fasting insulin and C-peptide were lower after surgery compared with before in both groups (Table1). Fasting glucose concentrations were higher in T2DM compared with OB, and decreased after surgery in both groups. Likewise, HbA1c was higher in T2DM compared with OB before and 4 months after surgery, and decreased after surgery only in T2DM (Table1).
OGTT
The plasma glucose and insulin concentrations and the ISR during the OGTTs are shown in Fig.1. Plasma glucose concentrations expressed as AUC were higher in T2DM compared with OB throughout the study (T2DM: A: 1155 ± 65, B: 1142 ± 83, C: 956 ± 93 and D: 927 ± 95 vs. OB: A: 768 ± 30, B: 757 ± 30, C: 708 ± 20 and D: 661 ± 20 mmol l−1 · 120 min, P < 0.001), and lower after surgery in both groups (P < 0.003). The plasma insulin concentrations during the OGTTs were lower in T2DM compared with OB (T2DM: A: 130 ± 27, B: 105 ± 19, C: 93 ± 18 and D: 85 ± 24 vs. OB: A: 177 ± 20, B: 181 ± 19, C: 175 ± 21 and D: 92 ± 13 pmol l−1 · 120 min · 102, P = 0.02) and lower 18 months after RYGB compared with the previous examinations in both groups (P < 0.01). The ISRs were lower in T2DM compared with OB (T2DM: A: 119 ± 24, B: 118 ± 20, C: 150 ± 19 and D: 151 ± 25 vs. OB: A: 172 ± 19, B: 199 ± 18, C: 237 ± 26 and D: 190 ± 21 pmol kg−1 · 120 min, P = 0.02) and did not change in response to either diet or RYGB in OB and T2DM. The β-cell glucose sensitivity was lower in T2DM compared with OB and increased after RYGB only in T2DM (Fig.2). DIOGTT and the Matsuda index were lower and HOMA-IR higher in T2DM compared with OB, and DIOGTT and the Matsuda index increased and HOMA-IR decreased postoperatively in T2DM and OB (Table1).
Figure 1.
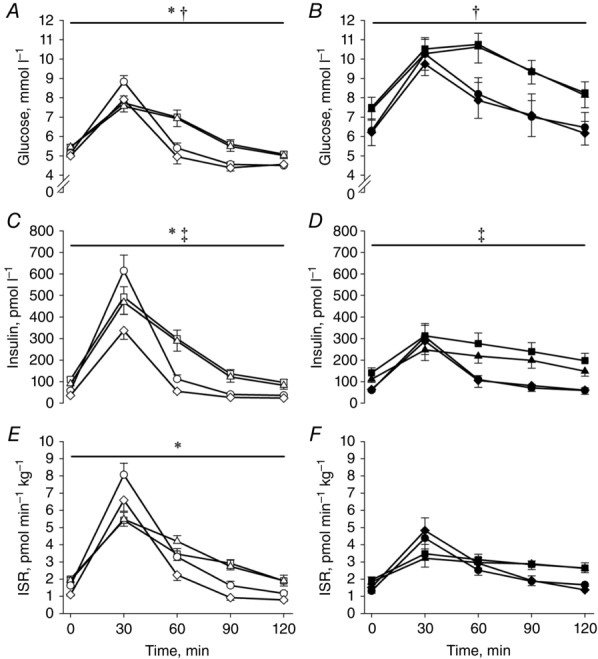
Plasma glucose (A and B) and insulin (C and D) concentrations and the ISR (E and F) during the OGTTs
Open symbols: OB; filled symbols: T2DM; squares: baseline (examination A); triangles: after a diet-induced weight loss (examination B); circles: 4 months after RYGB (examination C); diamonds: 18 months after RYGB (examination D). *Significantly different from T2DM; †significant difference between pre- and post-operative values; ‡Examination D significantly different from A, B and C. Data are means ± SEM.
Figure 2.
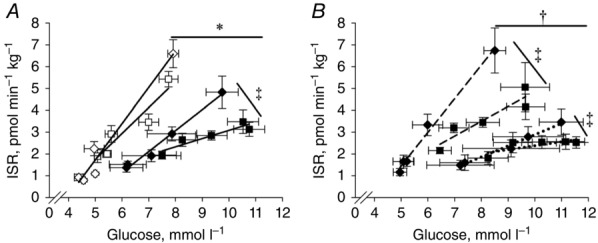
OGTT β-cell glucose sensitivity before and 18 months after RYGB
A, β-cell glucose sensitivity during the OGTTs before and 18 months after RYGB in OB and T2DM. B, β-cell glucose sensitivity during the OGTTs before and 18 months after RYGB in the T2DM with the initial highest or lowest β-cell function. The β-cell glucose sensitivity was calculated as the slope of curve obtained from all time points. Continuous lines and open symbols: OB; continuous lines and filled symbols: T2DM; squares: baseline (examination A); diamonds: 18 months after RYGB (examination D); dashed lines: T2DMhigh; dotted lines: T2DMlow. *Significantly different from T2DM; †T2DMhigh significantly different from T2DMlow; ‡significant difference from baseline to 18 months after surgery. Data are means ± SEM.
GLP-1 and GIP concentrations in plasma during the OGTTs expressed as AUC are shown in Fig.3. GLP-1 responses (T2DM: A: –131 ± 83, B: 195 ± 91, C: 933 ± 180 and D: 1219 ± 354 vs. OB: A: –160 ± 130, B: –91 ± 155, C: 1293 ± 270 and D: 1322 ± 327 pmol l−1 · 120 min) did not differ between T2DM and OB and markedly increased after surgery in both groups (P < 0.001). The plasma GIP concentrations (T2DM: A: 1036 ± 203, B: 1765 ± 211, C: 1107 ± 251 and D: 1123 ± 317 vs. OB: A: 973 ± 416, B: 1455 ± 135, C: 1471 ± 186 and D: 1026 ± 228 pmol l−1 · 120 min) were similar in the two groups and did not change after surgery.
Figure 3.
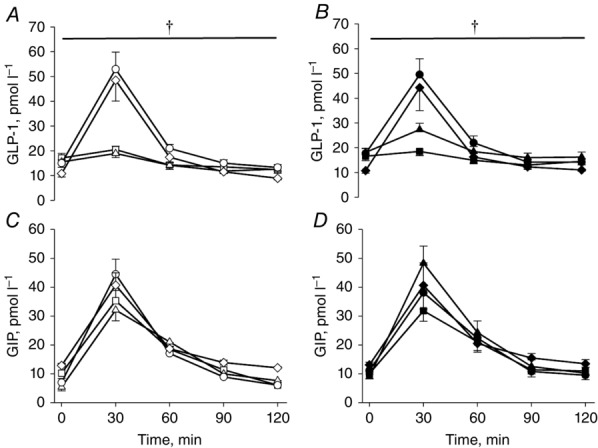
Plasma GLP-1 (A and B) and GIP (C and D) concentrations during the OGTTs
Open symbols: OB; filled symbols: T2DM; squares: baseline (examination A); triangles: after a diet-induced weight loss (examination B); circles: 4 months after RYGB (examination C); diamonds: 18 months after RYGB (examination D). †Significant difference between pre- and post-operative values. Data are means ± SEM.
IVGTT
The plasma concentrations of glucose and insulin and the ISR during the IVGTTs are shown in Fig.4. The glucose concentrations were higher in T2DM compared with OB (T2DM: A: 528 ± 24, B: 510 ± 18, C: 483 ± 19 and D: 485 ± 20 vs. OB: A: 430 ± 11, B: 438 ± 12, C: 450 ± 11 and D: 452 ± 10 mmol l−1 · 40 min, P < 0.001), and did not change during the study in either group. The insulin concentrations were lower in T2DM compared with OB (T2DM: A: 56 ± 10, B: 58 ± 12, C: 37 ± 6 and D: 37 ± 7 vs. OB: A: 103 ± 14, B: 97 ± 13, C: 61 ± 11 and D: 40 ± 6 pmol l−1 · 40 min Here it should be 10 uplifted squared as for the OGTT result (Q9), P < 0.007), and decreased in both groups after RYGB (P < 0.001). The ISRs were lower in T2DM compared with OB (T2DM: A: 77 ± 12, B: 87 ± 10, C: 91 ± 14 and D: 98 ± 16 vs. OB: A: 141 ± 13, B: 158 ± 17, C: 148 ± 18 and D: 113 ± 11 mmol l−1 · 40 min) before and 4 months after RYGB (P < 0.04), but did not differ between groups 18 months after surgery. The ISR did not change in OB and tended to increase in T2DM 18 months after RYGB compared with baseline (P = 0.06). The DIIVGTT was lower in T2DM than OB and increased after RYGB in both groups compared with baseline (Table1).
Figure 4.
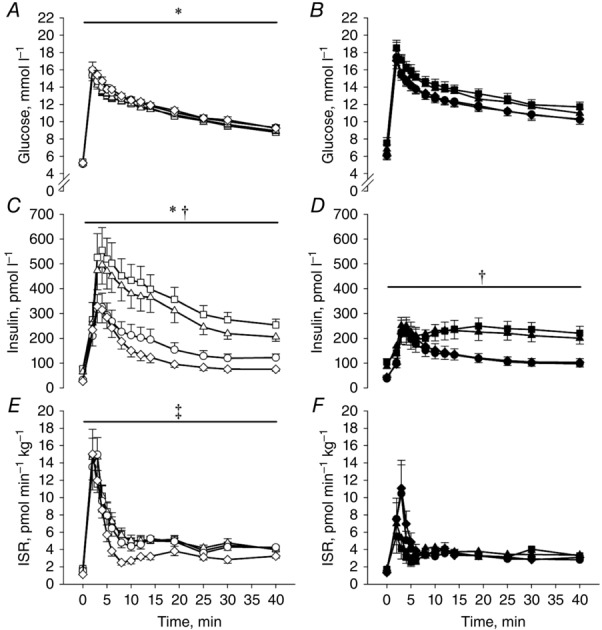
Glucose (A and B) and insulin (C and D) concentrations and the ISR (E and F) during the IVGTTs
Samples were drawn prior to glucose infusion and 2, 3, 4, 5, 6, 8, 10, 14, 19, 25, 30 and 40 min after. Open symbols: OB; filled symbols: T2DM; squares: baseline (examination A); triangles: after a diet-induced weight loss (examination B); circles: 4 months after RYGB (examination C); diamonds: 18 months after RYGB (examination D). *Significantly different from T2DM; †significant difference between pre- and post-operative values; ‡significantly different from T2DM at examination A, B and C. Data are means ± SEM.
The T2DM patients were then stratified into two groups according to DIIVGTT (Table2). There was no difference in age, weight, weight loss, BMI, fasting insulin, HOMA-IR or the Matsuda index between the two groups (Table2). Duration of diabetes was shorter in T2DMhigh compared with T2DMlow and DIIVGTT and DIOGTT were higher in T2DMhigh compared with T2DMlow. Fasting glucose and HbA1c were lower and fasting C-peptide higher in T2DMhigh compared with T2DMlow (Table2). First phase ISR during the IVGTT (Fig.5) and β-cell glucose sensitivity during the OGTT (Fig.2) were higher in T2DMhigh compared with T2DMlow (P < 0.001), and both were restored by comparison with OB after surgery (Figs 2 and 5). First phase ISR (Fig.5) (P < 0.03) and β-cell glucose sensitivity (Fig.2) (P = 0.01) also increased in T2DMlow after RYGB, but remained markedly impaired compared with T2DMhigh and OB 18 months after RYGB. There was no difference in postprandial GLP-1 concentrations in T2DMhigh compared with T2DMlow (data not shown). The remission rate of type 2 diabetes was 57% and 0% 4 months after surgery and 71% and 38% 18 months after surgery in T2DMhigh and T2DMlow, respectively.
Table 2.
Characteristics in the T2DM with the initial highest (T2DMhigh) or lowest (T2DMlow) β-cell function
| T2DMhigh | T2DMlow | Statistics | |||||||||
|---|---|---|---|---|---|---|---|---|---|---|---|
| A | B | C | D | A | B | C | D | Group | Time | G x T | |
| Sex (M/F) | 4/3 | 2/6 | |||||||||
| Age (years) | 39 ± 2 | 44 ± 2 | 0.13 | ||||||||
| Weight (kg) | 128 ± 9 | 124 ± 10† | 106 ± 7† | 97 ± 11† | 119 ± 6 | 116 ± 5† | 92 ± 3† | 84 ± 5† | 0.18 | < 0.001 | 0.99 |
| Weight loss (%) | 5 ± 1 | 21 ± 2† | 28 ± 3† | 5 ± 1 | 23 ± 1† | 30 ± 3† | 0.47 | < 0.001 | 0.73 | ||
| BMI (kg m−2) | 41 ± 1 | 40 ± 2† | 33 ± 1† | 30 ± 2† | 42 ± 2 | 41 ± 2† | 33 ± 1† | 30 ± 1† | 0.97 | < 0.001 | 0.86 |
| Fasting insulin (pmol l−1) | 100 ± 17 | 98 ± 10 | 46 ± 10‡ | 50 ± 5‡ | 121 ± 21 | 102 ± 13 | 48 ± 11‡ | 43 ± 13‡ | 0.78 | < 0.001 | 0.47 |
| Fasting C-peptide (pmol l−1) | 777 ± 60 | 799 ± 59 | 522 ± 59‡ | 509 ± 21‡ | 643 ± 63 | 654 ± 62 | 464 ± 42‡ | 389 ± 56‡ | 0.02 | < 0.001 | 0.74 |
| Fasting glucose (mmol l−1) | 6.6 ± 0.5 | 6.1 ± 0.3 | 5.3 ± 0.3|| | 5.2 ± 0.1‡ | 8.9 ± 0.8 | 8.6 ± 0.7 | 7.4 ± 0.7|| | 6.4 ± 0.3‡ | < 0.001 | 0.003 | 0.70 |
| HbA1c (mmol mol−1) | 48 ± 3 | 41 ± 1† | 38 ± 2‡ | 34 ± 2‡ | 63 ± 6 | 55 ± 5† | 46 ± 4‡ | 47 ± 3‡ | 0.02 | < 0.001 | 0.79 |
| Matsuda index (a.u.) | 1.5 ± 0.2 | 1.8 ± 0.2 | 4.2 ± 0.7‡ | 4.4 ± 0.7‡ | 1.7 ± 0.4 | 1.9 ± 0.3 | 4.3 ± 0.9‡ | 5.9 ± 1.9‡ | 0.68 | < 0.001 | 0.84 |
| HOMA-IR (a.u.) | 2.1 ± 0.3 | 1.9 ± 0.2 | 0.9 ± 0.2‡ | 0.9 ± 0.1‡ | 2.4 ± 0.4 | 2.0 ± 0.2 | 1.0 ± 0.2‡ | 1.0 ± 0.2‡ | 0.50 | < 0.001 | 0.58 |
| DIOGTT (a.u.) | 1.2 ± 0.4 | 1.6 ± 0.3 | 3.5 ± 0.9‡ | 3.4 ± 1.1‡ | 0.4 ± 0.1 | 0.4 ± 0.1 | 1.0 ± 0.2‡ | 1.8 ± 1.0‡ | < 0.001 | < 0.001 | 0.53 |
| DIIVGTT (a.u.) | 0.6 ± 0.2 | 1.0 ± 0.2 | 3.0 ± 0.5‡ | 3.4 ± 0.9‡ | 0.1 ± 0.1 | 0.1 ± 0.1 | 0.6 ± 0.3‡ | 1.9 ± 1.1‡ | 0.002 | < 0.001 | 0.14 |
| Diabetes (HbA1c > 42.1 mmol mol−1, fasting glucose > 5.6 mmol l−1 or medication) | 7 | 6 | 3 | 2 | 8 | 8 | 8 | 5 | |||
| Time since diagnosis (yrs) | 1.5 ± 0.5 | 8.9 ± 2.4 | 0.01 | ||||||||
| Medication (no. of patients) | |||||||||||
| Antihypertensive | 3 | 3 | 2 | 2 | 4 | 3 | 2 | 2 | |||
| Statins | 1 | 1 | 1 | 1 | 1 | 1 | 1 | 1 | |||
| Metformin | 1 | 1 | 0 | 0 | 6 | 6 | 1 | 1 | |||
| Insulin | 1 | 1 | 0 | 0 | 3 | 3 | 0 | 0 | |||
| GLP-1 analog | 2 | 2 | 0 | 0 | 2 | 2 | 0 | 0 | |||
| DPP-4 inhibitor | 0 | 0 | 0 | 0 | 1 | 1 | 0 | 0 | |||
HbA1c: glycosylated haemoglobin, type A1c
DIOGTT: disposition index calculated from the OGTT
DIIVGTT: disposition index calculated from the IVGTT;
HOMA-IR: homeostatic model assessment of insulin resistance.
significantly different from previous examinations
significantly different from preoperative values
significantly different from A.
Data are means ± SEM.
Figure 5.
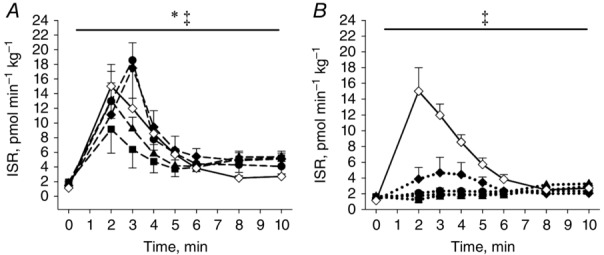
First phase ISR during the IVGTTs in OB and the T2DM with the initial highest (A) or lowest (B) β-cell function
OB examination D is added to the figures as a normal reference of the ISR. Open symbols: OB; filled symbols: T2DM; squares: baseline (examination A); triangles: after a diet-induced weight loss (examination B); circles: 4 months after RYGB (examination C); diamonds: 18 months after RYGB (examination D); dashed lines: T2DMhigh; dotted lines: T2DMlow. *T2DMhigh significantly different from T2DMlow; ‡Examination C and D significantly different from A. Data are means ± SEM.
Discussion
In the present study morbidly obese subjects, with impaired or preserved β-cell function were followed during a massive weight loss. The major finding was the marked difference regarding the postoperative recovery of the first phase ISR during the IVGTT in the T2DM patients (Fig.5). Thus, in T2DMhigh the ISR was markedly increased during the first 10 min of the test 4 months after surgery. The increased secretory capacity was maintained 18 months after RYGB and comparable to the response seen in OB (Fig.5). In contrast, in the patients with the lowest initial β-cell function, T2DMlow, only minor improvements in the capacity to secrete insulin were seen 4 and 18 months after surgery (Fig.5).
Part of the difference in first phase ISR between the two T2DM groups is probably explained by the duration of diabetes (Table2), but it should be noted that the groups did not differ with respect to baseline weight, BMI, age or insulin sensitivity (Table2). Furthermore, the two groups had similar weight loss and postoperative postprandial GLP-1 concentrations. Regardless, the remission rate of type 2 diabetes after RYGB was twice as high in T2DMhigh compared with T2DMlow. The present prospective study is the first to stratify patients with type 2 diabetes with respect to their preoperative disposition index. The results show that preoperative β-cell function, assessed by an IVGTT, is a useful determinant for chance of remission of type 2 diabetes after RYGB, and suggest that early intervention may be important for the chance to experience remission. Previous studies have found fasting C-peptide to predict glycaemic control after RYGB (Aarts et al. 2013; Adams et al. 2013). In the present study C-peptide did not differ between OB and T2DM, but was higher in T2DMhigh compared with T2DMlow. Thus, the present data only partially agree with previous findings. This is likely explained by the markedly higher fasting glucose concentration in T2DM compared with OB stimulating fasting insulin secretion in the former group. Thus, our data underline that the fasting glucose concentration may be a confounding factor when using preoperative C-peptide concentrations for prediction of glycaemic control after RYGB. An earlier study by Nannipieri et al. (2011) showed marked difference in β-cell glucose sensitivity during an OGTT 1½ and 12 months after RYGB in patients with type 2 diabetes that experienced early, late or no remission of the diabetes, respectively. The findings in the present study are in line with this and show that the preoperative DI and first phase ISR may be equally important determinants for diabetes remission after RYGB.
The ISR AUC did not increase during the OGTT with surgery in OB and T2DM in the present study. However, the glucose dynamics changed after surgery with higher incremental ISR during the first 60 min after oral glucose administration, but lower ISR the following 60 min in both groups (Fig.1). The result is in concordance with previous studies (Nannipieri et al. 2011; Jorgensen et al. 2012; Salinari et al. 2013) and a consequence of increased initial glucose absorption and disposal with the surgery-induced change in gut anatomy (Jacobsen et al. 2012). The postprandial plasma GLP-1 concentration increased markedly with surgery in both groups and the postprandial GIP concentration did not change (Fig.3). Neither of the incretin hormones differed between the groups. This is in line with the majority of previous studies investigating incretin release after RYGB when glucose or a mixed meal is administered orally (le Roux et al. 2007; Laferrere et al. 2007, 2008; Morinigo et al. 2006; Bose et al. 2010; Jorgensen et al. 2012; Salinari et al. 2013; Bojsen-Moller et al. 2014).
The glucose excursion was lower during the OGTT in both OB and T2DM after surgery and tended to be lower during the IVGTT in T2DM. This will affect the ISR during the tests and therefore the DIOGTT is a better marker for β-cell function compared with the ISR in the present study. Stratifying the T2DM with respect to the DIOGTT did not change the patient composition in T2DMhigh and T2DMlow. Thus, in the present study DIOGTT and DIIVGTT were equally good in predicting remission of diabetes after RYGB. The DIOGTT increased in T2DMhigh, T2DMlow and OB after RYGB showing an improved ability in the β-cells to compensate for the prevailing insulin resistance (Table1 and 2). In the T2DM, the increased DIOGTT was the result of both increased insulin sensitivity and increased β-cell glucose sensitivity after RYGB (Table2 and Fig.2). The increased glucose sensitivity may be the result of both the markedly increased postoperative postprandial GLP-1 release which enhances glucose induced insulin secretion (the incretin effect) (Fig.2) (Laferrere et al. 2007), and lower β-cell gluco- and lipotoxicity. Earlier studies by Salehi et al. (2011) and Jorgensen et al. (2013) have indicated that the increased postoperative GLP-1 release is important for the improved β-cell function in T2DM, but results from Jimenez et al. (2013) speak against this. Salinari et al. studied obese patients with and without type 2 diabetes before and 1 month after RYGB. The authors found a minor, but significant, increase in first phase insulin ISR in T2DM after surgery, and a marked increase in the ISR during the OGTT (Salinari et al. 2013). Therefore, they suggested that the marked increase in postprandial GLP-1 could be the trigger for increased ISR after RYGB (Salinari et al. 2013). In the present study the postoperative ISR was markedly increased in some, but not all, T2DM during the initial 10 min of the IVGTT (Figs4 and 5). Thus, the difference between the two studies may be explained by the great preoperative variation in β-cell function in T2DM, as shown in the present study (Fig.5), together with the low number of participants in the study by Salinari et al. (7 in each group). Recently Dutia et al. (2014) showed postoperative increased ISR during a 50 g OGTT, but not during an iso-glycaemic intravenous glucose infusion in 16 patients with type 2 diabetes. The authors therefore concluded that limited recovery of the β-cell function was seen after RYGB. Differences in the experimental designs may account for part of the different results between Dutia et al. and the present study. Thus, during an IVGTT the glucose concentration is markedly higher compared with an iso-glycaemic glucose infusion. Furthermore, the glucose concentration during an IVGTT and OGTT is not matched, and therefore cannot be used to calculate the incretin effect. Finally, time since diagnosis of type 2 diabetes was shorter in the present study (T2DMhigh) compared with Dutia et al. Thus, the ability to regain β-cell function may be higher in the patients in the present study.
To ensure minimal discomfort for the patients after the RYGB a stimulus of 25 g of glucose was used both orally and intravenously. This may be seen as a limitation in the present study, because it will lead to a lower incretin effect during the OGTT. Thus, possible differences between the groups or after RYGB may be harder to identify. However, a robust postoperative increase in GLP-1 and GIP release was seen. Furthermore, dumping was avoided which otherwise could have resulted in exclusion of the patients who experienced this. After surgery patients spend ∼4 min consuming the glucose solution for the OGTT to avoid dumping symptoms. Regardless, postoperative glucose uptake was faster, seen as a steeper glucose concentration curve during the first 30 min of the OGTT, as a result of the changed gut anatomy (Fig.1). The division of T2DM into T2DMhigh and T2DMlow was done retrospectively. Since duration of diabetes, baseline disposition indexes and glycaemic control differed between the two groups, the influence of the individual parameters on diabetes remission cannot be distinguished. However, the duration of diabetes and the β-cell function are likely to be linked, and glycaemic control markedly improved in both groups with weight loss diminishing any potential β-cell glucose toxicity.
The present study adds to our understanding of the restoration of the β-cell function after RYGB in several ways. First, a marked increase in β-cell function and normalization of first phase ISR are seen in some patients with short duration of type 2 diabetes when glucose is infused intravenously and no stimulation of the incretin hormones is present. Thus, in this group of patients factors apart from the increased incretin response seem to be important for the improved β-cell function after RYGB. Second, the total increase in β-cell function is lower, and the time needed to partly recover the function is longer in patients with low preoperative β-cell function. The results in the present study do not rule out an important role for GLP-1, but the data emphasize the importance of the preoperative β-cell function and disease duration, likely to be linked, for the chances of postoperative remission of type 2 diabetes.
Acknowledgments
We thank laboratory technicians Sofie Pilgaard Olesen, Lene Albæk, Jeppe Bach, Thomas Beck, Katrine Qvist and Regitze Kraunsøe for their technical assistance during the study. Emilie Hansen, Lærke Taudorf, Marie Palsø and Anne Line Jørgensen are thanked for help with patient recruitment and performing experiments. Nurses Lisette Lind Larsen and Anne-Lise Mortensen and Annette Svenningsen, MD, Køge Hospital are thanked for their help with recruitment and coordination of the patients.
Glossary
- AUC
area under the curve
- BMI
body mass index
- DI
disposition index
- FFA
free fatty acids
- GIP
glucose-dependent insulinotropic polypeptide
- GLP-1
glucagon-like peptide-1
- HbA1c
glycated haemoglobin A1c
- HOMA-IR
homeostatic model assessment of insulin resistance
- ISR
insulin secretion rate
- IVGTT
intravenous glucose tolerance test
- OB
obese patient without type 2 diabetes
- OGTT
oral glucose tolerance test
- RYGB
Roux-en-Y gastric bypass
- T2DM
patient with type 2 diabetes
Additional information
Competing interests
The authors declare that they have no conflict of interest associated with this paper.
Author contributions
M.L. researched data and wrote manuscript. M.H., S.S. and S.D. researched data and reviewed the manuscript. M.S., A.K.F., K.B. recruited patients, performed the RYGB surgery and reviewed the manuscript. J.J.H. and J.W.H. analysed data and reviewed the manuscript. F.D. designed the study, researched data and reviewed/edited the manuscript.
Funding
Financial support from the Innovation Fund Denmark (0603-00381B), the Nordea Foundation, the Danish Ministry of Science, Technology and Innovation (via UNIK program: Food, Fitness & Pharma for Health and Disease), the Kathrine and Vigo Skovgaards foundation, and the Simon Fougner Hartmann Family Foundation is gratefully acknowledged.
References
- Aarts EO, Janssen J, Janssen IM, Berends FJ, Telting D. de Boer H. Preoperative fasting plasma C-peptide level may help to predict diabetes outcome after gastric bypass surgery. Obes Surg. 2013;23:867–873. doi: 10.1007/s11695-013-0872-8. [DOI] [PubMed] [Google Scholar]
- Adams ST, Salhab M, Hussain ZI, Miller GV. Leveson SH. Preoperatively determinable factors predictive of diabetes mellitus remission following Roux-en-Y gastric bypass: a review of the literature. Acta Diabetol. 2013;50:475–478. doi: 10.1007/s00592-013-0453-2. [DOI] [PubMed] [Google Scholar]
- Bojsen-Moller KN, Dirksen C, Jorgensen NB, Jacobsen SH, Serup AK, Albers PH, Hansen DL, Worm D, Naver L, Kristiansen VB, Wojtaszewski JF, Kiens B, Holst JJ, Richter EA. Madsbad S. Early enhancements of hepatic and later of peripheral insulin sensitivity combined with increased postprandial insulin secretion contribute to improved glycemic control after Roux-en-Y gastric bypass. Diabetes. 2014;63:1725–1737. doi: 10.2337/db13-1307. [DOI] [PubMed] [Google Scholar]
- Bose M, Teixeira J, Olivan B, Bawa B, Arias S, Machineni S, Pi-Sunyer FX, Scherer PE. Laferrere B. Weight loss and incretin responsiveness improve glucose control independently after gastric bypass surgery. J Diabetes. 2010;2:47–55. doi: 10.1111/j.1753-0407.2009.00064.x. [DOI] [PMC free article] [PubMed] [Google Scholar]
- Buchwald H, Estok R, Fahrbach K, Banel D, Jensen MD, Pories WJ, Bantle JP. Sledge I. Weight and type 2 diabetes after bariatric surgery: systematic review and meta-analysis. Am J Med. 2009;122:248–256. doi: 10.1016/j.amjmed.2008.09.041. [DOI] [PubMed] [Google Scholar]
- Camastra S, Gastaldelli A, Mari A, Bonuccelli S, Scartabelli G, Frascerra S, Baldi S, Nannipieri M, Rebelos E, Anselmino M, Muscelli E. Ferrannini E. Early and longer term effects of gastric bypass surgery on tissue-specific insulin sensitivity and beta cell function in morbidly obese patients with and without type 2 diabetes. Diabetologia. 2011;54:2093–2102. doi: 10.1007/s00125-011-2193-6. [DOI] [PubMed] [Google Scholar]
- Campos GM, Rabl C, Peeva S, Ciovica R, Rao M, Schwarz JM, Havel P, Schambelan M. Mulligan K. Improvement in peripheral glucose uptake after gastric bypass surgery is observed only after substantial weight loss has occurred and correlates with the magnitude of weight lost. J Gastrointest Surg. 2010;14:15–23. doi: 10.1007/s11605-009-1060-y. [DOI] [PMC free article] [PubMed] [Google Scholar]
- Dunn JP, Abumrad NN, Breitman I, Marks-Shulman PA, Flynn CR, Jabbour K, Feurer ID. Tamboli RA. Hepatic and peripheral insulin sensitivity and diabetes remission at 1 month after Roux-en-Y gastric bypass surgery in patients randomized to omentectomy. Diabetes Care. 2012;35:137–142. doi: 10.2337/dc11-1383. [DOI] [PMC free article] [PubMed] [Google Scholar]
- Dutia R, Brakoniecki K, Bunker P, Paultre F, Homel P, Carpentier AC, McGinty J. Laferrere B. Limited recovery of beta-cell function after gastric bypass despite clinical diabetes remission. Diabetes. 2014;63:1214–1223. doi: 10.2337/db13-1176. [DOI] [PMC free article] [PubMed] [Google Scholar]
- Hovorka R, Soons PA. Young MA. ISEC: a program to calculate insulin secretion. Comput Methods Programs Biomed. 1996;50:253–264. doi: 10.1016/0169-2607(96)01755-5. [DOI] [PubMed] [Google Scholar]
- Jacobsen SH, Olesen SC, Dirksen C, Jorgensen NB, Bojsen-Moller KN, Kielgast U, Worm D, Almdal T, Naver LS, Hvolris LE, Rehfeld JF, Wulff BS, Clausen TR, Hansen DL, Holst JJ. Madsbad S. Changes in gastrointestinal hormone responses, insulin sensitivity, and beta-cell function within 2 weeks after gastric bypass in non-diabetic subjects. Obes Surg. 2012;22:1084–1096. doi: 10.1007/s11695-012-0621-4. [DOI] [PubMed] [Google Scholar]
- Jimenez A, Casamitjana R, Viaplana-Masclans J, Lacy A. Vidal J. GLP-1 action and glucose tolerance in subjects with remission of type 2 diabetes after gastric bypass surgery. Diabetes Care. 2013;36:2062–2069. doi: 10.2337/dc12-1535. [DOI] [PMC free article] [PubMed] [Google Scholar]
- Jorgensen NB, Dirksen C, Bojsen-Moller KN, Jacobsen SH, Worm D, Hansen DL, Kristiansen VB, Naver L, Madsbad S. Holst JJ. Exaggerated glucagon-like peptide 1 response is important for improved beta-cell function and glucose tolerance after Roux-en-Y gastric bypass in patients with type 2 diabetes. Diabetes. 2013;62:3044–3052. doi: 10.2337/db13-0022. [DOI] [PMC free article] [PubMed] [Google Scholar]
- Jorgensen NB, Jacobsen SH, Dirksen C, Bojsen-Moller KN, Naver L, Hvolris L, Clausen TR, Wulff BS, Worm D, Lindqvist HD, Madsbad S. Holst JJ. Acute and long-term effects of Roux-en-Y gastric bypass on glucose metabolism in subjects with Type 2 diabetes and normal glucose tolerance. Am J Physiol Endocrinol Metab. 2012;303:E122–E131. doi: 10.1152/ajpendo.00073.2012. [DOI] [PubMed] [Google Scholar]
- Kashyap SR, Daud S, Kelly KR, Gastaldelli A, Win H, Brethauer S, Kirwan JP. Schauer PR. Acute effects of gastric bypass versus gastric restrictive surgery on beta-cell function and insulinotropic hormones in severely obese patients with type 2 diabetes. Int J Obes (Lond) 2010;34:462–471. doi: 10.1038/ijo.2009.254. [DOI] [PMC free article] [PubMed] [Google Scholar]
- Laferrere B, Heshka S, Wang K, Khan Y, McGinty J, Teixeira J, Hart AB. Olivan B. Incretin levels and effect are markedly enhanced 1 month after Roux-en-Y gastric bypass surgery in obese patients with type 2 diabetes. Diabetes Care. 2007;30:1709–1716. doi: 10.2337/dc06-1549. [DOI] [PMC free article] [PubMed] [Google Scholar]
- Laferrere B, Teixeira J, McGinty J, Tran H, Egger JR, Colarusso A, Kovack B, Bawa B, Koshy N, Lee H, Yapp K. Olivan B. Effect of weight loss by gastric bypass surgery versus hypocaloric diet on glucose and incretin levels in patients with type 2 diabetes. J Clin Endocrinol Metab. 2008;93:2479–2485. doi: 10.1210/jc.2007-2851. [DOI] [PMC free article] [PubMed] [Google Scholar]
- le Roux CW, Welbourn R, Werling M, Osborne A, Kokkinos A, Laurenius A, Lonroth H, Fandriks L, Ghatei MA, Bloom SR. Olbers T. Gut hormones as mediators of appetite and weight loss after Roux-en-Y gastric bypass. Ann Surg. 2007;246:780–785. doi: 10.1097/SLA.0b013e3180caa3e3. [DOI] [PubMed] [Google Scholar]
- Lindgren O, Carr RD, Deacon CF, Holst JJ, Pacini G, Mari A. Ahren B. Incretin hormone and insulin responses to oral versus intravenous lipid administration in humans. J Clin Endocrinol Metab. 2011;96:2519–2524. doi: 10.1210/jc.2011-0266. [DOI] [PubMed] [Google Scholar]
- Matsuda M. Defronzo RA. Insulin sensitivity indices obtained from oral glucose tolerance testing: comparison with the euglycemic insulin clamp. Diabetes Care. 1999;22:1462–1470. doi: 10.2337/diacare.22.9.1462. [DOI] [PubMed] [Google Scholar]
- Mingrone G, Panunzi S, De Gaetano A, Guidone C, Iaconelli A, Leccesi L, Nanni G, Pomp A, Castagneto M, Ghirlanda G. Rubino F. Bariatric surgery versus conventional medical therapy for type 2 diabetes. N Engl J Med. 2012;366:1577–1585. doi: 10.1056/NEJMoa1200111. [DOI] [PubMed] [Google Scholar]
- Morinigo R, Lacy AM, Casamitjana R, Delgado S, Gomis R. Vidal J. GLP-1 and changes in glucose tolerance following gastric bypass surgery in morbidly obese subjects. Obes Surg. 2006;16:1594–1601. doi: 10.1381/096089206779319338. [DOI] [PubMed] [Google Scholar]
- Nannipieri M, Mari A, Anselmino M, Baldi S, Barsotti E, Guarino D, Camastra S, Bellini R, Berta RD. Ferrannini E. The role of beta-cell function and insulin sensitivity in the remission of type 2 diabetes after gastric bypass surgery. J Clin Endocrinol Metab. 2011;96:E1372–E1379. doi: 10.1210/jc.2011-0446. [DOI] [PubMed] [Google Scholar]
- Orskov C, Rabenhoj L, Wettergren A, Kofod H. Holst JJ. Tissue and plasma concentrations of amidated and glycine-extended glucagon-like peptide I in humans. Diabetes. 1994;43:535–539. doi: 10.2337/diab.43.4.535. [DOI] [PubMed] [Google Scholar]
- Salehi M, Prigeon RL. D’Alessio DA. Gastric bypass surgery enhances glucagon-like peptide 1-stimulated postprandial insulin secretion in humans. Diabetes. 2011;60:2308–2314. doi: 10.2337/db11-0203. [DOI] [PMC free article] [PubMed] [Google Scholar]
- Salinari S, Bertuzzi A, Guidone C, Previti E, Rubino F. Mingrone G. Insulin sensitivity and secretion changes after gastric bypass in normotolerant and diabetic obese subjects. Ann Surg. 2013;257:462–468. doi: 10.1097/SLA.0b013e318269cf5c. [DOI] [PubMed] [Google Scholar]
- Schauer PR, Bhatt DL, Kirwan JP, Wolski K, Brethauer SA, Navaneethan SD, Aminian A, Pothier CE, Kim ES, Nissen SE. Kashyap SR. Bariatric surgery versus intensive medical therapy for diabetes—3-year outcomes. N Engl J Med. 2014;370:2002–2013. doi: 10.1056/NEJMoa1401329. [DOI] [PMC free article] [PubMed] [Google Scholar]
- Schauer PR, Kashyap SR, Wolski K, Brethauer SA, Kirwan JP, Pothier CE, Thomas S, Abood B, Nissen SE. Bhatt DL. Bariatric surgery versus intensive medical therapy in obese patients with diabetes. N Engl J Med. 2012;366:1567–1576. doi: 10.1056/NEJMoa1200225. [DOI] [PMC free article] [PubMed] [Google Scholar]
- Sjostrom L. Review of the key results from the Swedish Obese Subjects (SOS) trial – a prospective controlled intervention study of bariatric surgery. J Intern Med. 2013;273:219–234. doi: 10.1111/joim.12012. [DOI] [PubMed] [Google Scholar]
- Vetter ML, Wadden TA, Teff KL, Khan Z, Carvajal R, Ritter S, Moore RH, Chittams JL, Iagnocco A, Murayama K, Korus G, Williams NN. Rickels MR. GLP-1 plays a limited role in improved glycemia shortly after Roux-en-Y gastric bypass: A comparison to intensive lifestyle modification. Diabetes. 2014;64:434–446. doi: 10.2337/db14-0558. [DOI] [PMC free article] [PubMed] [Google Scholar]
- Wimmelmann CL, Dela F. Mortensen EL. Psychological predictors of mental health and health-related quality of life after bariatric surgery: a review of the recent research. Obes Res Clin Pract. 2014a;8:e314–e324. doi: 10.1016/j.orcp.2013.11.002. [DOI] [PubMed] [Google Scholar]
- Wimmelmann CL, Smith E, Lund MT, Hansen M, Dela F. Mortensen EL. The psychological profile of bariatric patients with and without type 2 diabetes: baseline results of the longitudinal GASMITO-PSYC study. Surg Obes Relat Dis. 2014b;11:412–418. doi: 10.1016/j.soard.2014.05.022. [DOI] [PubMed] [Google Scholar]