

Abstract
Current orthotopic xenograft models of human colorectal cancer (CRC) require surgery and do not robustly form metastases in the liver, the most common site clinically. CCR9 traffics lymphocytes to intestine and colorectum. We engineered use of the chemokine receptor CCR9 in CRC cell lines and patient-derived cells to create primary gastrointestinal (GI) tumors in immunodeficient mice by tail-vein injection rather than surgery. The tumors metastasize inducibly and robustly to the liver. Metastases have higher DKK4 and NOTCH signaling levels and are more chemoresistant than paired sub-cutaneous xenografts. Using this approach, we generated 17 chemokine-targeted mouse models (CTMMs) that recapitulate the majority of common human somatic CRC mutations. We also show that primary tumors can be modeled in immunocompetent mice by microinjecting CCR9-expressing cancer cell lines into early-stage mouse blastocysts, which induces central immune tolerance. We expect that CTMMs will facilitate investigation of the biology of CRC metastasis and drug screening.
Human subcutaneous and orthotopic xenografts in mice have provided many insights into CRC pathogenesis1-3, but the requirement for immunodeficient mice to avoid rejection has limited studies of adaptive immunity in CRC progression2. Neither xenograft nor genetically engineered mouse models (GEMM) robustly recapitulate the process of human CRC cell metastasis from the GI tract to the liver and there is a need for less chemosensitive models to reduce the number of futile CRC clinical trials.
Chemokines are secreted ligands that regulate cell trafficking between different organs4. Small intestine and colon epithelia produce Chemokine 25 (CCL25), which binds to Chemokine Receptor 9 (CCR9)-expressing cells5,6. We engineered CRC cells to express CCR9, which enabled generation of two kinds of human CRC mouse models—an immunodeficient model produced by tail-vein injection, and an immunocompetent model created by blastocyst injection. We used tail-vein injection to create a molecularly diverse resource of 17 immunodeficient CTMMs from CRC cell lines and patient-derived xenograft (PDX) lines engineered to express CCR9, which collectively carry the majority of recurrent somatic CRC mutations, and all major CRC subtypes as defined by histopathology and molecular mechanism. We also generated three immunocompetent CRC mouse models by microinjecting three human CRC cell lines expressing CCR97 into wild-type (wt) mouse early blastocysts to form human-mouse chimeras. The importance of using of immunocompetent models is increasingly recognized as appreciation of the role of the immune system in the tumor microenvironment increases. These humanized chimeric mice develop CRC tumors that originated from the blastocyst-injected, human PDX CRC cells in the GI tract. To our knowledge, no previous study has demonstrated mouse models of human cancer via blastocyst injection.
Using tail-vein injection, we show sequential metastasis of primary human CRC tumors to the liver that recapitulates the portal-vein route occurring in patients. Hepatic metastases have elevated DKK4 levels and upregulated Notch signaling (which have previously been associated with CRC chemoresistance)8,9 and are significantly less sensitive to commonly used anti-CRC therapies than paired sub-cutaneous xenografts generated from the same cells.
RESULTS
Modeling Recurrent Human Primary CRC Mutations
CCR9 is up-regulated in primary tumors from early-stage CRC patients, but down regulated in late-stage CRCs7. Using mouse tail-vein injection, early-stage CRC cells that endogenously express CCR9 spontaneously form primary CRCs in the colorectum and intestine, attracted by CCL257. Blocking CCL25-CCR9 interaction by short-hairpin RNA (shRNA) or antibodies against CCL25 promotes metastasis and formation of extra-intestinal tumors.
We established a Chemokine-Targeted Mouse Model (CTMM) system to study primary human CRC mechanisms of progression and chemoprevention in the native GI microenvironment. We generated a panel of 17 doxycycline-inducible human CCR9+ cell and PDX lines (Supplementary Fig. 1a-c, 2 and 3) to model human CRC tumors carrying the majority of common recurrent somatic mutations occurring in patients (Supplementary Table 1). This resource includes examples from all the major histopathological and molecularly defined CRC sub-types, such as DNA mismatch repair proficient and deficient, CpG Island Methylator Phenotype (CIMP), adenocarcinoma and mucinous sub-types. (Supplementary Table 1).
For each CCR9+ colorectal cancer cell and PDX line in the panel, in vitro Boyden chamber assays confirmed that chemotaxis towards recombinant mouse Ccl25 was increased with CCR9 expression (Supplementary Fig. 1c). Each model also co-expresses constitutive luciferase and RFP reporters (Supplementary Fig.1a). Using tail-vein injection into immunodeficient mice and luciferase monitoring (Fig. 1a, b and Supplementary Fig.3), within 3 weeks each CTMM model forms mean1.88±0.57 colorectal tumors per affected mouse host, (whereas the CCR9- parental lines rarely, if at all, form colorectal tumors (mean 0-0.15)) (Fig. 1c, Supplementary Table 2).
Figure 1. Modeling Primary Human CRC Recurrent Mutations in Mice without Survival Surgery.
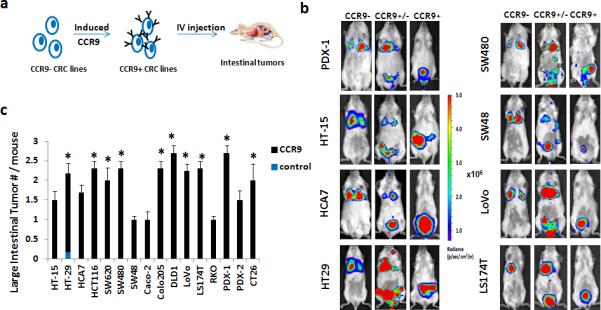
(a). Schematic of lentiviral infection with Tetracycline inducible CCR9 expression cassette and constitutive luciferase-RFP reporter genes. CCR9+ cells were injected into 6-8 week old NSG mice by tail vein and intestinal tumor formation monitored by IVIS-luciferase imaging. Blue dots: GI tumors. (b). Representative whole body IVIS images of mice injected with CRC cells expressing a control luciferase reporter only (CCR9−), constitutive CCR9 expression and luciferase (CCR9+) or 1:1 mixture (CCR9+/−).(c). Quantification of mean luciferase-detectable large intestinal tumors in 6-8 week mice injected with CCR9 expressing cells (CCR9+) via tail vein. * P< 0.05 CCR9+ vs. control by Fisher's exact test. Error bars indicate S.E.M. (stand. error of mean). All cell lines combined control vs. CCR9+, P=0.04; Mixed-effects poisson regression test. Also see Supplemental Table 2.
Human Primary CRC Tumors in Immunocompetent Mouse Hosts
Previously, Ccl25 has been detected in mouse embryos at the 1 through 8-cell and blastocyst stages10,11, e9.5-e13.5 brain10,11, e12.5 embryonic thymus12, and e14.5 intestine6. Using mouse embryonic stem cell microinjection techniques13,14, we FACS sorted 3 CCR9+ colorectal cancer cell lines (PDX-3, DLD1-CCR9 and Ls174t-CCR9) and injected 10-15 cells into wild-type Swiss-Webster or C57B/L6 mouse e3.5 blastocysts to generate human CRC-mouse chimeras (Fig. 2).
Figure 2. Human Primary CRC-immunoproficient Mouse Host Chimeras (a).
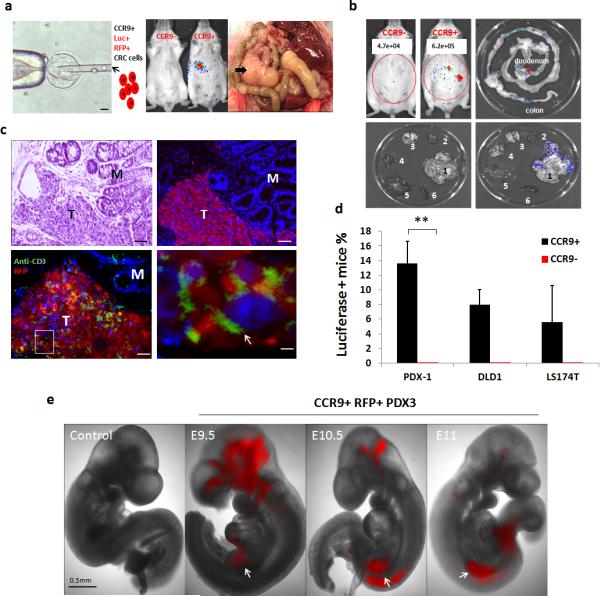
Left: schematic of mouse blastocyst injection with luciferase+ RFP+ CCR9+ CRC cells (10-15 cells/blastocyst); Scale bars, 20μ. Middle: representative whole body IVIS images of human PDX-mouse chimeras (8 weeks) generated by mouse blastocyst injection with CCR9+ PDX-3,(Luciferase - photon signal are indicated, Mock: littermate controls injected with luciferase+ RFP+ CCR9− PDX-3 cells.); Right: Three-month old human PDX-mouse chimera with abdominal tumor mass extending from intestine (4X). Arrow indicates tumor.(b).Representative IVIS whole-body (left upper panel) and ex vivo images (right upper and lower panels) show adult chimeras (8-weeks) with luciferase+ tumors detectable in the GI (1. GI; 2. Heart; 3. Lung; 4. Kidney; 5. Liver; 6. Spleen). (c). Anti-RFP immunofluorescence (Upper right) of colon PDX tumor in chimeric mice (age 8 weeks).Left upper image shows Hematoxylin (nuclear: blue) and Eosin (cytoplasm: pink) (H+E) staining of the same intestinal tumor for comparison. Scale bars, 50μ. Lower panel images show double-immunofluorescence of T cells (anti-mouse CD3 antibody (green)) and human PDX cells (anti-RFP antibody (red)). Nuclei, DAPI (blue). M, mucosa; T: regions with adenocarcinoma morphology. Arrows indicate CD3+ T cells. Scale bars, 50μ (left) & 5μ (right) (d).Percentages of chimeric mice carrying luciferase positive tumors generated with 3 CRC cell lines. *P< 0.05; ** P < 0.001 by 2-sided Mann-Whitney test, Error bars indicate S.E.M. (e). Representative RFP fluorescent images (4X) of whole embryos at embryonic day 9.5, 10.5 and 11. Mock control: littermate controls not injected with CRC cells. White arrows designate midgut location. Scale bar, 0.5 mm.
Approximately 80%, 60% and 83% of e9.5 to e14.5 embryos derived from PDX-3, DLD1-CCR9+ and Ls174t-CCR9+ cell injected blastocysts carry RFP+ human CRC cells. Approximately 10% of e14.5 embryos had RFP+ cells and were visibly deformed. In human CRC-mouse embryo chimeras, RFP+ cells were seen in multiple locations, usually in e10.5-e14.5 midgut (Fig. 2e, Supplementary Fig. 5a). Co-immunofluorescence of Ccl25/RFP showed RFP+ cells in close proximity, and adjacent to, Ccl25+ e14.5 intestinal epithelial cells (Supplementary Fig. 5b). Consistent with Ccl25 expression by e14.5 thymus12, we observed human RFP+ cells comingling with Thy1+ thymus epithelia (Supplementary Fig. 5b).
For each CCR9+ CRC cell blastocyst microinjection session into pseudo-pregnant mouse foster mothers, we obtained 24-40 live mouse pups/80 injections and implantation. At post-natal day 21, mice derived from CRC-CCR9+ cell injected blastocysts are IVIS+. Luciferase activity localizes to intestine/colon (PDX-3 13.5%, DLD1-CCR9 8.1% and Ls174t-CCr9 5.6%) (Fig. 2d, Fig. 2b, Supplementary Fig. 6a, b). No IVIS+ tumors were observed in 112 pups born from blastocysts injected with CCR9-negative FACS sorted PDX-3, DLD1 and Ls174t cells (Fig. 2d).
After 6 months, locally invasive tumors penetrating the bowel wall are detected (Fig. 2a). Human centromeric repeat PCR confirmed tumors consist of human and not mouse cells (Supplementary Fig.6 c). Immuno- and histopathological analysis confirmed that intestine/colon tumors are also RFP+ and CCR9+, consistent with the growth of microinjected human luciferase/RFP-labeled CRC cells in the wt immunocompetent host GI microenvironment (Fig.2c).
No human IVIS signal or CRC cells were detected in any other organ, such as lung, liver, spleen, kidney or skeletal muscle (Fig. 2b, Supplementary Fig. 6a, b). Dual-immunofluorescence with anti-RFP and anti-mouse CD3 antibodies (Fig. 2c) confirmed that mouse hosts carrying human primary CRC tumors have mouse T cells, as well as mouse CD20+ B cells infiltrating human CRCs.
To test immune tolerance, we subcutaneously inoculated 3-month-old DLD1-CCR9 and PDX-1 -C57B/L6-J2 chimeras with their matched blastocyst injected cell lines, along with NSG controls. At day 15, NSG mice showed robust luciferase activity at injection sites, whereas wild type C57B/L6-J2 mice had no luciferase activity (Supplementary Fig. 7a). Overall, 6/7 and 7/8 of CCR9+ DLD1 and PDX-3- C57B/L6-J2 chimeras challenged with subcutaneous DLD1 or PDX-3 cells showed luciferase activity at the injection site (Supplementary Fig. 7b).
To confirm that mice are immunocompetent, we analyzed spleen and mesenteric lymph nodes (MLNs) from PDX-3+ mice and control blastocyst-non-injected littermates. T and B cells were clearly present, and the relative proportions of spleen and MLN CD3+ (T cells), CD4+ (T helper cells), CD8+ (cytotoxic T cells), and CD19+ (B cells) did not significantly differ between the groups (Supplementary Fig.8a-c). Analysis of CD4+ T helper revealed equivalent populations of CD62Lhi CD44lo (naïve cells), CD62Llo CD44hi (activated memory T cells), RORγt+ (Th17), and Foxp3+ (Treg) cells.
We tested whether human-mouse chimera orthotopic CRC tumors could be used for chemotherapy drug testing. We treated mice with 5-fluorouracil/oxaliplatin (5-FU/oxaliplatin) or mock therapy. These experiments showed that 5FU/oxaliplatin inhibited the growth of orthotopic human CRC tumors (Supplementary Fig. 7c, d).
Sequential primary human CRC-liver metastasis formation
We used doxycycline treatment of NSG CTMM models to maintain CRC cell CCR9 expression after tail-vein injection. However, seven CTMM models (CCR9-PDX1, HT15, HCA7, SW48, Colo205, DLD1 and LS174T) formed liver tumors (mean 3.1-8.2 liver tumors/mouse by 8 weeks). Liver tumors were observed only in mice that previously developed primary CRCs (Supplementary Fig. 9). CCR9 protein expression was not detectable in CTMM liver tumors by immunofluorescence (data not shown). These findings are consistent with a model whereby CTMM promotes cells from primary CRC tumors to lose CCR9 expression, and metastasize to the liver via the portal circulation.
Therefore, we tail-vein injected mice to generate primary CRC CTMM models. After primary GI tumor formation, we withdrew doxycycline to down-regulate CCR9 (Fig. 3a-c). Liver tumor multiplicity was higher when CCR9 levels were suppressed (Fig. 3d and Supplementary Fig. 10a). IVIS imaging revealed luciferase-detectable primary CRCs (mean 1.8 weeks post-inoculation) at multiple stages of local invasion (Fig. 3c) preceding liver tumors (mean 5.8 weeks post-inoculation). Liver tumors were rarely detected in non-CTMM models, in which tail-vein injected CRC cells usually form lung tumors (Fig. 3e). FACS analysis of mouse liver cells 48 hours after tail-vein injection showed that RFP+ cells were essentially undetectable (Supplementary Fig. 10b), arguing against an alternative model in which CCR9 suppression stimulated expansion of previously resident human CRC cells in liver.
Figure 3. Sequential human CRC primary GI tumor- metastasis formation.
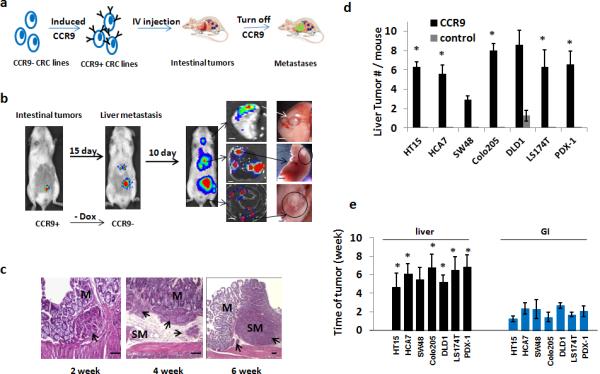
(a).Schematic of sequential human primary CRC and liver metastasis. 6-8 week m/f NSG mice were injected with CCR9+ human CRC cells and monitored by IVIS imaging. Once primary GI tumors were detected, CCR9 expression was silenced by withdrawing doxycycline from drinking water. Mice were monitored using IVIS-luciferase imaging for 4-6 weeks and sacrificed. Blue dots: GI tumors; green dots: metastatic tumors. (b).Representative whole-body IVIS images(CRC line DLD1 as representative) show sequential lower abdominal and right upper quadrant abdominal detectable photons, with ex vivo confirmation of abdominal right upper quadrant tumors as liver- or lung-localized (4X)(n = 8 each for CCR9+ and CCR9− arm for each cell line analyzed).(c).Histopathology (H+E staining) examples of different primary CRC tumors detectable as submucosal (2nd week), with invasion of submucosa (4thweek)and muscularis (6th week). Arrows indicate histopathologically confirmed tumors; M, mucosa; SM, submucosa. Scale bars, 100μ.(d).Quantification of liver metastases in mice (n = 8 each for CCR9+ and CCR9− arm for each cell line analyzed) tail vein injected with control lentiviral vector infected CRC cells (control) or CRC cells with inducible CCR9 expression. * P< 0.05 vs. control by 2-sided Mann-Whitney test. All CCR9+ vs. control cell lines, P=0.001 2-sided Student t test. (e).Time post-injection of cells with inducible CCR9 expression to luciferase-detectable signal in histopathologically confirmed primary GI or liver tumors (n = 8 mice each for CCR9+ and CCR9− arm for each cell line analyzed). ** P< 0.01 by 2-sided Mann-Whitney test. All cell lines liver vs. GI tumors, P=0.001 2-sided Student t test. Also see Supplemental Table 3.
To confirm that CTMM primary CRC tumor cells could enter the portal circulation, we injected mice with FITC-Dextran to label vasculature and used Multi-Photon Microscopy (MPM) to image the primary and liver metastatic tumors. RFP+ CTMM cells co-localize with and travel through host blood vessels, consistent with vascular intravasation (Supplementary Fig. 11).
Our data show that CTMM primary CRC tumors are capable of sequentially modeling the progression of primary human CRC to liver metastases via the portal circulation and can spread to lung. (Fig.3b and data not shown).
CTMM Liver Metastases are Chemoresistant
We compared the sensitivity of Colo205, DLD-1 and Ls174t CTMM and subcutaneous xenografts to oxaliplatin and 5-FU/oxaliplatin. We simultaneously injected mice with the same cells subcutaneously or by tail vein to generate (a) subcutaneous tumors or (b) primary CRCs and sequential liver metastases. IVIS imaging showed that oxaliplatin and 5FU/oxaliplatin significantly inhibited the growth of sub-cutaneous tumors (Fig. 4a, b and Supplementary Fig. 12; oxaliplatin and 5FU/oxaliplatin Padj=0.00017 and 6.47e-09 respectively). Oxaliplatin and 5FU/oxaliplatin similarly inhibited primary orthotopic CRC growth (Padj=0.0078 and 0.00014 respectively). There was no significant difference in chemoresistance comparing GI vs. subcutaneous tumors for either treatment.
Figure 4. Increased chemoresistance of human CRC cells in liver vs. orthotopic or subcutaneous xenografts.
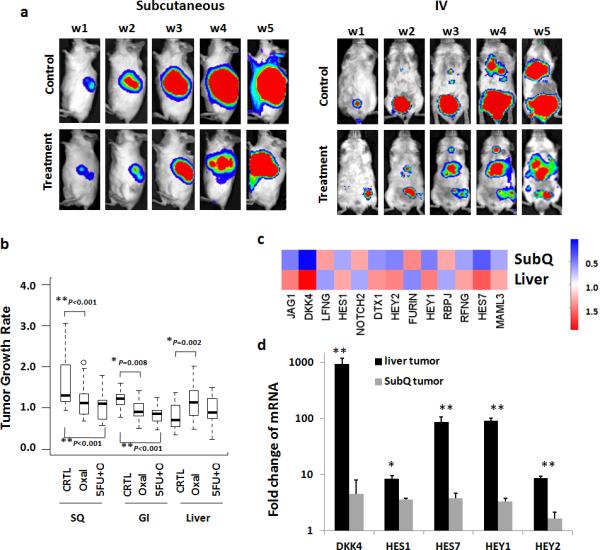
1 × 10⁶ CCR9+ CRC cells were injected by tail-vein or subcutaneously in 6-week NSG mice (n=8/ arm) and IVIS imaging performed to monitor tumor formation. When GI or subcutaneous tumors reached radiance of 5 × 10⁶ (p/sec/cm2/sr), doxycycline was withdrawn to turn off CCR9 expression and oxaliplatin (6mg/kg), 5-FU (100mg/kg) or normal saline as control was intravenously given once weekly for 5 weeks (W1-W5). Real-time whole body IVIS imaging of mice with subcutaneous inoculated (a, left panel) or tail-vein injected CTMM cells (a, right panel) treated with Oxaliplatin (b). Quantification of the effects of Oxaliplatin alone (Oxal) or in combination (5FU+O) on growth rate of GI, liver and subcutaneous xenografts by luciferase -photon signal. ANOVA was used to compare change in tumor growth rate with three CRC lines (DLD1, Colo205 and LS174T) at week 5 from week1.P-values were adjusted for multiple comparisons by controlling the experiment-wise error rate using the Bonferroni-Holm method** P< 0.001; * P< 0.05 compared to the control group. Error bars indicate S.E.M. Each box-whisker plot represents 24 mice / arm. Also see supplementary figure 12 for tumor growth rates of each line. (c) Heat map presenting expression levels of indicated transcripts in RNA-seq comparison of non-treated DLD1 subcutaneous vs. liver metastasis tumors. Red indicates upregulation. (d).mRNA levels of DKK4, HES1, HES7, HAY1 and HEY2 in week 5 DLD1 liver tumors (n=6) and subcutaneous tumors (n=6) using quantitative PCR. ** P< 0.01; * P< 0.05 compared to subcutaneous tumors by 2-sided Mann-Whitney test.
For CRC hepatic metastases generated from the same cells, no growth inhibition was observed (Fig. 4a, b and Supplementary Fig. 12). Chemoresistance was significantly greater for liver metastases vs. subcutaneous (Padj=9.84e-07 and 9.94e-07 respectively) or primary GI (Padj=3.26e-05 and 0.000284) tumors.
RNA-seq profiling of liver and sub-cutaneous tumors generated from DLD-1 cells revealed that Colorectal Cancer Metastasis Signaling was upregulated (p=0.049). Dickkopf 4 (DKK4) was highly upregulated (76-fold; p=0.00001) in CRC liver metastases (Fig. 4 c and 4 d). High DKK4 is associated with clinical CRC chemoresistance8. Notch pathway signaling is associated with CRC chemoresistance and was also significantly upregulated in CRC liver metastases (p=0.012)9.
DISCUSSION
We generated a resource of human primary CRC CTMM models that collectively carry the major recurrent somatic alterations occurring in CRC patients. This resource is targeted to the GI tract by CCR9 expression and can be used for studying metastasis mechanisms and chemoresistance.
Based on mouse fetal intestine and colon expression of the CCR9 ligand Ccl2515,16, we developed a system to model human CRC growth and local invasion in immunocompetent mice. Ccl25 expression has previously been detected in mouse blastocysts18,19 as well as embryonic thymus12, where it regulates self-tolerance. CCR9+ human CRC cells injected into mouse blastocysts persist, proliferate and migrate to multiple locations in developing embryos, primarily thymus and intestine. After birth, CCR9+ human CRC cells can be detected in intestine and colon and develop into tumors. When chimeras are challenged after birth subcutaneously with the same human CRC cells that they were exposed to during embryogenesis, human cells persist for more than two weeks whereas they are not detectable in control wild-type mice, demonstrating the systemic immune tolerance to the human tumor cells whereas blastocyst injection with CCR9- CRC cells does not result in detectable human cells postnatally.
Current hepatic metastasis models using human CRC cells are time- and labor-intensive. Direct injection of human CRC cells into the heart left ventricle, kidney capsule or spleen are potentially confounded by anatomical routes to the liver that do not recapitulate the microenvironment favorable for transit from the gut through the portal circulation and lymphatics that occur in almost all advanced stage CRC patients17. These approaches introduce potential experimental confounders such as needle exit wound tracts, iatrogenic local inflammation and systemic stress. Hepatic vein, lymphatic and tributary flow to the liver is unique in that it receives both oxygenated and deoxygenated blood and consequently has lower pO2 and hemodynamic perfusion pressure than other organs18-20. It is likely that the portal circulation pre-conditions CRC liver metastases.
Our data demonstrate that in vivo CRC liver metastases are significantly less chemosensitive than paired subcutaneous xenografts generated from the same cells. Both Notch signaling and WNT pathway inhibitor DKK4 upregulation have been previously associated with CRC chemoresistance8,9 and both are significantly upregulated in CTMM CRC liver metastases.
Other studies have suggested that in vitro cultured human CRC primary tumors are more chemosensitive to 5-FU than paired hepatic metastases21. However, this finding has never been validated in mice. Here we confirmed that the same CRC cells in liver are indeed more chemoresistant than primary CRC tumors to oxaliplatin in mouse models.
In summary, we anticipate that the CTMM resources described here can help improve our mechanistic understanding of primary CRC-microenvironment interactions, liver metastasis pre-conditioning by transit through the portal circulation, and potentially improve the clinical relevance of pre-clinical anti-CRC drug screening. The immune competent version of the models will most likely be particularly useful for studying mechanisms involving adaptive immunity and immunotherapies.
ONLINE METHODS
Tissue Culture of PDX lines
Patient derived xenograft tumors were harvested and generated as previously described3,7. Briefly, fresh patient CRC samples were collected in Medium 199 supplemented with 200 U/ml penicillin and 200 mg/ml streptomycin, immediately after patient operative resection. Fat and blood clots were removed from tissues and they were rinsed 10 times in sterile PBS. Samples were minced with sterile scalpel blades into approximately 5 mm3 fragments. Tumor fragments were immersed into RNAlater and embedded in O.C.T. (Fisher Scientific) at − 80°C for histopathological or molecular analysis. Remaining tissue fragments were coated in Matrigel (BD Biosciences) and subcutaneously implanted into 3-4 6-week-old NOD/Shi-scid/IL-2Rγnull(NSG) mice (Jackson Laboratory, Bar Harbor, Maine). After PDX tumors reached an average volume of 400 mm3, mice were sacrificed and tumor tissue harvested. Part of tissue was passaged in new mice and the remainder was used to generated PDX cell lines using the method of collagenase /dispase enzyme digestion with slight modification, as previously described7,22. Basically, tissue was minced into approximately1 mm2 fragments and digested in DMEM/F12 containing collagenase type XI (150 U/ml, Sigma, St. Louis, MO), dispase neutral protease (40 μg/ml, Roche Applied Science) and 1% FBS, stirring at 37°C for 30 min. After centrifugation, cells were re-suspended in the DMEM/F12 containing 1% nonessential amino acids (Invitrogen), penicillin (400 U/ml;Sigma), streptomycin (400 mg/ml; Sigma), amphotericin B (1.25 mg/ml; Sigma) and heparin (4 μg/mL; Sigma), human epidermal growth factor (40 ng/mL; BD scientific), human basic fibroblast growth factor (20 ng/mL; BD scientific), B27 supplement (Invitrogen) and 5% Fetal Bovine Serum, then transferred and cultured in the ultra-low-attachment flasks (Corning) at 37°C and 5% CO2. FACS of human ESA (epithelial specific antigen) was used to purify cancer cells and PDX cells were characterized to be able to form subcutaneous xenografts with similar adenocarcinoma histomorphology to parental PDX, when injected 0.5-1 million cells / mouse in NSG mice. PDX lines were frozen in DMSO. PDX freshly thawed cells, negative for mycoplasma, were used within 10 passages for the all experiments in this study.
CCR9 inducible expression in CRC cells and PDX cells
The lentiviral tetracycline-inducible protein expression system (The SureTiter Lentiviral system, GenTarget, Inc) consists of two vectors: the regulatory vector which encodes the Tet repressor (TetR) under the control of the human CMV promoter; and an inducible expression vector expressing human CCR9(CDS region (181 -1290) of gene ID: NM_031200.) or mouse Ccr9 (CDS region (296-1405) of gene ID: NM_009913) genes23 under the control of inducible pH1 promoter and two tetracycline operator 2 (TetO2) sites. To generate the lentiviral particles, the above plasmids were transfected into HEK293T cells with the Genecopoeia lentivirus packaging mix (Genecopoeia) according to the manufacturer's protocol. Cells were infected with the CCR9 inducible expression lentivirus and followed with blasticidin selection and RFP FACS purification. TetR expression lentivirus in high-titer was then used to infect the inducible CCR9 lines. The CCR9 expression can be induced by1-1.5 ug/ml (in vitro) or 1-2mg/ml (in vivo) doxycycline (Sigma, St Louis, MO) administered in 5% sucrose-containing drinking water. The efficiency of CCR9 inducible expression in these variant colorectal lines was verified by Western Blotting using anti-human CCR9 antibody (Abcam cat.#ab38564) or anti-mouse Ccr9 antibody (Thermo Scientific. PA1-21618) and the software of Quantity One (BioRad) was used to semi-quantify protein levels. All non-PDX cell lines used in this study were purchased from ATCC and were negative for mycoplasma.
PDX xenograft tumor formation and drug treatment
0.5-1 × 10⁶ CRC cells with inducible CCR9 expression or control vectors were injected into 6-8 weeks old NOD/Shi-scid/IL-2Rγnull(NSG) mice (Jackson Laboratory, Bar Harbor, Maine) by tail vein injection. Tumor incidence was monitored 2-3 times weekly by whole body IVIS imaging. When mice became moribund, they were sacrificed immediately, necropsy performed and tumors harvested using a dissecting microscope. For oxaliplatin therapy study, 1 × 10⁶ CCR9+ CRC cells were tail-vein injected or subcutaneously inoculated into the left flank of 6-week NSG mice (n=8) and IVIS imaging was performed to monitor tumor formation. When GI or subcutaneous tumors reached radiance of 5 × 10⁶ (p/sec/cm2/sr), doxycycline was withdrawn to turn off CCR9 expression and oxaliplatin (6mg/kg, Sigma, St Louis, MO) / 5-FU (100 mg/kg, Sigma, St Louis, MO) or normal saline as control was given through intraperitoneal (IP) injection once a week for 5 weeks. The treatment regimens include: 1. Oxaliplatin alone group: 6mg/kg oxaliplatin was injected through IP in NSG mice (n=8) once weekly for 5 weeks; 2. The 5-FU+ oxaliplatin combination group: 100 mg/kg 5-FU was injected through IP once in week 1 and once in week 3, and 6mg/kg oxaliplatin was injected into NSG mice (n=8) through IP once in week 2, week 4 and week 5 respectively24. Tumor growth was quantified by luciferase - photon signal analysis with Xenogen software until mice became moribund. Ex vivo IVIS imaging and necropsy were performed to further verify sizes and locations of tumor loci.
Luciferase imaging in whole animal or ex vivo tissues
For luciferase imaging, D-luciferin (The In Vivo Imaging Community.) of 1.5mg/10g body weight was injected intra-peritoneal into mice and 10 min later, luciferase imaging (Xenogen IVIS-200) was applied on whole-mouse bodies. For ex vivo imaging, mice were dissected 10 min after luciferin injection. Intestine and other organs were quickly rinsed 3 times in PBS and place in culture dishes in which luciferase imaging was applied immediately.
Immunohistochemistry
For mouse experiments, histology and immunohistochemistry were performed on paraffin-embedded or frozen sections from xenograft tumors as previously described3. Intestinal, extra-GI tumor and corresponding normal tissues were snap frozen in O.C.T (Fisher Scientific, Pittsburgh, PA) and fixed in 10 % buffered formalin followed by paraffin embedding. For immunofluorescence, sections were immunostained with antibodies, counterstained with 4,6-diamidino-2-phenylindole (DAPI). H+E adjacent sections were used for comparison.
Generation of Human CRC-Mouse Chimeras
The methods of blastocyst microinjection and generation of chimeric mice were modified from standard procedures25. Briefly, Embryonic day (E) 3.5 of Swiss Webster (CFW) or C57B/L6 blastocysts (derived from natural mating. Charles River Strain code 024) were placed in 30 ml FHM (Millipore Cat#MR-122-D) and 10-15 CCR9+ CRC cells were injected per blastocyst by transfertip (ES) (Eppendorf cat. no.: 930001040) and vacutip (Eppendorf cat. no.: 930001015) using Eppendorf TransMan NK micromanipulators with an inverted microscope (Nikon Diaphot). The injected blastocysts were uterine-transferred into day 2.5 pseudopregnant CD-1 recipient females (Charles River Strain Code 022) at the same day (12-15 blastocysts / female). Pups were born at day 19-21 and fostered with lactating CD-1 mice. Live IVIS imaging was performed on the chimerical mice twice every week to detect the proliferation of luciferase+ cells. Then ex vivo IVIS and histopathology were used to confirm the tumor formation and locations.
Chimeric embryos from sacrificed female mice at embryonic days E 9-14.5 were isolated and placed on glass slides after being washed twice in PBS. Fluorescence imaging was immediately performed on the embryos to detect RFP (human CRC cells) signals. The embryos were then snap frozen in O.C.T and fixed in 4 % buffered paraformaldehyde. For immunofluorescence, sections were immunostained with antibodies against RFP (Life Technologies, Cat# R10367), mouse ccl25 (R&D systems, Cat# AF481-NA) and mouse Thy-1 (Abcam, Cat# ab3105) and counterstained with DAPI for nuclei. H+E adjacent sections were used for comparison.
Immune Cell Analyses in Human PDX-Mouse Chimeras
4-week old Swiss Webster mice from blastocysts injected with CCR9+ PDX-1 cells and the littermates from non-injected blastocysts as control for normal immune functions were sacrificed and the spleens and 4 mesenteric lymph nodes (MLN) / mouse were collected in cold PBS under dissecting microscope. Then MLN and spleen were immediately mechanically disrupted and passed through a 70 um cell strainer. Splenocytes and lymphocytes were collected and incubated in ACK lysis buffer (Life Technologies) to remove RBCs. Surface staining was performed with anti-CD3e (ebiosciences, clone:145-2C11), CD4 (ebiosciences, clone:RM4-5), CD8 (ebiosciences, clone:53.67), CD44 (ebiosciences, clone:IM7), and CD62L (ebiosciences, clone:MEL-14). Intranuclear staining with anti-RORγt (ebiosciences, clone:B2D) and anti-Foxp3(ebiosciences, clone:fjk-16s) was performed according to manufacturer's protocol (Intracellular Fixation and Permeabilization Kit from eBioscienes). Prior to intracellular cytokine staining, cells were cultured in the presence of GolgiPlug (BD Biosciences) for 4 hours or stimulated with phorbolmyristate acetate (PMA; 20ng/mL) and ionomycin (1μg/mL) or IL-23 (40ng/mL; eBioscience) in the presence of GolgiPlug (BD Biosciences) for 4 hours before staining. Intracellular cytokine staining was performed according to the manufacturer's protocol (Cytofix/Cytoperm buffer set from BD Biosciences) using IFN-γPECy7 (ebiosciences, clone: XMG1.2) and IL17A FITC (ebiosciences, clone: eBio17B7). An LSR II (BD Biosciences) and FlowJo software (Tree Star) were used for flow cytometry and analysis. Dead cells were excluded using the Live/Dead fixable aqua dead cell stain kit (Invitrogen).
Two-photon microscopy
Three to six month old CTMM NSG mice were kept under isoflurane anesthesia and a portion of the large intestine was externalized to be placed in a saline-filled, temperature-controlled chamber. The portion to image was covered with a glass coverslip and agarose for stability and imaged with a custom-built multi-photon microscope optimized for in vivo imaging. 50 mg/ml FITC-Dextran (FD2000S; Sigma-Aldrich, St. Louis, MO) was retro-orbitally injected in mice (0.25 ml / kg) and this dose allowed vasculature imaging for 1-2 hours. Simultaneous excitation with 900 nm and 1040 nm femtosecond laser light enables imaging of GFP (FITC-Dextran) and RFP (human CRC cells) at the same time.
Whole-Exome Sequencing
DNA was extracted from 4 PDX lines (PDX 1-4) and common CRC lines (HT-15 and Caco-2) using DNeasy DNA extraction kit (Qiagen). Whole-Exome sequence data for the six cell lines were obtained through Agilent's G9906A HaloPlexExome Target Enrichment System kits (protocol Version A, February 2013) on the Illumina HiSeq2000. Briefly, genome DNA samples were first digested by restriction enzymes to create a library of gDNA restriction fragments. Then the HaloPlexexome probe was provided as eight separate probe solutions in wells A–H of the HaloPlex Probe 8-well Strip. The circularized target DNA-HaloPlex probe hybrids, containing biotin, were captured on streptavidin beads and then DNA ligase was added to the capture reaction to close nicks in the circularized HaloPlex probe-target DNA hybrids. After a 10-minute ligation reaction period, the captured DNA libraries were diluted and PCR amplified with the PCR Master Mix. After the enrichment was validated, the samples were pooled with different indexes, and sequenced with Illumina HiSeq2500.~ 60M 101bp pair-end reads for each sample were obtained from HiSeq2500. The mean quality score for all samples was ~ 35, and more than 90% reads had base quality> 30. All the raw reads were first processed with Cutadapt26 to remove adapter sequences from high-throughput sequencing reads. The processed sequence data were mapped to human genome (hg19) with program BWA27. The mapping were re-aligned and recalibrated with GATK28. Variants and mutations were detected with the module Unified Genotyper in GATK. Sequence data were deposited with NCBI (Accession SRP035634).
RNA sequencing and quantitative real-time PCR
Total RNAs from liver tumor or subcutaneous tumor cells were extracted by using the RNeasy Kit (Qiagen, Valencia CA). For RNA-seq, library preparation and HiSeq2000 lane analysis was performed as previously described29. Subsequently, 75-bp paired-end read sequences were mapped to human genome (hg19) with Tophat/bowtie (version 2.1.1). Read count for each gene transcript was obtained with Genomic Features (version 1.15.9). Genes with mean read count in both liver and skin samples less than 10 were filtered out. DESeq (version 1.12.0) was used to analyze for differential expression. Fisher Exact Test was used to assess statistical significance, with adjustment using the Benjamini & Hochberg method for multiple comparisons.
For quantitative PCR, 2 μg of total RNAs were reverse-transcribed into cDNA by using RT first stand kit (SA Biosciences) and RNA levels amplified by PCR containing SYBR Green I dye (Invitrogen), normalized to β-actin as the comparative CT (cycling threshold)= CT (target)- CT (control), were analyzed by the iCycler (Bio-Rad). Primer pairs used are (1) DKK4: F5’-CGTTCTGTGCTACATGTCGTGG and R5’-GTGTGCCATCTTGCTCATCAAGC; (2) HES1: F5’-GGAAATGACAGTGAAGCACCTCC and R5’-GAAGCGGGTCACCTCGTTCATG; (3) HES7: F5’-CATCAACCGCAGCCTGGAAGAG and R5’-CACGGCGAACTCCAATATCTCC; (4)HEY1: F5’-TGTCTGAGCTGAGAAGGCTGGTand R5’-TTCAGGTGATCCACGGTCATCTG; (5)HEY2: F5’-TGAGAAGACTTGTGCCAACTGCT and R5’- CCCTGTTGCCTGAAGCATCTTC; (6)human β-actin: F5’-CGCGAGAAGATGACCCAGAT and R5’-ACAGCCTGGATAGCAACGTACAT; (7)mouse β-actin: F5’-GATCTGGCACCACACCTTCTand R5’-GGGGTGTTGAAGGTCTCAAA.
Fluorescent activated cell sorting (FACS) analysis
FACS with anti-epithelial specific antigen (ESA, BD Pharmingen Cat #347197) antibody was used to purify PDX cells [3,4] Cells were first incubated with anti-human ESA antibody conjugated with Alexa Fluor 488 for 30 minutes on ice and then were washed in 1% BSA/PBS buffer. FITC filter was then used to separate cells into ESA positive and negative sub-groups by signal intensity gating. The ESA+ cells were transferred into culture flasks for further growth and passages.
To detect RFP positive cells in mouse liver, 0.5 × 10⁶CCR9+ RFP+ Luciferase+ CRC cells were injected into 6-week NOG mouse (n=6) by tail vein. After 48 hours, mice were sacrificed and liver pieces in the same weight were treated with collagenase / dispase (1 mg/ml, Roche Applied Science) for 0.5-1 hour to create single-cell suspension and followed with BD Pharm Lyse (BD Scientific) treatment according to company instruction, to destroy red blood cells. RFP cells were measured as PE positive and FITC negative in FACS channels.
Transwell migration assay
Transwell Boyden chambers (BD Pharmingen Mountain View, CA) of 8-μm pore size were used to evaluate migration in vitro of parental or CCR9 expression CRC cells and PDX cells. Briefly, cells were seeded at a density of 5 × 10⁵ per well into the upper chamber. Culture medium as described above with 100 ng/ml recombinant mouse CCL25 protein (R&D systems Inc; Minneapolis, MA) was loaded into the lower chamber. Chambers of cells were incubated in 37°C and 5 % CO2 conditions for 12 hours. At the time of harvest, cells remaining inside the upper chambers were removed while cells attached to the lower surface of the membrane were fixed and stained with Crystal violet (Sigma, St Louis, MO) followed by imaging and cell number counting analyses.
Supplementary Material
Acknowledgements
We thank other members of the Lipkin laboratory and Shen Laboratory for helpful discussions. We also thank the Cornell BRC imaging and Stem Cell and Transgenic Core Facilities. This work was supported by NSF 1137269, NSF 1106153, NSF GRFP- 2011131053, NIH R01 GM095990, CA098626, NIH 2UL1 - RR024996, NIH UH2TR000516, DARPA 19-1091726, and generous donations by Matthew Bell and Fred Greenberg.
Footnotes
Author Contributions H.J.C, X.S., and S.M.L. conceived the concept, designed the experiments, and co-wrote the manuscript; H.J.C. Z.H., M.A., N.R., J.C., P.B., L.W., Y.X., and M.S. performed the experiments; J.S., K.Y.C., and Z.G. contributed to bioinformatics analyses; H.H.J., R.M., C.A., and W.E. performed blastocyst injections; N.R., D.J., J.C., R.G., and N.N. performed multiphoton imaging; J.M. and G.N. provided tissue samples; R.L. performed assays for detecting immune cells; X.K.Z. performed statistical analysis; R.E. and A.M. performed histopathology analyses.
Competing Financial Interests The authors have no financial conflicts of interest.
REFERENCES
- 1.Ellis LM. Preclinical data targeting vascular endothelial growth factor in colorectal cancer. Clinical colorectal cancer. 2004;4(Suppl 2):S55–61. doi: 10.3816/ccc.2004.s.009. [DOI] [PubMed] [Google Scholar]
- 2.Siolas D, Hannon GJ. Patient-Derived Tumor Xenografts: Transforming Clinical Samples into Mouse Models. Cancer research. 2013 doi: 10.1158/0008-5472.CAN-13-1069. [DOI] [PMC free article] [PubMed] [Google Scholar]
- 3.Sikandar SS, Pate KT, Anderson S, et al. NOTCH signaling is required for formation and self-renewal of tumor-initiating cells and for repression of secretory cell differentiation in colon cancer. Cancer research. 2010;70:1469–78. doi: 10.1158/0008-5472.CAN-09-2557. [DOI] [PMC free article] [PubMed] [Google Scholar]
- 4.Kabelitz D, Wesch D. Features and functions of gamma delta T lymphocytes: focus on chemokines and their receptors. Crit Rev Immunol. 2003;23:339–70. doi: 10.1615/critrevimmunol.v23.i56.10. [DOI] [PubMed] [Google Scholar]
- 5.Youn BS, Kim YJ, Mantel C, Yu KY, Broxmeyer HE. Blocking of c-FLIP(L)--independent cycloheximide-induced apoptosis or Fas-mediated apoptosis by the CC chemokine receptor 9/TECK interaction. Blood. 2001;98:925–33. doi: 10.1182/blood.v98.4.925. [DOI] [PubMed] [Google Scholar]
- 6.Li X, Madison BB, Zacharias W, Kolterud A, States D, Gumucio DL. Deconvoluting the intestine: molecular evidence for a major role of the mesenchyme in the modulation of signaling cross talk. Physiol Genomics. 2007;29:290–301. doi: 10.1152/physiolgenomics.00269.2006. [DOI] [PubMed] [Google Scholar]
- 7.Chen HJ, Edwards R, Tucci S, et al. Chemokine 25-induced signaling suppresses colon cancer invasion and metastasis. The Journal of clinical investigation. 2012;122:3184–96. doi: 10.1172/JCI62110. [DOI] [PMC free article] [PubMed] [Google Scholar]
- 8.Ebert MP, Tanzer M, Balluff B, et al. TFAP2E-DKK4 and chemoresistance in colorectal cancer. The New England journal of medicine. 2012;366:44–53. doi: 10.1056/NEJMoa1009473. [DOI] [PubMed] [Google Scholar]
- 9.Meng RD, Shelton CC, Li YM, et al. gamma-Secretase inhibitors abrogate oxaliplatin-induced activation of the Notch-1 signaling pathway in colon cancer cells resulting in enhanced chemosensitivity. Cancer research. 2009;69:573–82. doi: 10.1158/0008-5472.CAN-08-2088. [DOI] [PMC free article] [PubMed] [Google Scholar]
- 10.He K, Zhao H, Wang Q, Pan Y. A comparative genome analysis of gene expression reveals different regulatory mechanisms between mouse and human embryo pre-implantation development. Reproductive biology and endocrinology : RB&E. 2010;8:41. doi: 10.1186/1477-7827-8-41. [DOI] [PMC free article] [PubMed] [Google Scholar]
- 11.Maekawa M, Yamamoto T, Tanoue T, Yuasa Y, Chisaka O, Nishida E. Requirement of the MAP kinase signaling pathways for mouse preimplantation development. Development. 2005;132:1773–83. doi: 10.1242/dev.01729. [DOI] [PubMed] [Google Scholar]
- 12.Bleul CC, Boehm T. Chemokines define distinct microenvironments in the developing thymus. European journal of immunology. 2000;30:3371–9. doi: 10.1002/1521-4141(2000012)30:12<3371::AID-IMMU3371>3.0.CO;2-L. [DOI] [PubMed] [Google Scholar]
- 13.Schneider JSVJ, Terzic A, Fraidenraich D. Blastocyst injection of embryonic stem cells: a simple approach to unveil mechanisms of corrections in mouse models of human disease. Stem Cell Rev. 2009;4:369–77. doi: 10.1007/s12015-009-9089-6. [DOI] [PubMed] [Google Scholar]
- 14.Eds Johan Auwerx SLA, Brown Stephen D., Justice Monica, Moore David D., Nadeau Joseph. Current Protocols in Mouse Biology. Wiley; 2013. http://onlinelibrarywileycom/book/101002/9780470942390. [Google Scholar]
- 15.Meurens F, Whale J, Brownlie R, Dybvig T, Thompson DR, Gerdts V. Expression of mucosal chemokines TECK/CCL25 and MEC/CCL28 during fetal development of the ovine mucosal immune system. Immunology. 2007;120:544–55. doi: 10.1111/j.1365-2567.2006.02532.x. [DOI] [PMC free article] [PubMed] [Google Scholar]
- 16.Meurens F, Berri M, Whale J, et al. Expression of TECK/CCL25 and MEC/CCL28 chemokines and their respective receptors CCR9 and CCR10 in porcine mucosal tissues. Veterinary immunology and immunopathology. 2006;113:313–27. doi: 10.1016/j.vetimm.2006.05.014. [DOI] [PubMed] [Google Scholar]
- 17.Walters S, Maringe C, Butler J, Brierley JD, Rachet B, Coleman MP. Comparability of stage data in cancer registries in six countries: lessons from the International Cancer Benchmarking Partnership. International journal of cancer Journal international du cancer. 2013;132:676–85. doi: 10.1002/ijc.27651. [DOI] [PubMed] [Google Scholar]
- 18.Lautt WW. Mechanism and role of intrinsic regulation of hepatic arterial blood flow: hepatic arterial buffer response. The American journal of physiology. 1985;249:G549–56. doi: 10.1152/ajpgi.1985.249.5.G549. [DOI] [PubMed] [Google Scholar]
- 19.Thiel H. Liver hemodynamics and portacaval shunt. Surgery, gynecology & obstetrics. 1980;150:587–92. [PubMed] [Google Scholar]
- 20.Dancis J. Transport of substances across perfused organs. Acta endocrinologica Supplementum. 1972;158:347–75. doi: 10.1530/acta.0.069s347. [DOI] [PubMed] [Google Scholar]
- 21.Okumura K, Shiomi H, Mekata E, et al. Correlation between chemosensitivity and mRNA expression level of 5-fluorouracil-related metabolic enzymes during liver metastasis of colorectal cancer. Oncology reports. 2006;15:875–82. [PubMed] [Google Scholar]
- 22.Jahid S, Sun J, Edwards RA, et al. miR-23a promotes the transition from indolent to invasive colorectal cancer. Cancer discovery. 2012;2:540–53. doi: 10.1158/2159-8290.CD-11-0267. [DOI] [PMC free article] [PubMed] [Google Scholar]
- 23.Yu CR, Peden KW, Zaitseva MB, Golding H, Farber JM. CCR9A and CCR9B: two receptors for the chemokine CCL25/TECK/Ck beta-15 that differ in their sensitivities to ligand. Journal of immunology. 2000;164:1293–305. doi: 10.4049/jimmunol.164.3.1293. [DOI] [PubMed] [Google Scholar]
- 24.Wagner M, Roh V, Strehlen M, et al. Effective treatment of advanced colorectal cancer by rapamycin and 5-FU/oxaliplatin monitored by TIMP-1. Journal of gastrointestinal surgery : official journal of the Society for Surgery of the Alimentary Tract. 2009;13:1781–90. doi: 10.1007/s11605-009-0948-x. [DOI] [PubMed] [Google Scholar]
- 25.Nagy A. Manipulating the Mouse Embryo: A Laboratory Manual. Third Edition. Cold Spring Harbor Laboratory Press; 2003. [Google Scholar]
- 26.Martin M. Cutadapt removes adapter sequences from high-throughput sequencing reads. EMB net journal. 2011 [Google Scholar]
- 27.Li H, Durbin R. Fast and accurate short read alignment with Burrows-Wheeler transform. Bioinformatics. 2009;25:1754–60. doi: 10.1093/bioinformatics/btp324. [DOI] [PMC free article] [PubMed] [Google Scholar]
- 28.McKenna A, Hanna M, Banks E, et al. The Genome Analysis Toolkit: a MapReduce framework for analyzing next-generation DNA sequencing data. Genome research. 2010;20:1297–303. doi: 10.1101/gr.107524.110. [DOI] [PMC free article] [PubMed] [Google Scholar]
- 29.Cao Z, Ding BS, Guo P, et al. Angiocrine factors deployed by tumor vascular niche induce B cell lymphoma invasiveness and chemoresistance. Cancer cell. 2014;25:350–65. doi: 10.1016/j.ccr.2014.02.005. [DOI] [PMC free article] [PubMed] [Google Scholar]
Associated Data
This section collects any data citations, data availability statements, or supplementary materials included in this article.