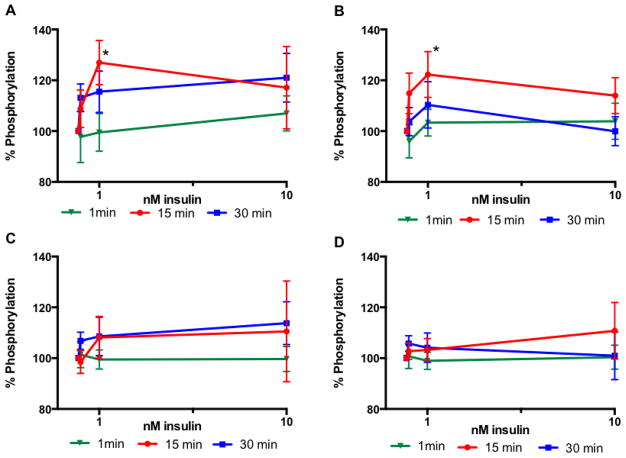
Figure 1.
Time course of activation of the insulin-signaling pathway in sciatic nerve (A, B) and hippocampus (C, D) from control rats. Levels of phosphorylation of insulin receptor (A, C) and GSK3β (B, D) after 1 min (closed triangle), 15 min (closed circle) or 30 min (closed square). Data are mean ± sem, n=6–9. *p<0.05 vs 0 nM insulin by two-way ANOVA followed by Dunnett’s post hoc test.

