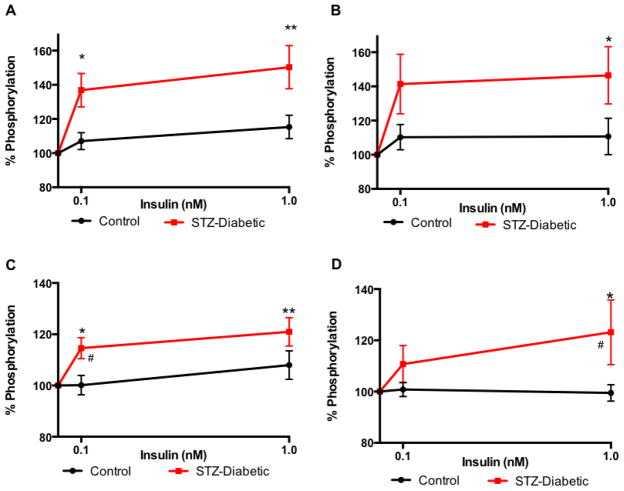
Figure 2.
Increased sensitivity of insulin receptor and GSK3β to ex vivo insulin in sciatic nerve (A, B) and hippocampus (C, D) from diabetic rats (closed square). Levels of phosphorylation of insulin receptor (A, C) and GSK3β (B, D) after 15 min incubation with varied concentration of insulin (0, 0.1, 1 nM). Data are mean ± sem, n=5–10. *p<0.05, **p<0.01, vs 0 nM insulin by two-way ANOVA followed by Dunnett’s post hoc test, # p<0.05, vs control (closed circle) at the same time point by two-way ANOVA followed by Tukey’s post hoc test.

