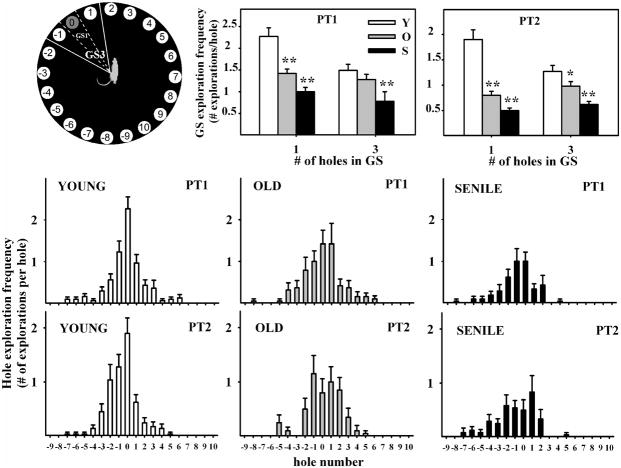
Figure 3. Hole exploration frequency in probe trials.
Notice in the middle and lower panels, the bell-shaped distribution of frequencies around hole #0 and the age-related deterioration of this bell shape. Center and right upper panels show goal sector exploration in young, old and senescent rats. Exploratory activity was measured when GS was taken as only hole #0 (delineated by dashed lines) or when the GS consisted of holes −1, 0 and 1 (delineated by solid lines), as illustrated on the left upper panel. Number of young, old and senescent rats for PT1 was 30, 19 and 21 and for PT2 was 29, 20 and 24, respectively. *P<0.05; **P<0.01; Tukey’s post hoc test.

