

Abstract
Background
Two-dimensional magnetic resonance elastography (2D-MRE) is an advanced magnetic resonance method with high diagnostic accuracy for predicting advanced fibrosis in nonalcoholic fatty liver disease (NAFLD) patients. However, no prospective, head-to-head comparisons between 2D-MRE and clinical prediction rules (CPRs) have been performed in patients with biopsy-proven NAFLD.
Aim
This study compared the diagnostic utility of 2D-MRE against that of eight CPRs (AST:ALT ratio, APRI, BARD, FIB-4, NAFLD Fibrosis Score, Bonacini cirrhosis discriminant score, Lok Index, and NASH CRN model) for predicting advanced fibrosis in a prospective cohort with paired liver biopsy as the gold standard.
Methods
This is a cross-sectional analysis of a prospective study of 102 patients (58.8% women) with biopsy-proven NAFLD, 2D-MRE, and clinical research assessment within 90 days of biopsy. ROC analysis was performed to assess the performance of 2D-MRE and CPRs for predicting advanced fibrosis.
Results
The mean (± SD) age and BMI were 51.3 (±14.0) years and 31.7 (±5.5) kg/m2, respectively. 48, 26, 9, 13, and 6 patients had stage 0, 1, 2, 3, and 4 fibrosis, respectively. The area under ROC curve (AUROC) was 0.957 for 2D-MRE and between 0.796 and 0.861 for the CPRs. FIB-4 was the best-performing CPR at predicting advanced fibrosis with AUROC of 0.861. In head-to-head comparisons using the Delong test, 2D-MRE had significantly better AUROC (p < 0.05) than each CPR for predicting advanced fibrosis.
Conclusions
Compared to CPRs, 2D-MRE provides significantly higher accuracy for advanced fibrosis diagnosis in NAFLD patients.
Keywords: liver biopsy, liver fibrosis, non-alcoholic fatty liver disease, diagnostic tests
INTRODUCTION
Nonalcoholic fatty liver disease (NAFLD) represents a spectrum of liver pathologies in the presence of hepatic steatosis in patients with history of little to no alcohol consumption or secondary causes of hepatic steatosis.1,2 NAFLD is associated with features of the metabolic syndrome, including hypertension, obesity, and diabetes mellitus, and is now a major global cause of liver disease with the rise of the obesity epidemic.3–8 NAFLD ranges from benign hepatic fat accumulation to nonalcoholic steatohepatitis (NASH), a progressive form of the disease that may lead to fibrosis, cirrhosis, and hepatocellular carcinoma. NASH patients with advanced fibrosis are at increased risk for adverse outcomes and therefore require increased monitoring and therapy.1,9–14 Biopsy is currently the gold standard for diagnosing advanced fibrosis in NAFLD patients, although it is invasive, has high inter-observer variability, and is associated with adverse effects, including death.15,16 There is a strong need for the non-invasive diagnosis of advanced fibrosis in NAFLD patients.
Clinical prediction rules (CPRs) utilizing demographic data and lab tests have been developed to predict fibrosis and/or cirrhosis in patients with a wide range liver diseases. The NAFLD fibrosis score17 and the BARD score,18 originally developed for use in NAFLD patients, and the AST to ALT ratio,19 FIB-4,20 and AST to platelet ratio index (APRI),21 originally developed for use in non-NAFLD patients, have all been widely validated for advanced fibrosis prediction in NAFLD and may be useful for identifying NAFLD patients with increased likelihood for advanced fibrosis and/or cirrhosis.22–25 In addition, 2-dimensional magnetic resonance elastography (2D-MRE), an advanced magnetic resonance imaging modality utilizing shear waves, has also been shown to accurately predict NAFLD-associated advanced fibrosis.26,27 However, prospective head-to-head comparison studies between 2D-MRE and clinical prediction rules have not yet been performed.
Utilizing a prospective cohort design, our study will compare the diagnostic accuracy of 2D-MRE against the five clinical prediction rules well-validated in NAFLD patients. For completeness, we also will compare 2D-MRE against three additional clinical prediction rules, the Bonacini cirrhosis discriminant score,28 Lok index,29 and NASH Clinical Research Network (NASH CRN) model,30 that are poorly validated in NAFLD patients.
METHODS
Design
This is a cross-sectional analysis of a prospective cohort involving 102 patients with biopsy-proven NAFLD. After undergoing careful assessment to exclude the presence of other hepatic diseases and secondary causes of hepatic steatosis, patients attended a research visit at the University of California at San Diego (UCSD) NAFLD Translational Research Unit for standardized history, physical exam, anthropometric exam, and biochemical testing.31–35 They also underwent 2D-MRE examinations at the UCSD MR3T Research Laboratory. Informed consent was obtained from all patients. The study was approved by the UCSD IRB and the UCSD Clinical and Translational Research Institute.
Inclusion/Exclusion Criteria
Patients were included if they were ≥18 years old, had biopsy-confirmed NAFLD, had given written informed consent, and did not meet any of the exclusion criteria. The exclusion criteria included regular and/or excessive alcohol use within 2 years prior to recruitment (≥14 drinks/week if male or ≥7 drinks/week if female); clinical or laboratory evidence of secondary NAFLD due to major nutritional and iatrogenic gastrointestinal disorders or human immune deficiency (HIV) infection; clinical or laboratory evidence of non-NAFLD liver diseases including hepatitis B (if positive serum hepatitis B surface antigen), hepatitis C (if positive hepatitis C viral RNA), hemochromatosis, Wilson disease, glycogen storage disease, alpha-1 antitrypsin deficiency, autoimmune hepatitis, cholestatic liver disease, and vascular liver disease; clinical or laboratory evidence of decompensated liver disease (Child-Pugh score > 7 points); active substance abuse; significant systemic illnesses; pregnant status or attempting to become pregnant; contraindication(s) to MRI; any other condition which, in the investigator(s) opinion, may interfere with the participant’s competence, compliance, or ability to complete the study.
Histologic assessment
All participants underwent liver biopsies, which were read and scored by an experienced liver pathologist blinded to the patients’ clinical and radiology data. The Nonalcoholic Steatohepatitis Clinical Research Network (NASH CRN) Histologic Scoring System36 was used for this study. Hepatic steatosis and lobular inflammation were scored on four-point scales (0, 1, 2, 3) and hepatic ballooning was scored on a three-point scale (0, 1, 2). The NAFLD activity score (NAS) was the sum of the hepatic steatosis, lobular inflammation, and hepatic ballooning scores and ranged from 0 – 8. Hepatic fibrosis was scored on a five-point scale (0, 1, 2, 3, and 4), with the primary outcome of advanced fibrosis defined as stage 3 (bridging fibrosis) or stage 4 (cirrhosis).
Clinical research assessment
Patients were evaluated at the UCSD NAFLD Translational Unit research clinic. Detailed history, including history of other liver diseases, was obtained from all patients. A trained investigator performed a physical exam, including vital signs, height, weight, and anthropometric measurements. Body mass index (BMI) was calculated by dividing weight (kg) by height in meters squared. Patients’ history of alcohol consumption was obtained via the Alcohol Use Disorders Identification Test (AUDIT) and Skinner questionnaire, both of which are validated tools to screen for heavy alcohol use and/or active alcohol abuse or dependence. A detailed medications list was obtained. All participants also underwent biochemical tests, which included alanine aminotransferase (ALT), aspartate aminotransferase (AST), alkaline phosphatase (ALP), gamma-glutamyl transpeptidase (GGT), total bilirubin, direct bilirubin, albumin, hemoglobin A1c (HbA1c), fasting glucose, insulin, homeostatic model assessment of insulin resistance (HOMA), prothrombin time, INR, fasting lipid panel, free fatty acids (FFA), C-reactive protein (CRP), and platelet count. HOMA was defined as the product of glucose and insulin divided by 405.37 The diagnosis of metabolic syndrome was calculated using the International Diabetes Federation definition, which included central obesity (BMI > 30 kg/m2) and at least two of the following: triglycerides ≥ 150 mg/dL or specific treatment for elevated triglycerides, reduced HDL-cholesterol < 40 mg/dL in males or < 50 mg/dL in females or specific treatment for low HDL, elevated blood pressure ≥ 130 mmHg systolic or ≥ 85 mmHg diastolic or treatment of previously diagnosed hypertension, and elevated fasting plasma glucose ≥ 100 mg/dL or previously diagnosed type 2 diabetes.38 All patients who met the exclusion criteria based on analysis of clinical history and/or laboratory data were excluded from the study.
2D-MRE
2D-MRE was performed using previously described techniques and commercially available software and hardware (Resoundant Inc., Rochester, MN).27,39–41 Briefly, an acoustic passive driver is secured to the body wall anterior to the liver with an elastic band. The acoustic passive driver is then connected to an acoustic active driver outside the MRI room via a flexible plastic tube. The active driver transmits continuous vibrations at 60 Hz through the flexible plastic tube to the passive driver, which then transmits vibrations to the body that becomes shear waves in the liver. While vibrations are being transmitted, a 2D gradient-recalled echo MRE pulse sequence is performed, and 4 noncontiguous axial slices (10 mm thick, 10 mm interslice gap) are acquired in 16-second breath holds at the widest transverse part of the liver. The acquisition parameters include repetition time (TR), 50 ms; echo time (TE), 20.2 ms; flip angle (FA), 30 degrees; matrix, 256 × 64; field of view (FOV), 48 × 48 cm; one-signal average; receiver bandwidth (BW) ×33 kHz (confirm); and parallel imaging acceleration factor, 2. Oscillating motion-sensitizing gradients encode tissue motion into the phase of the MR signal and generates images (called wave images) depicting shear waves within the liver. This sequence is repeated four times, with the phase relationship (phase offset) between the vibrations and oscillating motion-sensitizing gradients adjusted each time. At each slice location, wave images at 4 evenly spaced time points over the wave cycle are produced. The total acquisition time is about two minutes with 4× 16-second breath-holds w/short recovery in between.
After data acquisition, the wave images at each slice location are automatically processed on the scanner computer with a specialized software utilizing an inversion algorithm. Four quantitative cross-sectional maps (elastograms) are generated, depicting tissue stiffness at each of the four slice locations using a color scale in units of kilopascals (kPa).
The elastograms were transferred offline for analysis42,43 by a trained image analyst with at least six months of experience working with MRE in the MR3T research laboratory. Using a custom software package, the image analyst manually drew regions of interest (ROIs) on the elastograms at the four slice locations in parts of the liver where corresponding wave images showed clearly observable wave propagation, while avoiding liver edges, large blood vessels, and artifacts. The per-pixel stiffness values across the ROIs at the four slice locations were averaged to calculate the mean 2D-MRE stiffness, which was then automatically exported to an electronic spreadsheet.
Duration between biopsy and clinical research assessment
The median time interval between biopsy and clinical research assessment was 29 days (interquartile range 28 days).
Duration between biopsy and 2D-MRE
The median time interval between biopsy and 2D-MRE was 41 days (interquartile range 48 days).
Clinical Prediction Rule Calculation
Eight clinical prediction rules (AST to ALT ratio, APRI, BARD, FIB-4, NAFLD fibrosis score, Bonacini cirrhosis discriminant score, Lok index, and the NASH CRN model) were calculated using previously published formulas (Appendix Table 1).17–21,28–30 For the NASH CRN model, model 2 was used because models 3 and 4 require anthropometric and/or laboratory values that were not obtained routinely in all patients.
Statistical Analyses
Statistical analysis was performed using SPSS version 22.0 and “R” statistical computing software version 3.1.1 (Vienna, Austria).44,45 A two-tailed p-value of ≤0.05 was considered statistically significant. A summary of patients’ demographic, anthropometric, laboratory, histologic, and imaging data was calculated, with mean and standard deviation (SD) used for continuous measures and counts and percentages for categorical measures.
Primary Analysis
Receiver operating characteristic (ROC) curve analysis was performed with 2D-MRE and the eight clinical prediction rules as classifiers for advanced fibrosis. The area under ROC curve (AUROC) was used to measure the overall performance of the calculated ROC curves. 95% confidence intervals were calculated for each AUROC using its standard error. The sensitivity, specificity, positive predictive value (PPV), and negative predictive value (NPV) were calculated for each ROC curve based on published cutoffs for predicting advanced fibrosis, if available. The AUROCs of the eight clinical prediction rules were ranked from highest to lowest. The Delong test46 was used to directly compare the AUROC of 2D-MRE with that of the highest-ranking clinical prediction rule based upon the AUROC of each rule. The number of subjects who were correctly and incorrectly classified at the published cutoff values17–22,28–30 was obtained for 2D-MRE and the highest ranked clinical prediction rule. The cutoff used for 2D-MRE was 3.64 kPa based on validated results from a prospective cohort of NAFLD patients.26 A test of marginal homogeneity was performed comparing the misclassifications of 2D-MRE against that of the highest ranked clinical prediction rule.
Secondary Analysis
Using the Delong test, the AUROCs of 2D-MRE and the seven remaining clinical prediction rules were compared and their p-values were obtained.
RESULTS
Baseline characteristics
This prospective cohort study examined 102 patients with biopsy-proven NAFLD, 2D-MRE, and clinical exam results enrolled between May 2012 and October 2014. The mean (± SD) age and BMI were 51.3 (±14.0) years and 31.7 (±5.5) kg/m2, respectively. The demographic, biochemical, histological, and imaging baseline characteristics are summarized in Table 1. A total of 150 patients observed at the NAFLD Translational Research Unit had biopsy-proven NAFLD within 90 days of clinical exam, although 43 were excluded because they did not undergo 2D-MRE and five were excluded because complete data were not available for clinical prediction rules (Supplemental Figure 1).
Table 1.
Demographic, biochemical, histologic, and imaging characteristics of subjects with biopsy-proven NAFLD
| Patient characteristics (n=102) |
|
|---|---|
| Demographic | |
| Male patients (%) | 60 (58.8) |
| Age (years) at biopsy (SD) | 51.3 (14.0) |
| Height (cm) mean (SD) | 167.5 (9.5) |
| Weight (kg) mean (SD) | 89.2 (19.0) |
| BMI (kg/m2) mean (SD) | 31.7 (5.5) |
| Ethnic origin: | |
| White (%) | 53 (52.0%) |
| Black (%) | 0 (0.0%) |
| Asian (%) | 16 (15.7%) |
| Hispanic (%) | 29 (28.4%) |
| Multi-racial (%) | 2 (2.0%) |
| Other (%) | 1 (1.0%) |
| Missing/refused to disclose | 1 (1.0%) |
| Diabetes (%) | 26 (25.5%) |
| Metabolic syndrome (%) | 38 (37.3%) |
| Biochemical Profile | |
| AST U/L mean (SD) | 42.3 (35.8) |
| ALT U/L mean (SD) | 58.0 (56.1) |
| AST/ALT ratio mean (SD) | 0.82 (0.31) |
| Alk Phos U/L mean (SD) | 73.8 (26.1) |
| GGT U/L mean (SD) | 59.2 (60.1) |
| Total Bilirubin mg/dL mean (SD) | 0.6 (0.4) |
| Direct Bilirubin mg/dL mean (SD) | 0.1 (0.08) |
| Albumin g/dL mean (SD) | 4.5 (0.3) |
| Glucose mg/dL mean (SD) | 108.1 (33.5) |
| Hgb A1C mean (SD) | 6.1 (0.9) |
| Triglycerides mg/dL mean (SD) | 153.9 (75.0) |
| Total Cholesterol mg/dL mean (SD) | 181.0 (38.1) |
| HDL mg/dL mean (SD) | 50.1 (20.0) |
| LDL mg/dL mean (SD) | 102.4 (32.1) |
| Platelet count 109/L mean (SD) | 246.2 (62.7) |
| Protime mean (SD) | 10.7 (0.9) |
| INR mean (SD) | 1.0 (0.1) |
| Histology | |
| Steatosis | |
| 0 | 4 (4.0%) |
| 1 | 36 (35.6%) |
| 2 | 30 (29.7%) |
| 3 | 31 (30.7%) |
| Lobular Inflammation | |
| 0 | 4 (4.0%) |
| 1 | 46 (45.5%) |
| 2 | 50 (49.5%) |
| 3 | 1 (1.0%) |
| Ballooning | |
| 0 | 27 (26.7%) |
| 1 | 59 (58.4%) |
| 2 | 15 (14.9%) |
| Fibrosis | |
| 0 | 48 (47.1%) |
| 1 | 26 (25.5%) |
| 2 | 9 (8.8%) |
| 3 | 13 (12.7%) |
| 4 | 6 (5.9%) |
| NAS mean (SD) | 4.29 (1.53) |
| Imaging | |
| 2D-MRE mean (SD) | 3.17 (1.19) |
| Clinical Prediction Rules | |
| AST:ALT mean (SD) | 0.824 (0.31) |
| APRI mean (SD) | 0.598 (0.600) |
| BARD median (IQR) | 2 (2) |
| FIB-4 mean (SD) | 1.35 (1.13) |
| NAFLD fibrosis score mean (SD) | −1.74 (1.6) |
| Bonacini cirrhosis discriminant score median (IQR) | 3 (2) |
| Lok index mean (SD) | 0.24 (0.17) |
| NASH CRN model mean (SD) | 0.29 (1.4) |
Metabolic syndrome was calculated using the International Diabetes Federation criteria, which included central obesity and at least two of the following: elevated triglycerides, reduced HDL-cholesterol, elevated blood pressure, and elevated fasting plasma glucose.
Abbreviations: BMI: body mass index, AST: aspartate aminotransferase, ALT alanine aminotransferase, Alk phos: alkaline phosphatase, GGT: gamma-glutamyl transpeptidase, Hgb A1c: hemoglobin A1c, HDL: high-density lipoprotein, LDL: low-density lipoprotein, INR: international normalized ratio, NAS: nonalcoholic fatty liver disease activity score, 2D-MRE: 2-dimensional magnetic resonance elastography, APRI: AST-to-platelet ratio index, BARD: body mass index, AST:ALT, diabetes, NASH CRN: nonalcoholic steatohepatitis clinical research network.
Distribution of fibrosis stage
48, 26, 9, 13, and 6 patients had stage 0, 1, 2, 3, and 4 fibrosis, respectively. Thus, 18.6% of the patients met the primary outcome of advanced fibrosis (stage 3–4 fibrosis).
Primary Analyses
ROC curves were plotted (Figure 1) and AUROCs were calculated for 2D-MRE and the eight clinical prediction rules. The AUROC (95% confidence interval) of 2D-MRE for predicting advanced fibrosis was 0.957 (0.918, 0.996). Of the eight clinical prediction rules, FIB-4 had the highest AUROC at 0.861 (0.775, 0.946) for predicting advanced fibrosis. In a direct comparison, 2D-MRE had a significantly better AUROC (p=0.039) than FIB-4 for predicting advanced fibrosis (Table 2, Supplementary Figure 2).
Figure 1.

Receiver operating characteristic (ROC) curves of two-dimensional magnetic resonance elastography (2D-MRE) and eight clinical prediction rules: aspartate aminotransferase (AST) to alanine aminotransferase (ALT) ratio, AST-to-platelet ratio index (APRI), body mass index, AST:ALT, diabetes (BARD), FIB-4, nonalcoholic fatty liver disease fibrosis score (NAFLD fibrosis score), Bonacini cirrhosis discriminant score (CDS), Lok Index, and nonalcoholic steatohepatitis clinical research network (NASH CRN) model for predicting biopsy-proven advanced fibrosis.
Table 2.
AUROCs and AUROC comparisons of 2D-MRE and clinical prediction rules
| AUROC | 95% Confidence Interval | AUROC of MRE vs. Clinical Prediction Rules |
|
|---|---|---|---|
| 2D-MRE | 0.957 | (0.918, 0.996) | Reference |
| Clinical Prediction Rules | |||
| 1) FIB-4 | 0.861 | (0.775, 0.946) | p = 0.039 |
| 2) Lok Index | 0.838 | (0.731, 0.944) | p = 0.046 |
| 3) Bonacini Cirrhosis Discriminant Score | 0.826 | (0.725, 0.926) | p = 0.014 |
| 4) AST to ALT Ratio | 0.825 | (0.732, 0.918) | p = 0.013 |
| 5) NAFLD Fibrosis Score | 0.818 | (0.704, 0.932) | p = 0.013 |
| 6) BARD | 0.816 | (0.723, 0.910) | p = 0.001 |
| 7) APRI | 0.807 | (0.702, 0.911) | p = 0.006 |
| 8) NASH CRN Model | 0.796 | (0.678, 0.915) | p = 0.009 |
p-value: AUROC of 2D-MRE vs. clinical prediction rules → Delong Test
Abbreviations: AUROC: area under receiver operating characteristic, 2D-MRE: 2-dimensional magnetic resonance elastography, AST: aspartate aminotransferase, ALT: alanine aminotransferase, NAFLD: nonalcoholic fatty liver disease, BARD: body mass index, AST:ALT, diabetes, APRI: AST-to-platelet ratio index, NASH CRN: nonalcoholic steatohepatitis clinical research network.
Using a previously published cutoff of 3.64 kPa, 2D-MRE had sensitivity 0.922, specificity 0.904, positive predictive value (PPV) 0.686, and negative predictive value 0.981 for predicting advanced fibrosis. At a high cutoff of 2.67 validated for NAFLD patients,22 FIB-4 had a sensitivity of 0.250 and specificity of 0.976. At a low cutoff of 1.30, FIB-4 had a sensitivity of 0.842 and a specificity of 0.723. 2D-MRE misclassified 10 out of 102 patients (Supplementary Table 2), compared to 27 for FIB-4 at the low cutoff and 16 at the high cutoff (Table 3). The number of misclassifications between 2D-MRE and FIB-4 was significant at the low FIB-4 cutoff of 1.30 (p = 0.011) but was not significant at the high FIB-4 cutoff of 2.67 (p = 0.693). 33 patients (32.5% of total) had FIB-4 scores in the indeterminate range between the high cutoff and low cutoff. 2D-MRE correctly classified 25 out of 33 (75.8%) patients with indeterminate FIB-4 scores.
Table 3.
Diagnostic test characteristics of 2D-MRE and FIB-4
| Test | AUROC (95% Confidence Interval) |
Cut-off | Sens | Spec | PPV | NPV | Number Correctly Classified (%) |
Number Misclassified (%) |
False Positives |
False Negatives |
|---|---|---|---|---|---|---|---|---|---|---|
| 2D-MRE | 0.957 (0.918, 0.996) | 3.64 kPa | 0.922 | 0.904 | 0.686 | 0.981 | 92 (90.2%) | 10 (9.8%) | 8 | 2 |
| FIB-4 | 0.861 (0.775, 0.946) | 1.30 (Lower) | 0.842 | 0.723 | 0.410 | 0.952 | 75 (73.5%) | 27 (26.5%) | 24 | 3 |
| 2.67 (Upper) | 0.250 | 0.976 | 0.703 | 0.850 | 86 (84.3%) | 16 (15.7%) | 2 | 14 |
Abbreviations: AUROC: area under receiver operating characteristic, 2D-MRE: 2-dimensional magnetic resonance elastography, Sens: sensitivity, Spec: specificity: PPV: positive predictive value, NPV: negative predictive value.
Secondary Analyses
The AUROC of 2D-MRE was compared to the AUROC of the seven remaining clinical prediction rules. 2D-MRE had significantly higher AUROC than each of the seven remaining clinical prediction rules (Table 2). The sensitivity, specificity, PPV, and NPV of 2D-MRE and the clinical prediction rules at published cutoffs were calculated (Supplementary Table 3), except for the NASH CRN model due to the lack of previously published cutoffs. As illustrated in Table 4, 2D-MRE accurately predicted advanced fibrosis in some patients where clinical prediction rules gave wrong or indeterminate predictions.
Table 4.
Comparison of 2D-MRE and clinical prediction rules for diagnosing advanced fibrosis in selected patients
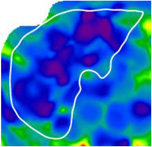
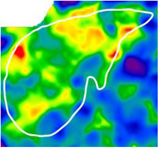
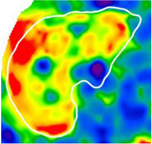
| 2D-MRE Elastograms | |||
|---|---|---|---|
 |
 |
 |
|
| Fibrosis Stage | 1 | 3 | 4 |
| Advanced Fibrosis Diagnosis | No | Yes | Yes |
| Hepatic Stiffness (kPa) | 2.5 | 3.7 | 5.7 |
| 2D-MRE Performance | Correct | Correct | Correct |
| Clinical Prediction Rules Performance | |||
| FIB-4 | Indeterminate | Indeterminate | Indeterminate |
| Lok Index | Correct | Indeterminate | Indeterminate |
| Bonacini Cirrhosis Discriminant Score | Correct | Wrong | Wrong |
| AST to ALT Ratio | Correct | Wrong | Correct |
| NAFLD Fibrosis Score | Wrong | Indeterminate | Indeterminate |
| BARD | Wrong | Wrong | Correct |
| APRI | Wrong | Correct | Wrong |
| NASH CRN Model | N/A | N/A | N/A |
Abbreviations: 2D-MRE: 2-dimensional magnetic resonance elastography, AST: aspartate aminotransferase, ALT: alanine aminotransferase, NAFLD: nonalcoholic fatty liver disease, BARD: body mass index, AST:ALT, diabetes, APRI: AST-to-platelet ratio index, NASH CRN: nonalcoholic steatohepatitis clinical research network.
2D-MRE elastograms of three patients with stiffness values of 2.5 (left), 3.7 (middle), and 5.7 (right) kPa are shown. Patients had stage 1, 3, and 4 fibrosis, respectively. 2D-MRE correctly diagnosed all three patients with or without advanced fibrosis whereas clinical prediction rules produced mixed results.
DISCUSSION
Main findings
Utilizing a prospective cohort design, our study demonstrated that 2D-MRE is highly accurate for the diagnosis of advanced fibrosis in adults with NAFLD. This is consistent with previous studies showing 2D-MRE to be highly accurate for advanced fibrosis prediction.26,27 We also demonstrated 2D-MRE to be superior to commonly available clinical prediction rules in predicting advanced fibrosis.
The noninvasive diagnosis of advanced fibrosis remains a major unmet need in the care of NAFLD patients. Although clinical prediction rules have been developed to predict advanced fibrosis in NAFLD patients,17–21,28–30 their AUROCs are significantly below that of 2D-MRE. Also, FIB-4, the NAFLD fibrosis score, and the Lok Index18,19,22,23,29 have indeterminate ranges. We propose that 2D-MRE is more accurate than clinical prediction rules and may be used in addition to clinical prediction rules for the non-invasive diagnosis advanced fibrosis in NAFLD patients, especially in patients whose clinical prediction rules score may be indeterminate.
In context of published literature
The results of this study are consistent with previously published studies that demonstrated 2D-MRE to be effective in diagnosing advanced fibrosis. Kim et al. retrospectively showed 2D-MRE to be superior to five of the eight clinical prediction rules we examined (AST:ALT ratio, APRI, FIB-4, NAFLD fibrosis score, and BARD) for diagnosing advanced fibrosis in a retrospective cohort NAFLD patients, with 2D-MRE having an AUROC of 0.954 and with FIB-4 and the NAFLD fibrosis score having the highest AUROCs of the clinical prediction rules at 0.829 and 0.799, respectively.27 Our analysis showed a comparable AUROC at 0.957 for 2D-MRE and also showed FIB-4 to have the highest AUROC of the eight clinical prediction rules we examined, at 0.861, with the NAFLD fibrosis score ranking lower at 0.818. Two additional prediction rules not included in Kim et al., the Bonacini CDS28 and the Lok Index29, also performed well for predicting advanced fibrosis with AUROCs of 0.826 and 0.838, respectively. The Bonacini CDS and the Lok Index were both originally developed for predicting hepatitis C cirrhosis and are thus far poorly validated in NAFLD patients. However, the performances of all eight clinical prediction rules we examined were still significantly below that of 2D-MRE.
2D-MRE had a significantly better AUROC than FIB-4, the best-performing clinical prediction rule in our analysis. FIB-4 has two cutoffs, an upper cutoff at 2.68 with good specificity and NPV and a lower cutoff at 1.30 with good sensitivity and PPV. Although FIB-4 was originally developed with an upper cutoff of 3.25 for use in patients with HIV and hepatitis C co-infection, for our analysis we used an alternative upper cutoff of 2.68 that was validated in a separate cohort of NAFLD patients.19,22,47 Although using a combination of the upper FIB-4 cutoff to rule in advanced fibrosis and the lower cutoff to rule out advanced fibrosis would have resulted in only five out of 102 misclassifications in our cohort (three false negatives and two false positives), it also results in 33 patients (32.4% of total) falling into the FIB-4 indeterminate range. 2D-MRE accurately classified 25 out of 33 patients in the FIB-4 intermediate range who would otherwise not have been classified using FIB-4 alone. Therefore, while FIB-4 may have diagnostic utility in the prediction of NAFLD-associated advanced fibrosis, it is less accurate than 2D-MRE. In addition, 2D-MRE can achieve high diagnostic accuracy even in patients with indeterminate FIB-4 scores.
The NAFLD fibrosis score, originally developed for NAFLD patients,18 is the most widely validated of all the clinical prediction rules we examined,22,23,25 and has been recommended as a screening tool to identify NAFLD patients with higher likelihoods of advanced fibrosis and/or cirrhosis in the NAFLD practice guideline from the American Association for the Study of Liver Diseases, American College of Gastroenterology, and the American Gastroenterological Association.1 Our study shows that 2D-MRE is also significantly better than the NAFLD fibrosis score for detecting advanced fibrosis in NAFLD patients. Better diagnostic accuracy may be achieved if 2D-MRE is used instead of the NAFLD fibrosis score as a screening tool for advanced fibrosis in NAFLD patients. However, the cost-effectiveness of 2D-MRE vs. the NAFLD fibrosis score in the context of improved diagnostic outcomes remains unknown.
Strength and limitations
The main strength of this study lies in its use of a prospective cohort of patients with biopsy-proven NAFLD and clinical indications for liver biopsy who met strict inclusion and exclusion criteria. The NASH CRN histologic scoring system, well-validated in NAFLD patients, was used as the gold standard. Biopsy, 2D-MRE, and clinical data in each subject were done at close time intervals to one another. Data collection and 2D-MRE imaging were performed by experienced personnel at a specialized center with a high degree of expertise in clinical and radiologic NAFLD research.
However, this study has several limitations. It was performed by highly trained personnel at a single center specializing in NAFLD research, and the generalizability of its results in other clinical settings remains unknown. This study is cross-sectional and does not provide evidence on the longitudinal benefit of 2D-MRE vs. clinical prediction rules in detecting changes in liver fibrosis. Although 2D-MRE is cheaper than biopsy at our center, it remains more expensive than clinical exams. Further studies are needed to determine if the additional diagnostic utility of 2D-MRE offsets its increased costs compared to the use of clinical prediction rules, although additional refinements in magnetic resonance technology may lower their costs in the future.
Implication for future research
This prospective study shows 2D-MRE is superior to clinical prediction rules for diagnosing advanced fibrosis in patients with biopsy-proven NAFLD. 2D-MRE may be helpful in identifying patients with higher risks of advanced fibrosis, especially if the patients have indeterminate clinical prediction rule scores. This study is also consistent with previous studies showing 2D-MRE to be highly accurate for detecting NAFLD-associated advanced fibrosis. Future studies should focus on the utility of 2D-MRE and clinical prediction rules to detect and monitor fibrosis progression in multicenter, progressive, and longitudinal cohorts, as well as the cost-effectiveness of 2D-MRE compared to clinical prediction rules, especially in patients with indeterminate clinical prediction rule scores. Finally, the utility of even more novel and advanced imaging modalities, such as 3D-MRE,48,49 should be evaluated against that of 2D-MRE and clinical prediction rules for the noninvasive diagnosis of fibrosis in NAFLD patients.
Supplementary Material
Acknowledgments
Funding support: The study was conducted at the Clinical and Translational Research Institute, University of California at San Diego. RL is supported in part by the American Gastroenterological Association (AGA) Foundation – Sucampo – ASP Designated Research Award in Geriatric Gastroenterology and by a T. Franklin Williams Scholarship Award; Funding provided by: Atlantic Philanthropies, Inc, the John A. Hartford Foundation, the Association of Specialty Professors, and the American Gastroenterological Association and grant K23-DK090303. JC is supported by NIH T32 training grant 5TL1TR000098-05. Additional funding provided by R01DK088925 (PI-CS) and NIH grant EB001981 (PI-Ehman).
Role of study sponsor: The study sponsor(s) had no role in the study design, collection, analysis, interpretation of the data, and/or drafting of the manuscript.
Dr. Sirlin consults, advises, and is on the speakers’ bureau for Bayer. He received grants from GE Healthcare.
Abbreviations
- NAFLD
nonalcoholic fatty liver disease
- NASH
nonalcoholic steatohepatitis (
- CPR
clinical prediction rule
- APRI
AST to platelet ratio index
- AST
ALT, diabetes (BARD) score
- CDS
cirrhosis discriminant score
- MRE
magnetic resonance elastography
- HIV
human immune deficiency
- BMI
body mass index
- AUDIT
Alcohol Use Disorders Identification Test
- ALT
alanine aminotransferase
- AST
aspartate aminotransferase
- GGT
gamma-glutamyl transpeptidase
- HbA1c
hemoglobin A1c
- HOMA
homeostatic model assessment of insulin resistance
- FFA
free fatty acids
- CRP
C-reactive protein
Footnotes
Author contributions:
Jeffrey Cui: study concept and design, analysis and interpretation of data, drafting of the manuscript, critical revision of the manuscript, approved final submission.
Brandon Ang: patient visits, data collection, critical revision of the manuscript, approved final submission.
William Haufe: data collection, imaging analysis, critical revision of the manuscript, approved final submission
Carolyn Hernandez: patient visits, data collection, critical revision of the manuscript, approved final submission.
Elizabeth C. Verna: interpretation of data, critical revision of the manuscript, approved final submission
Claude B. Sirlin: study concept and design, analysis and interpretation of data, drafting of the manuscript, critical revision of the manuscript, obtained funding, study supervision, approved final submission
Rohit Loomba: study concept and design, analysis and interpretation of data, drafting of the manuscript, critical revision of the manuscript, obtained funding, study supervision, approved final submission.
All authors approved the final version of this article.
Potential competing interests:
All authors report that no conflicts of interest exist.
References
- 1.Chalasani N, Younossi Z, Lavine JE, et al. The diagnosis and management of non-alcoholic fatty liver disease: practice guideline by the American Association for the Study of Liver Diseases, American College of Gastroenterology, and the American Gastroenterological Association. Hepatology. 2012;55:2005–2023. doi: 10.1002/hep.25762. [DOI] [PubMed] [Google Scholar]
- 2.Loomba R, Sanyal AJ. The global NAFLD epidemic. Nat Rev Gastroenterol Hepatol. 2013;10:686–690. doi: 10.1038/nrgastro.2013.171. [DOI] [PubMed] [Google Scholar]
- 3.Williams CD, Stengel J, Asike MI, et al. Prevalence of nonalcoholic fatty liver disease and nonalcoholic steatohepatitis among a largely middle-aged population utilizing ultrasound and liver biopsy: a prospective study. Gastroenterology. 2011;140:124–131. doi: 10.1053/j.gastro.2010.09.038. [DOI] [PubMed] [Google Scholar]
- 4.Targher G, Day CP, Bonora E. Risk of cardiovascular disease in patients with nonalcoholic fatty liver disease. N Engl J Med. 2010;363:1341–1350. doi: 10.1056/NEJMra0912063. [DOI] [PubMed] [Google Scholar]
- 5.Loomba R, Abraham M, Unalp A, et al. Association between diabetes, family history of diabetes, and risk of nonalcoholic steatohepatitis and fibrosis. Hepatology. 2012;56:943–951. doi: 10.1002/hep.25772. [DOI] [PMC free article] [PubMed] [Google Scholar]
- 6.Williamson RM, Price JF, Glancy S, et al. Prevalence of and risk factors for hepatic steatosis and nonalcoholic fatty liver disease in people with type 2 diabetes: the Edinburgh type 2 diabetes study. Diabetes Care. 2011;34:1139–1144. doi: 10.2337/dc10-2229. [DOI] [PMC free article] [PubMed] [Google Scholar]
- 7.Browning JD, Szczepaniak LS, Dobbins R, et al. Prevalence of hepatic steatosis in an urban population in the United States: impact of ethnicity. Hepatology. 2004;40:1387–1395. doi: 10.1002/hep.20466. [DOI] [PubMed] [Google Scholar]
- 8.Arulanandan A, Ang B, Bettencourt R, et al. Association between quantity of liver fat and cardiovascular risk in patients with nonalcoholic fatty liver disease independent of nonalcoholic steatohepatitis. Clin Gastroenterol Hepatol. 2015 Feb 3; doi: 10.1016/j.cgh.2015.01.027. Epub ahead of print. [DOI] [PubMed] [Google Scholar]
- 9.Zarrinpar A, Loomba R. Systemic review: the emerging interplay between bile acids, gastrointestinal tract, and incretins in the pathogenesis of diabetes and nonalcoholic fatty liver disease. Aliment Pharmacol Ther. 2012;36(10):909–921. doi: 10.1111/apt.12084. [DOI] [PMC free article] [PubMed] [Google Scholar]
- 10.Angulo P, Keach JC, Batts KP, et al. Independent predictors of liver fibrosis in patients with nonalcoholic steatohepatitis. Hepatology. 1999;30:1356–1362. doi: 10.1002/hep.510300604. [DOI] [PubMed] [Google Scholar]
- 11.Adams LA, Lymp JF, St Sauver J, et al. The natural history of nonalcoholic fatty liver disease: a population-based cohort study. Gastroenterology. 2005;129:113–121. doi: 10.1053/j.gastro.2005.04.014. [DOI] [PubMed] [Google Scholar]
- 12.Udell JA, Wang CS, Tinmouth J, et al. Does this patient with liver disease have cirrhosis? JAMA. 2012;307(8):832–842. doi: 10.1001/jama.2012.186. [DOI] [PubMed] [Google Scholar]
- 13.Ekstedt M, Franzen LE, Mathiesen UL, et al. Long-term follow-up of patients with NAFLD and elevated liver enzymes. Hepatology. 2006;44:865–873. doi: 10.1002/hep.21327. [DOI] [PubMed] [Google Scholar]
- 14.Guzman G, Brunt EM, Petrovic LM, et al. Does nonalcoholic fatty liver disease predispose patients to hepatocellular carcinoma in the absence of cirrhosis? Arch Pathol Lab Med. 2008;132:1761–1766. doi: 10.5858/132.11.1761. [DOI] [PubMed] [Google Scholar]
- 15.Matteoni CA, Younossi ZM, Gramlich T, et al. Nonalcoholic fatty liver disease: a spectrum of clinical and pathological severity. Gastroenterology. 1999;116:1413–1419. doi: 10.1016/s0016-5085(99)70506-8. [DOI] [PubMed] [Google Scholar]
- 16.Ratziu V, Charlotte F, Heurtier A, et al. Sampling variability of liver biopsy in nonalcoholic fatty liver disease. Gastroenterology. 2005;128:1898–1906. doi: 10.1053/j.gastro.2005.03.084. [DOI] [PubMed] [Google Scholar]
- 17.Angulo P, Hui JM, Marchesini G, et al. The NAFLD fibrosis score: a noninvasive system that identifies liver fibrosis in patients with NAFLD. Hepatology. 2007;45:846–854. doi: 10.1002/hep.21496. [DOI] [PubMed] [Google Scholar]
- 18.Harrison SA, Oliver D, Arnold HL, et al. Development and validation of a simple NAFLD clinical scoring system for identifying patients without advanced fibrosis. Gut. 2008;57:1441–1447. doi: 10.1136/gut.2007.146019. [DOI] [PubMed] [Google Scholar]
- 19.Williams AL, Hoofnagle JH. Ratio of serum aspartate to alanine aminotransferase in chronic hepatitis. Relationship to cirrhosis. Gastroenterology. 1998;95(3):734–739. doi: 10.1016/s0016-5085(88)80022-2. [DOI] [PubMed] [Google Scholar]
- 20.Sterling RK, Lissen E, Clumeck N, et al. Development of a simple noninvasive index to predict significant fibrosis in patients with HIV/HCV coinfection. Hepatology. 2006;43:1317–1325. doi: 10.1002/hep.21178. [DOI] [PubMed] [Google Scholar]
- 21.Wai C, Greenson JK, Fontana RJ, et al. A simple noninvasive index can predict both significant fibrosis and cirrhosis in patients with chronic hepatitis C. Hepatology. 2003;28:518–526. doi: 10.1053/jhep.2003.50346. [DOI] [PubMed] [Google Scholar]
- 22.Shah AG, Lydecker A, Murray K, et al. Comparison of noninvasive markers of fibrosis in patients with nonalcoholic fatty liver disease. Clin Gastroenterol Hepatol. 2009;7:1104–1112. doi: 10.1016/j.cgh.2009.05.033. [DOI] [PMC free article] [PubMed] [Google Scholar]
- 23.McPherson S, Stewart SF, Henderson E, et al. Simple non-invasive fibrosis scoring systems can reliably exclude advanced fibrosis in patients with non-alcoholic fatty liver disease. Gut. 2010;59:1265–1269. doi: 10.1136/gut.2010.216077. [DOI] [PubMed] [Google Scholar]
- 24.Adams LA, George J, Bugianesi E, et al. Complex non-invasive fibrosis models are more accurate than simple models in non-alcoholic fatty liver disease. J Gastroenterol Hepatol. 2011 Oct;26(10):1536–1543. doi: 10.1111/j.1440-1746.2011.06774.x. [DOI] [PubMed] [Google Scholar]
- 25.Festi D, Schiumerini L, Marzi A, et al. Review article: the diagnosis of non-alcoholic fatty liver disease – availability and accuracy of non-invasive methods. Aliment Pharmacol Ther. 2013 Feb;37(4):392–400. doi: 10.1111/apt.12186. [DOI] [PubMed] [Google Scholar]
- 26.Loomba R, Wolfson T, Ang B, et al. Magnetic resonance elastography predicts advanced fibrosis in patients with nonalcoholic fatty liver disease: a prospective study. Hepatology. 2014;60(6):1920–1928. doi: 10.1002/hep.27362. [DOI] [PMC free article] [PubMed] [Google Scholar]
- 27.Kim D, Kim WR, Talwalkar JA, et al. Advanced fibrosis in nonalcoholic fatty liver disease: noninvasive assessment with MR elastography. Radiology. 2013;268(2):411–419. doi: 10.1148/radiol.13121193. [DOI] [PMC free article] [PubMed] [Google Scholar]
- 28.Bonacini M, Hadi G, Govindarajan S, et al. Utility of a discriminant score for diagnosing advanced fibrosis or cirrhosis in patients with chronic hepatitis C virus infection. Am J Gastroenterol. 1997;92(8):1302–1304. [PubMed] [Google Scholar]
- 29.Lok ASF, Ghany MG, Goodman ZD, et al. Predicting cirrhosis in patients with hepatitis C based on standard laboratory tests: results of the HALT-C cohort. Hepatology. 2005;42:282–292. doi: 10.1002/hep.20772. [DOI] [PubMed] [Google Scholar]
- 30.Neuschwander-Tetri BA, Clark JM, Bass NM, et al. Clinical, laboratory, and histological associations in adults with nonalcoholic fatty liver disease. Hepatology. 2010;52:913–924. doi: 10.1002/hep.23784. [DOI] [PMC free article] [PubMed] [Google Scholar]
- 31.Le Thuy-Anh, Chen J, Changchien C, et al. effect of colesevelam on liver fat quantified by magnetic resonance in nonalcoholic steatohepatitis: a randomized controlled trial. Hepatology. 2012;56:922–932. doi: 10.1002/hep.25731. [DOI] [PMC free article] [PubMed] [Google Scholar]
- 32.Loomba R, Sirlin CB, Ang B, et al. Ezetimibe for the treatment of nonalcoholic steatohepatitis: assessment by novel MRI and MRE in a randomized trial (MOZART Trial) Hepatology. 2014 Dec 6; doi: 10.1002/hep.27647. Epub ahead of print. [DOI] [PMC free article] [PubMed] [Google Scholar]
- 33.Neuschwander-Tetri BA, Loomba R, Sanyal AJ, et al. Farnesoid X nuclear receptor ligand obeticholic acid for non-cirrhotic, non-alcoholic steatohepatitis (FLINT): a multicenter, randomized, placebo-controlled trial. Lancet. 2014 Nov 7; doi: 10.1016/S0140-6736(14)61933-4. Epub ahead of print. [DOI] [PMC free article] [PubMed] [Google Scholar]
- 34.Patel NS, Peterson MR, Brenner DA, et al. Association between novel MRI-estimated pancreatic fat and liver histology-determined steatosis and fibrosis in nonalcoholic fatty liver disease. Aliment Pharmacol Ther. 2013;37(62):630–639. doi: 10.1111/apt.12237. [DOI] [PMC free article] [PubMed] [Google Scholar]
- 35.Lin SC, Heba E, Wolfson T, et al. Noninvasive diagnosis of nonalcoholic fatty liver disease and quantification of liver fat using a new quantitative ultrasound technique. Clin Gastroenterol Hepatol. 2014 Dec 3; doi: 10.1016/j.cgh.2014.11.027. Epub ahead of print. [DOI] [PMC free article] [PubMed] [Google Scholar]
- 36.Kleiner DE, Brunt EM, Van Natta M, et al. Design and validation of a histological scoring system for nonalcoholic fatty liver disease. Hepatology. 2005;41:1313–1321. doi: 10.1002/hep.20701. [DOI] [PubMed] [Google Scholar]
- 37.Matthews DR, Hosker JP, Rudenski AS, et al. Homeostasis model assessment: insulin resistance and beta-cell function from fasting plasma glucose and insulin concentrations in man. Diabetologia. 1985;28(7):412–419. doi: 10.1007/BF00280883. [DOI] [PubMed] [Google Scholar]
- 38.Alberti KG, Zimmet P, Shaw J. Metabolic syndrome – a new world-wide definition. A consensus statement from the International Diabetes Federation. Diabet Med. 2006;23(5):469–480. doi: 10.1111/j.1464-5491.2006.01858.x. [DOI] [PubMed] [Google Scholar]
- 39.Yin M, Talwalkar JA, Glaser KJ, et al. Assessment of hepatic fibrosis with magnetic resonance elastography. Clin Gastroenterol Hepatol. 2007;5:1207–1213. e2. doi: 10.1016/j.cgh.2007.06.012. [DOI] [PMC free article] [PubMed] [Google Scholar]
- 40.Chen J, Talwalkar JA, Yin M, et al. Early detection of nonalcoholic steatohepatitis in patients with nonalcoholic fatty liver disease by using MR elastography. Radiology. 2011;259:749–756. doi: 10.1148/radiol.11101942. [DOI] [PMC free article] [PubMed] [Google Scholar]
- 41.Venkatesh SK, Yin M, Ehman RL. Magnetic resonance elastography of liver: technique, analysis, and clinical applications. J Magn Reson Imaging. 2013;37:544–555. doi: 10.1002/jmri.23731. [DOI] [PMC free article] [PubMed] [Google Scholar]
- 42.Permutt Z, Le TA, Peterson MR, et al. Correlation between liver histology and novel magnetic resonance imaging in adult patients with non-alcoholic fatty liver disease - MRI accurately quantifies hepatic steatosis in NAFLD. Aliment Pharmacol Ther. 2012;36:22–29. doi: 10.1111/j.1365-2036.2012.05121.x. [DOI] [PMC free article] [PubMed] [Google Scholar]
- 43.Noureddin M, Lam J, Peterson MR, et al. Utility of magnetic resonance imaging versus histology for quantifying changes in liver fat in nonalcoholic fatty liver disease trials. Hepatology. 2013;58:1930–1940. doi: 10.1002/hep.26455. [DOI] [PMC free article] [PubMed] [Google Scholar]
- 44.Xavier R, Turck N, Hainard A, et al. pROC: an open-source package for R and S+ to analyze and compare ROC curves”. BMC Bioinformatics. 2011;12:77. doi: 10.1186/1471-2105-12-77. [DOI] [PMC free article] [PubMed] [Google Scholar]
- 45.Sing T, Sander O, Beerenwinkel N, et al. ROCR: visualizing classifier performance in R. Bioinformatics. 2005;21(20):7881. doi: 10.1093/bioinformatics/bti623. [DOI] [PubMed] [Google Scholar]
- 46.DeLong ER, Delong EM, Clarke-Pearson DL. Comparing the areas under two or more correlated receiver operating characteristic curves: a nonparametric approach. Biometrics. 1988;44(3):837–845. [PubMed] [Google Scholar]
- 47.Vodkin I, Valasek MA, Bettencourt R, et al. Clinical, biochemical and histological differences between HIV-associated NAFLD and primary NAFLD: a case-control study. Aliment Pharmacol Ther. 2015;41:368–378. doi: 10.1111/apt.13052. [DOI] [PubMed] [Google Scholar]
- 48.Venkatesh SK, Yin M, Ehman RL. Magnetic resonance elastography of the liver: clinical applications. J Comput Assist Tomogr. 2013;37:887–896. doi: 10.1097/RCT.0000000000000032. [DOI] [PMC free article] [PubMed] [Google Scholar]
- 49.Loomba R, Cui J, Wolfson T, et al. 3D magnetic resonance elastography is superior to 2D magnetic resonance elastography for advanced fibrosis diagnosis in patients with NAFLD. Poster presentation at AASLD. 2014 [Google Scholar]
Associated Data
This section collects any data citations, data availability statements, or supplementary materials included in this article.