

Abstract
Natural environments are complex, and a single choice can lead to multiple outcomes. Agents should learn which outcomes are due to their choices and therefore relevant for future decisions and which are stochastic in ways common to all choices and therefore irrelevant for future decisions between options. We designed an experiment in which human participants learned the varying reward and effort magnitudes of two options and repeatedly chose between them. The reward associated with a choice was randomly real or hypothetical (i.e., participants only sometimes received the reward magnitude associated with the chosen option). The real/hypothetical nature of the reward on any one trial was, however, irrelevant for learning the longer-term values of the choices, and participants ought to have only focused on the informational content of the outcome and disregarded whether it was a real or hypothetical reward. However, we found that participants showed an irrational choice bias, preferring choices that had previously led, by chance, to a real reward in the last trial. Amygdala and ventromedial prefrontal activity was related to the way in which participants' choices were biased by real reward receipt. By contrast, activity in dorsal anterior cingulate cortex, frontal operculum/anterior insula, and especially lateral anterior prefrontal cortex was related to the degree to which participants resisted this bias and chose effectively in a manner guided by aspects of outcomes that had real and more sustained relationships with particular choices, suppressing irrelevant reward information for more optimal learning and decision making.
SIGNIFICANCE STATEMENT In complex natural environments, a single choice can lead to multiple outcomes. Human agents should only learn from outcomes that are due to their choices, not from outcomes without such a relationship. We designed an experiment to measure learning about reward and effort magnitudes in an environment in which other features of the outcome were random and had no relationship with choice. We found that, although people could learn about reward magnitudes, they nevertheless were irrationally biased toward repeating certain choices as a function of the presence or absence of random reward features. Activity in different brain regions in the prefrontal cortex either reflected the bias or reflected resistance to the bias.
Keywords: effort, frontal pole, hypothetical, learning, reward, vmPFC
Introduction
The environments in which animals and humans live are complex. Thus, to make the best decisions, agents must learn which choices are associated with good or bad outcomes, such as monetary rewards, or effort. They must then integrate information about these qualitatively different types of outcomes to make choices (Walton et al., 2002, 2003; Rudebeck et al., 2006; Pessiglione et al., 2007; Croxson et al., 2009; Prévost et al., 2010). Outcomes may, however, have informational content that is independent of whether or not they are immediately rewarding. Imagine an animal foraging for berries on the higher branches of a tree after a strenuous climb. The animal tries to learn how many berries the tree carries to know whether to come back again. On a specific day, the weather may be good and the animal is able to gather a lot of berries from the tree, whereas on another day the weather may be bad and it has to abandon its food gathering prematurely. Despite not collecting any rewards, when learning about how good the tree is, it should only take into account how much food it saw hanging on the tree (this is the informational content of the outcome), but not how much food it managed to gather (this is the rewarding aspect of the outcome) on that day as that could depend on other interfering factors (such as the weather) and not the tree's value itself. In other words, sometimes the rewarding content (i.e., whether the berry reward was really experienced or only hypothetical) is a bad guide for future choices, which should be based on more abstract informational content.
In short, we tried to tackle the fundamental problem of how contingencies are learned when an outcome has, as is commonly the case, multiple components only some of which should be learned. How does information in the irrelevant dimension (in our experiment, this was the outcome's reward content) interfere with the learning of a contingency in the relevant dimension (in our experiment, this was the outcome's informational content)? Because many brain systems are extremely sensitive to obtaining a reward (Vickery et al., 2011), we examined here whether this prominence of reward signals in some areas might bias behavior and hamper learning based on the informational content of the outcome. More importantly, we wanted to also test whether neural systems exist to counteract such biases. One region potentially equipped to contextualize reward appropriately is anterior prefrontal cortex (aPFC) because it has been implicated in complex behaviors, such as pursuing alternative, hypothetical, and potentially novel future courses of action (Boorman et al., 2009; Donoso et al., 2014; Kolling et al., 2014).
We recorded brain activity using fMRI while participants learned the reward and effort magnitudes of two options and chose between them. Crucially, they only sometimes received the rewards associated with the option chosen. They were, however, always shown the associated reward magnitude regardless of whether the rewards were really received or hypothetical (i.e., the outcome's informational content was always provided even if the reward content was not). Thus, whether a reward was real or hypothetical was incidental and should not have affected participants' future choices, as the information needed for learning was the same in both conditions. Nonetheless, participants were biased toward repeating choices that led to real rewards. Ventromedial prefrontal cortex (vmPFC) and amygdala activity was related to this bias. aPFC, frontal operculum/anterior insula (FO/AI), and dorsal anterior cingulate cortex (dACC) activity appeared to counteract such biases in several ways and mediated more flexible and optimal decision-making. Because only rewards, not effort costs, were real or hypothetical, we were furthermore able to test whether only reward signals or instead the relative value of repeating a choice was changed when rewards remained hypothetical (see Materials and Methods). Not receiving a real reward had profound effects not only on the neural representation of rewards themselves, but also on representations of effort costs.
Materials and Methods
Participants
A total of 21 healthy participants (age 19–29 years, 10 female) took part in the study. The study was approved by the local ethics committee. One participant was excluded from data analysis because he/she repeatedly fell asleep during the MRI scan. Fourteen of the participants had taken daily placebo capsules for 2 weeks as part of another study.
Task
We designed a task to assess whether reward experience, more specifically whether a reward was really received or only hypothetical, changed decision-making even when the real/hypothetical nature of the outcome was an incidental feature of all choice outcomes. For this purpose, participants performed a learning task. They made repeated choices between two options with the aim of maximizing their monetary pay-off and minimizing the effort they needed to exert in an interleaved “effort phase” (Fig. 1). On each trial, there were three phases: first, participants chose between two options (“choice phase”); then they were shown the outcome of their choice (“outcome phase”); and then they had to exert the effort associated with the option they had chosen (“effort phase”).
Figure 1.
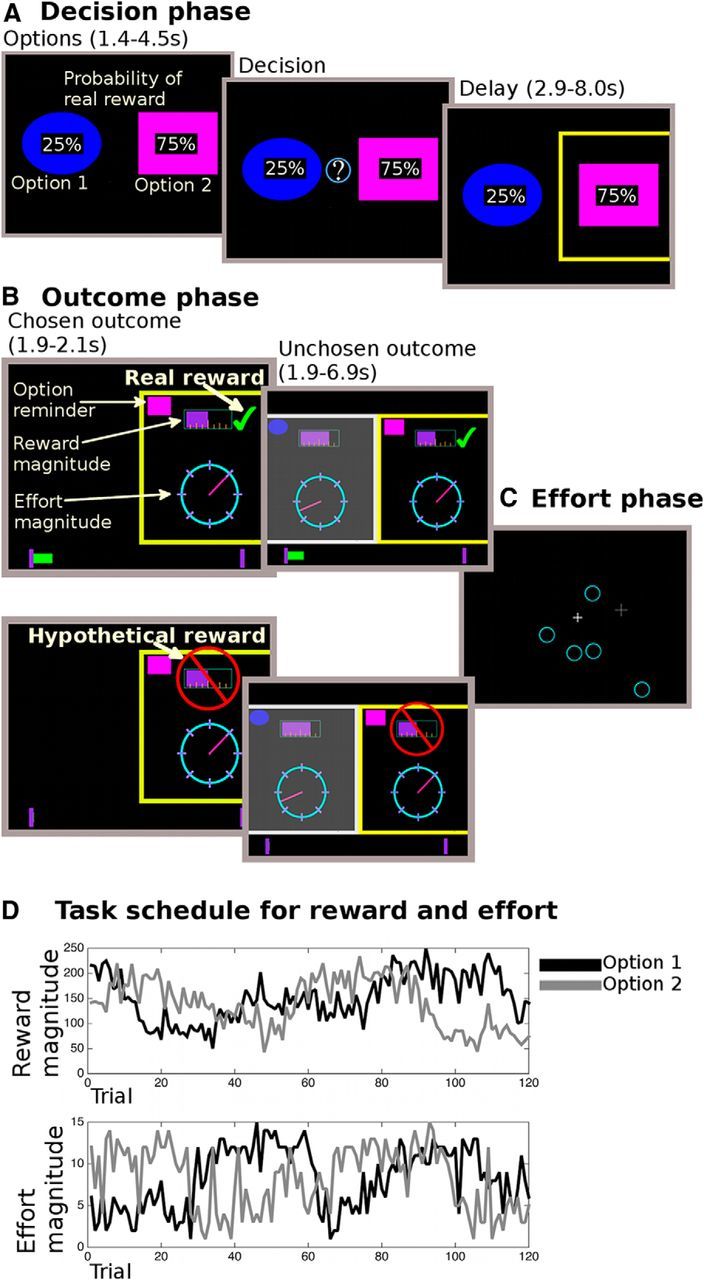
Task description. A, In the decision phase, participants were shown two options (i.e., choices), overlaid with the probability of receiving a reward for each choice. They could only decide after an initial monitoring phase (1.4–4.5 s). The chosen option was then highlighted for 2.9–8 s. B, In the following outcome phase, participants saw the outcome for the chosen option first (1.9–2.1 s). The reward magnitude was shown as a purple bar (top of the screen); the effort magnitude was indicated through the position of a dial on a circle. Whether they received a reward was indicated by a tick mark (real reward, top display) or a red crossed-out sign over the reward magnitude (hypothetical reward, bottom display). If a reward was real, the reward was also added to a status bar at the bottom of the screen, which tracked rewards over the course of the experiment. A reminder of what option they had chosen was shown at the top of the screen. Then the reward and effort magnitudes were shown for the unchosen option (1.9–6.9 s). Finally, participants performed the effort phase (C) where the number of targets was equivalent to the chosen effort outcome. Importantly, participants had to perform the effort phase on every trial, independent of whether the reward was real or hypothetical. An example schedule is shown in D, with both the reward and effort magnitude values of the two choices.
In the decision phase (Fig. 1A), participants chose between two options using buttons on a trackball mouse. Each option had three independent attributes: a reward magnitude (reward points, later translated into monetary pay-off), an effort magnitude (amount of effort required in the effort phase), and a probability of being rewarded. The probability of each option was shown explicitly on the screen at the time of choice. In contrast, the reward and effort magnitudes of the options were not explicitly instructed; and instead, participants had to learn and track these slowly changing features of the two choices across trials. These magnitudes were drawn from normal distributions of which the means fluctuated pseudorandomly and independently over the course of the experiment between three levels (low, mid, high; Figure 1D). Participants were instructed to learn and keep track of the changing mean value of each magnitude across the experiment. Thus, the reward magnitudes of the choices constituted the only relevant reward information that could be tracked and learned, whereas the actual reward receipt (whether the reward was real or hypothetical) or the probability thereof should not have had any bearing on future decisions. Only one of the reward or effort magnitude means was drifting at any one time, and each of the four magnitudes was at each mean level equally often.
After the participants had selected an option, it was highlighted until the ensuing outcome phase. In the outcome phase (Fig. 1B), participants were first shown the reward and effort magnitudes of the option they had chosen, as well as whether they received a reward or not (in other words, whether the outcome was a real secondary reinforcer indicating a specific monetary payment or hypothetical). If they received a reward, the current trial's chosen reward magnitude was added to their total reward accumulated so far (Fig. 1B, on the bottom of the screen). They were then shown the reward and effort magnitudes for the option they had not chosen. During the outcome phase, participants could thus use the displayed information to update their estimates of the reward and effort magnitudes associated with the choices. Importantly, while they were shown whether they received a real reward or not, this should be irrelevant for their future choices as the informational content was the same. This is because how likely any choice was to be rewarded only depended on the probabilities that were explicitly cued at the time of choice and these probabilities changed randomly from trial to trial. In other words, whether an option choice was likely to lead to a real or a hypothetical reward was not a feature of the choice that was sustained across trials or which differentiated it from the other choice, and participants were made aware of this.
Finally, independently of whether the reward was real or hypothetical, participants had to perform the effort phase of the trial (Fig. 1C). Rather than simply exerting a brief force as in some studies of effort, here participants had to exert a sustained effort (Salamone et al., 1994, 2003; Walton et al., 2002, 2003, 2006; Rudebeck et al., 2006; Croxson et al., 2009; Kurniawan et al., 2013) by selecting circles that appeared on the screen using the trackball mouse. The circles were added to random positions on the screen in threes every 3 s (up to a total equal to the chosen effort magnitude). To make the task more effortful, a random jitter (5 pixels, total screen size was 1280 × 800 pixels) was added to the mouse movement, and circles only had a 70% probability of disappearing when clicked on. Furthermore, we prescreened participants and only invited participants for the fMRI session if they had perceived the effort as aversive and were willing to trade-off money to reduce the effort that they needed to exert.
Participants had 25 s to complete the clicking phase and otherwise lost money equivalent to the potential reward magnitude of the chosen option (1 ± 0.3% of trials inside the scanner and 0.1 ± 0.0% outside the scanner). Thus, the amount that could be lost was also independent of whether the reward had been real or hypothetical.
On most trials (100 of 120), participants had to chose between the two options with changing reward and effort magnitudes. The reward magnitudes were set between 0 and 20 pence, and the effort magnitudes were set between 0 and 15 circles that needed to be clicked. On the remaining trials (special option trials [SOTs]), participants had to choose between one of the changing options and one of two fixed options whose values participants learned in a training session outside the scanner. The value of both fixed options was 7.5 pence, but one had a fixed effort magnitude of 4 circles and the other had one of 12 circles. The SOTs were included to ensure that participants learned the values of each choice, rather than just their preference for one option over the other (a relative preference for one option over the other would not enable participants to choose effectively on the SOTs).
To summarize, participants needed to learn both the reward and effort magnitudes of the two options. Independent of these learned quantities, they were only rewarded on some trials, meaning that the reward magnitude was sometimes real and sometimes hypothetical. In contrast, the effort needed to be exerted on every trial. The inclusion of the effort dimension was crucial for arbitrating between different interpretations of our neural results (see “aPFC and FO/AI effort cost and reward outcome representations change when the reward is real as opposed to hypothetical”, below). In short, it allowed us to disentangle whether areas only signaled rewards when they were real or whether they actually carried a signal in favor of switching to the alternative option that was enhanced when rewards were hypothetical. This signal was important because it appeared to allow participants to overcome a bias to stay (i.e., making the same choices) when the outcome was a real reward as opposed to an equally informative, but only hypothetically rewarding, outcome.
Participants performed 120 trials of the learning task inside the scanner and an additional 120 trials afterward on the next day outside the scanner to increase the number of trials for the behavioral data analysis. Each participant performed the same two schedules in randomized order. Participants were informed about the features of the task in two training sessions before the scan, including the fixed number of trials they would perform. This ensured that they did not perceive low-effort options as having a potentially higher monetary value because taking them might allow participants to move on to the next trial more quickly and to perform more trials with more chances to win money. Further details of the training were as follows: In the first training session (45 min), participants performed a version of the task without a learning component (i.e., not only the probability, but also reward and effort magnitudes were explicitly shown). This training ensured that participants were familiar with the features of the task, for example, that they understood what the probability information meant. We also used this session to exclude participants before the fMRI session that did not find the effort sufficiently aversive to produce robust effects on behavior. In a second training session (1 h), we instructed participants about the learning task that they later performed in the fMRI scanner. At the end of the training, participants were queried about how they made decisions (specifically, they were asked “What are you thinking about when you're making your decision”). All participants reported trying to learn the reward and effort magnitudes and using the explicitly cued probabilities to make decisions. No participants reported using information about whether reward had been real or hypothetical on the last trial when making choices. This suggested that participants were well aware of how to do the task before the beginning of the scan. If anything, these thorough instructions should bias participants to try to counteract any tendencies they might have to repeat choices based on receiving real rewards.
Interspersed with the 120 learning trials, there were 20 trials on which participants just had to indicate which option had a higher mean effort magnitude. These trials were included to ensure participants paid attention to the effort dimension. They were not given feedback about those choices. These trials were not included in the data analysis.
Experiment timings.
The options were displayed for 1.4–4.5 s before participants could make a choice. After the choice was made, the chosen option was highlighted for 2.9–8.0 s. Next, the outcome was first displayed for the chosen option (1.9–2.1 s), then for the unchosen option (1.9–6.9 s). Participants then performed the effort exertion task (0–25 s). Finally, the trial ended with an ITI (2.3–7.5 s). The delays used ensured that we could examine the brain activity in the different phases of the task separately. There were no confounds between the brain activations in decision, outcome, or effort exertion phase. All durations were drawn from Poisson-like distributions to increase design efficiency by having some long delays.
Behavioral analysis
In the behavioral analyses, we tested what information, both relevant and irrelevant for choice valuation, had an impact on decisions. We were, however, most interested in whether a reward being real or hypothetical influenced subsequent decisions. More specifically, we tested first whether having received a real or hypothetical reward on the last trial would affect decisions on the next trial. The last trial's reward type (real vs hypothetical) might imbue the option it was associated with (i.e., the chosen option) with positive (or negative, when no reward was received) affect. This would then make participants more likely to select that option again or more frequently. Additionally, we tested whether the reward type (real vs hypothetical) changed how participants exerted effort in the subsequent effort phase of each trial.
All analyses were performed in MATLAB (The MathWorks) and SPSS. When assumptions about statistical tests were violated, we used the Greenhouse-Geisser correction (for sphericity violations of ANOVA) or nonparametric Wilcoxon signed rank test (for violation of normality of t tests).
Decision-making effects of real versus hypothetical reward.
First, we performed analyses to establish that participants learned the reward and effort magnitudes in the task. We ran a logistic regression analysis predicting whether participants stayed with the same choice as made on the previous trial (chose it again on the current trial) or switched to the other option, based on the options' current reward probabilities (as already noted, these were explicitly indicated on each trial; and because they varied randomly from trial to trial, they could not be learned) and the reward magnitude outcomes and effort magnitude outcomes associated with the previous three trials. We also included a regressor denoting the last trial's reward type (real vs hypothetical). This last regressor was our main focus of interest; it allowed us to test whether an aspect of the outcome that should have been irrelevant for learning-biased decisions. All regressors, except the reward type (real vs hypothetical), were coded as relative value differences (reward or effort magnitudes or probabilities) between the stay and the switch choice.
The multiple logistic regression was run in MATLAB using glmfit, with a logit link function as the choice (stay or switch) being predicted was categorical. All regressors were normalized (as in all subsequent behavioral and fMRI regression analyses). For each participant, we obtained one β regression weight for each regressor. These were then tested for statistical significance across all participants.
For the analysis of the decisions, we excluded choices on the SOTs (i.e., trials in which decisions were not between the usual two options, making it impossible to classify those choices into stays and switches in the usual way). On the trials after the SOTs, stay or switch was coded with respect to the trials before the SOTs, in which the two usual options were present.
Computational modeling of the decision behavior.
To look at the reward-type-induced decision bias in more detail and test between different potential underlying mechanisms, we fitted different learning models to the behavioral data. Each model consisted of three main components. First, each model had estimates about the mean reward and effort magnitudes of each option. These were updated on every trial using a reinforcement-learning algorithm. Second, the magnitude estimates were integrated with the explicitly cued probabilities to calculate how valuable each of the two options was (i.e., their utility). Third, these two utilities were compared with each other to predict participants' choices.
Our main question of interest was how reward type (real vs hypothetical) influenced the decision making based on the learned information. To assess this, we first determined the best simple model using model comparison (see below). Next, we modified this simple model to test different hypotheses of how reward type could influence decisions. Comparing the model fits, we tested which hypothesis about underlying cognitive mechanism was best supported by the data.
Best simple model
We first wanted to determine the best simple model to capture participants' behavior before modifying this model to also capture the impact of reward type. For this, we compared several models that differed in how the reward and effort magnitudes were learned and in how reward magnitude and probability were integrated.
For each model, learning was modeled using a standard Rescorla-Wagner reinforcement-learning rule. On each trial, the predicted reward or effort magnitude of an option was updated based on the trial's outcome, as a function of the prediction error (PE) as follows:
 |
where α was the learning rate. Thus, the learning rate was a measure of how much participants updated their magnitude predictions when the outcome differed from their prediction. We fitted models that differed in their number of learning rates: some models used a shared learning rate for reward and effort magnitudes, whereas others used separate learning rates. A last type of model used different learning rates for learning about the reward and effort magnitudes of the option that was chosen and the unchosen option.
The reward and effort magnitude predictions we thus obtained were then integrated together with the probabilities, explicitly shown in the task display, to yield the utility of each option. Based on previous studies (Scholl et al., 2014), we tested different methods for integrating reward magnitude and probability. First, we tested whether they were integrated optimally, that is, multiplicatively (reward magnitude × probability) as follows:
 |
where γ is the effort weighting factor and k is a normalization factor (with k = 1 + γ).
Second, we tested whether instead participants used a heuristic and integrated them as a weighted sum as follows:
where γ is the effort weighting factor, δ is the probability weighting factor, and k is a normalization factor (with k = 1 + γ + δ).
All combinations of the different learning and integration models were fitted (total of four models). All models had in common that the utilities of the two options were compared with each other to predict participants' choices using a standard soft-max decision rule.
 |
where β is the inverse temperature, reflecting a participant's ability to pick the option with higher utility.
To fit the different models, we used hierarchical Bayesian modeling, as implemented in JAGS (Plummer, 2003), which has been widely used previously (Shiffrin et al., 2008; Ahn et al., 2011; Nilsson et al., 2011). The key aspect of this hierarchical modeling approach is that parameter estimates for individual participants are assumed to come from a group-level distribution of those parameters. In other words, the estimates of individual participant parameters are constrained by the parameter estimates at the group level. This approach to model fitting requires the setting of prior distributions of the group-level parameters to be estimated (mean ± SD). These priors are then updated based on Bayes law using Markov Chain Monte Carlo algorithms to obtain posterior distributions of the parameters. For each model, we obtained three chains with 25,000 samples after an initial burn-in of 25,000 samples. We checked for convergence using the JAGS in-built Gelman-Rubin statistic.
We set the priors as follows: the learning rate (α) was constrained to lie between 0 and 1. It was first transformed to a probit scale to facilitate hierarchical modeling (Nilsson et al., 2011). The priors for the mean (before transformation) were drawn from a normal distribution with mean = 0 and variance = 1. The priors of the SD of the group distribution (before transformation) were drawn from a uniform distribution between 0 and 10. The mean of the inverse temperature (β) was constrained to be between 0 and 10, with the precision (1/variance) drawn from a gamma distribution (with parameter settings shape = 0.001, scale = 0.001), which effectively produces a flat prior (Lee and Wagenmakers, 2014). The prior distributions for probability (δ) and effort weighting (γ) parameters were drawn from uniform distributions between 0 and 20, and the precision was again drawn from gamma functions as before. We confirmed after model fitting that none of the parameters that we found lay too close to the boundaries of the priors that we used, ensuring that we were not misestimating the parameters due to incorrect constraints.
To determine which of the models that we fit best explained our data, we used model comparison based on deviance information criterion (DIC) differences (Spiegelhalter et al., 2002). DIC provides a measure of model fit, taking into account both how well the model explains the data and how complex the model is. DIC is a hierarchical modeling generalization of the Akaike information criterion. The smaller the DIC value, the better a model explains the data.
Modeling the effect of reward type
Based on model comparisons of the above named simple models, we determined the best fitting model, which we found to be one based on a common learning rate for reward and effort and a heuristic utility (i.e., a weighted sum of probability, reward and effort magnitudes; see Results).
To assess the behavioral effect of reward type (real vs hypothetical), we then modified this best fitting model in the following three ways. First, we considered that one explanation for a difference in choice after real or hypothetical reward could be that participants only learn from real reward, but not from hypothetical reward (NoLearningHypothetical model). We modeled this by setting the learning rate to 0 for the chosen reward outcome on trials where the reward was hypothetical. In all other instances (i.e., the reward was chosen and real or the reward of the unchosen option or of the effort dimension), we used the same learning rate (α) as follows:
 |
We also tested a version of this hypothesis, in which instead of no learning for hypothetical reward, learning had a different learning rate for hypothetical than real reward (LessLearningHypothetical model).
As a second hypothesis, the difference in choice after real or hypothetical reward could be due to participants perceiving only real reward as rewarding (NoRewardHypothetical model). To test this, we modeled the hypothetical reward as having a reward magnitude of 0. The rest of the model was as before:
 |
We also tested a version of this hypothesis, in which instead of a reward magnitude of 0 when reward was hypothetical, the reward magnitude was scaled by an additional free parameter.
As a third hypothesis, we considered that it is perhaps not the reward magnitudes that are learned differently, but instead, participants might unwittingly be biased toward choices that had led to real reward. In other words, this hypothesizes that participants found receiving a real reward more rewarding than a hypothetical reward and that they were not only influenced by the informational content provided by both real and hypothetical outcomes but that they were also influenced by real reward receipt. In other words, when multiple aspect outcomes are received, participants not only learn choice–outcome contingencies that are relevant to task performance but irrelevant outcome dimensions also affect their learning. This was modeled as a bias term when calculating the utility as follows:
 |
where δ was the probability weighting factor, γ was the effort weighting factor, ε was the reward type (real vs hypothetical) weighting factor, and k was a normalization factor (k = 1 + γ + δ + ε).
We set the prior for the group mean of the weight of reward type (ε) between −10 and 10. This range, including positive and negative values, was chosen so as not, a priori, to bias values to be only positive (as our hypothesis would suggest), but to allow a free fit. We again used a flat distribution for the group SD prior.
To see which of these hypothesis best explained the effects of reward type on decision, we again used model comparison based on DIC.
Effort exertion phase
In the effort phase, participants used a trackball mouse to click on circles appearing on the screen to make them disappear. We recorded every mouse click independently of whether the click made the target disappear or not and whether it was on the circles to be clicked or somewhere else on the screen. Thus, we could measure the clicking rate on each trial, as a proxy for motivation.
Here, we tested, using a regression analysis, whether the reward type (real vs hypothetical) had an impact on how motivated participants were when exerting effort. Thus, the clicking rate on each trial was the dependent variable, and the regressor of interest was whether the reward was real or hypothetical on the current trial (recall that the effort phase of each trial followed the reward outcome phase of each trial). As regressors of no interest, we also included the chosen option's effort magnitude (i.e., the number of targets participants had to click), the unchosen option's effort magnitude, as well as the chosen option's and the unchosen option's reward magnitudes. The regressions were run in MATLAB (glmfit), using a log link function as the clicking rate data were constrained to be >0.
In these analyses, we only included data from the behavioral session outside the scanner as the EPI sequence sometimes affected the reliability of the trackball mouse during the effort exertion phase during the scan. Because of this interference, the clicking performance recorded inside the scanner may not always have been a reliable measure. Of course, this was no problem outside the scanner.
MRI data acquisition
Structural MRI and fMRI measurements were taken using a Siemens 3 tesla MRI scanner. For the fMRI, we used a Deichmann EPI sequence (Deichmann et al., 2003) (TR: 3000 ms; 3 × 3 × 3 mm voxel size; TE: 30 ms; flip angle: 87°; slice angle of 15° with local z-shimming) to minimize signal distortions in orbitofrontal brain areas. This entailed orienting the field of view at ∼30° with respect to the AC-PC line. We acquired between 1100 and 1300 volumes (depending on the time needed to complete the task) of 45 slices per participant. Additionally, for each participant, anatomical images were acquired with a T1-weighted MP-RAGE sequence, using a GRAPPA acceleration factor of 2 (TR: 2200 ms; TE: 4.53 ms; inversion time: 900 ms; voxel size: 1 × 1 × 1 mm on a 176 × 192 × 192 grid) (same protocol as Chau et al., 2014, 2014).
We used Oxford Centre for Functional MRI of the Brain's Software Library (FSL) (Smith et al., 2004) for image preprocessing and analysis. Functional images acquired were first spatially smoothed (Gaussian kernel with 5 mm full-width half-maximum) and temporally high-pass filtered (3 dB cutoff of 100 s). Afterward, the functional data were manually denoised using probabilistic independent component analysis (Beckmann and Smith, 2004), identifying and regressing out obvious noise components (Kelly et al., 2010); we considered only the first 40 components of each participant that had the greatest impact to interfere with task data (total up to 550). We used the Brain Extraction Tool from FSL (Smith, 2002) on the high-resolution structural MRI images to separate brain matter from nonbrain matter. The resulting images guided registration of functional images in MNI space using nonlinear registrations as implemented in FNIRT (Jenkinson et al., 2012). The data were prewhitened before analysis to account for temporal autocorrelations (Woolrich et al., 2001). Statistical analysis was performed at two levels. At the first level, we used an event-related GLM approach for each participant. On the second level, we used Oxford Centre for Functional MRI of the Brain's Local Analysis of Mixed Effects (FLAME 1) (Beckmann et al., 2003) with outlier deweighting and tested the single group average. The main effect images are all cluster-corrected results with the standard threshold of z = 2.3. We also analyzed data in ROIs, extracted from spheres with a 3 voxel radius, identified in MNI standard space on the basis of orthogonal whole-group analyses, or used time courses for illustration purposes only (e.g., Fig. 9).
Figure 9.

Stay and switch signals in the decision phase. A, In the decision phase, in addition to decision signals (shown in Fig. 8), dACC activity decreased when participants chose to stay rather than switch relative to the last trial (blue; i.e., when they chose the same option again as on the last trial). This was independent of whether the reward had been real or hypothetical on the last trial. In contrast, regions including the amygdala (green) differentially activate to whether a trial was a stay or a switch, depending on whether the reward was real or hypothetical on the last trial. All results are cluster-corrected at p < 0.05. B, Specifically, when there had been a real reward on the last trial, the amygdala was more active on stay than on switch trials (purple line). In contrast, when the reward had been hypothetical on the last trial, the amygdala was less active on stay than on switch trials (blue). During decisions, the amygdala's activity was negatively coupled with the aPFC's activity (Ci); a negative correlation between activity in the two regions. This negative coupling was decreased (Cii) on trials when participants made choices that were consistent with the overall bias introduced by the last trial's reward type. *p < 0.05 (two-tailed one-sample test of correlation values).
fMRI analysis
In the fMRI analysis, we investigated the neural underpinnings of the effect of real versus hypothetical rewards on behavior. We looked at these effects at two time points. First, we examined activity at the time when participants made decisions to examine whether brain activity reflected whether the reward had been real or hypothetical on the last trial, as well as whether the real/hypothetical nature of the reward influenced switch-stay signals. The second time point we examined was at the time of the outcome after the decision had been made. At this time point we examined, first, which brain regions were differently active when rewards were real or hypothetical and, second, whether the reward type (real vs hypothetical) changed the sensitivity to the effort and reward magnitude outcomes.
Identifying areas coding real and hypothetical reward and effort in the outcome and decision phases.
In the first design (GLM1), we investigated the neural effect of the reward being real or hypothetical at the time of the decision and at the time of the outcome. Additionally, we looked at how neural activity reflected the other key features of the options, namely, their reward and effort magnitudes and their reward probabilities. The regressors used in this design were as follows (for correlations between the regressors, see Fig. 2A): we used three boxcar regressors, indicating the onset and duration of the decision phase (duration from the beginning of the trial until participants made a choice), the onset and duration of the outcome phase (from the appearance of the chosen outcome until the chosen and the unchosen outcomes were removed again from the screen), and the effort exertion phase (from the appearance of the first target that participants needed to remove until they had removed the last target). We furthermore included the following parametric regressors in the decision phase: whether the reward of the chosen option had been real or hypothetical on the last trial, reward and effort magnitude predictions (derived from a standard Bayesian learning model, similar to that described by Behrens et al., 2007; see below), and the reward probabilities that had been displayed on the screen. In each case, separate regressors for the chosen and the unchosen option were used. None of these regressors were correlated with participants' reaction time, and inclusion of reaction time did not affect the brain signals reported in the decision phase. In the outcome phase, we included the following parametric regressors: the reward type (real vs hypothetical) delivered for the chosen option, the probability of reward for the chosen option, the reward magnitude outcomes, and the effort magnitude outcomes for the chosen and the unchosen option. The onset of the regressors for reward receipt, chosen option reward probability, chosen option reward and effort magnitude outcomes was time-locked to the onset of the outcome phase; the onset and duration of the regressors indexing the reward and effort magnitude outcomes for the unchosen option were time-locked to their display (appearing ∼2 s after the outcomes of the chosen option). In the effort execution phase, we included the clicking rate as a parametric regressor. Finally, we included, as confound regressors, six movement regressors and a regressor indexing when additional visual stimuli were presented to warn participants that they had not clicked the targets on time and that the halfway point of the experiment had been reached.
Figure 2.

Correlations between the regressors included in the fMRI designs. A, Correlations (r values) between regressors in GLM1. The values are the mean of the absolute r values across all participants. No r values exceeded 0.33. B, In GLM2, no r values exceeded 0.38. C, Chosen option; UC, unchosen option; PredRewMag, predicted reward magnitude; PredEffMag, predicted effort magnitude; hypoth., hypothetical outcome; RewMagOutcome/RewMagOutc, reward magnitude outcome; EffMagOutcome/EffMagOutc, effort magnitude outcome. *Events time-locked to the onset of the unchosen option's outcomes appearing on the screen.
We applied a Bayesian learner (similar to the one described by Behrens et al., 2007) to estimate the reward and effort magnitude predictions for each option for the fMRI analysis. We did this to obtain prediction regressors (of effort and reward magnitudes) for the fMRI analysis that could not possibly be biased by model specifications of a fitted model. However, it is of note that the regressors obtained in this way were highly correlated with those from the best fitting simple learning model (r = 0.95). Therefore, we would not expect the fMRI results to differ were we to use those regressors instead. Furthermore, most neural results are completely independent of the model used as we mainly focused on regressors that described model-free quantities (such as the shown probabilities at the time of the decision or the shown reward or effort magnitudes or reward type at the time of the outcome).
In short, the Bayesian model estimated the current reward/effort magnitude predictions based on the previous trials for each of the four magnitudes (option A reward magnitude, option A effort magnitude, option B reward magnitude, option B effort magnitude) separately. It did this by taking into account the following properties of the experimental task: (1) The reward/effort magnitude outcomes were determined by separate underlying reward/effort distributions for each magnitude (normal distributions). (2) The mean of a magnitude distribution could sometimes change. (3) How quickly each mean changed could vary over the course of the experiment. Sometimes, the mean changed more quickly (high volatility), whereas at other times, it changes more slowly (low volatility). (4) The volatility of an attribute was not static but could also change over the course of the experiment. In other words, the parameters that the model estimated on every trial for each attribute were the reward/effort magnitude prediction (mean and variance), the volatility, and the volatility change.
The model estimated these parameters for the current trial based on last trial's parameter likelihoods and the last trial's attribute outcomes. It did this using Bayes' rule, which is the most efficient way for updating beliefs given new evidence. In contrast to the fitted models, this model did not have any free parameters. For details on the specific mathematical implementation of the Bayesian learner, see Behrens et al. (2007). The only noteworthy change compared with Behrens et al. (2007) was that, whereas they tried to predict binary outcomes using a β-distribution, we wanted to predict numerical outcomes using a normal distribution and thus added an additional parameter estimating the width of the normal distribution for the magnitudes.
Relating neural effects of real versus hypothetical reward to behavior.
We also looked for correlations, across participants, between brain representations of reward type (real vs hypothetical) and the behavioral impact the reward type had on stay/switch behavior. For this we included, at the group-level analysis stage of the fMRI data, a covariate denoting for each participant how much reward type on the last trial influenced subsequent stay/switch behavior (GLM2). The covariate was thus the regression β weight from the behavioral analysis described above, for each individual participant, indicating how strongly the last trial's reward type influenced participants' stay/switch decisions. We looked for correlations between this covariate and the brain response to reward type at the time of the outcome phase. To assess whether the regions that we identified in this analysis made shared or independent contributions to the decision bias we also performed follow-up partial correlations. For this we first extracted each individual participant's fMRI contrast of parameter estimates (COPE) values for the contrast of reward type from ROIs placed inside the activation clusters using featquery (FSL). We then correlated the COPE from one region with the decision bias while controlling for the COPE from another region. In this partial correlation analysis, we are interested in whether the correlations in both areas explain at least partially independent variance or not. We tested this using partial correlations and mediator analyses (Sobel test) (Preacher and Hayes, 2004).
Time course analysis: how reward and effort magnitude representations differ for real and hypothetical reward.
Having identified which regions in the outcome phase coded effort and reward magnitudes, we then went on to test whether reward type (real vs hypothetical) had an impact on the coding of reward magnitude and effort magnitude outcomes in these regions. This analysis is orthogonal to the analysis used in initial identification of the ROIs because the difference of the magnitudes in the real versus hypothetical reward conditions is independent of the sum of the two conditions (i.e., the main effect of reward or effort outcomes) that was used to identify the regions. First, we extracted the BOLD signal from these regions. We then up-sampled the time course 10-fold, created epochs from the beginning of the outcome phase onward, and applied a GLM to every time point separately. By averaging the resulting β weights across participants, we created the time courses shown (the SEs of the mean effect across participants are shown). We included as regressors: the relative reward magnitude outcome (chosen − unchosen option) as separate regressors on trials when the reward was real or hypothetical, the relative effort magnitude outcome (chosen − unchosen option), again as separate regressors for when the reward was real or hypothetical, and finally we also included regressors for the main effect of reward type and to denote the expected probability of reward receipt. We statistically compared the reward outcome regressors in the real and hypothetical reward conditions, using two-tailed t tests performed on the time course after hemodynamic convolution. For the hemodynamic convolution, we used a leave-one-out procedure to fit the hemodynamic response function. Specifically, for each participant, we used the data from all but that participant to determine the absolute peak (i.e., either the strongest peak or trough) of the time course in a window between 6 and 12 s. We then aligned the peak of a canonical hemodynamic response function to this peak. The hemodynamic response function was made using gammapdf in MATLAB, with values α = 72/32, β = 7/32. We then convolved the aligned hemodynamic response function with the omitted participant's time course to obtain one value per participant for each regressor of interest.
Stay-switch analysis.
We performed a third whole-brain analysis (GLM3) to assess whether reward type (real vs hypothetical) on the last trial also influenced brain signals directly related to the choice on the current trial, namely, whether on the current trial the same choice was repeated as on the last trial (i.e., a stay decision) or whether the other option was chosen (switch). In other words, we wanted to identify regions that were not just differently affected by receipt of real and hypothetical reward outcomes but that were activated differentially as a result of an interaction between the outcome type and subsequent behavior; we identified brain areas that activated differently when decisions were made in line with the bias suggested by the last trial's reward type (i.e., stay decision after real reward and switch decision after hypothetical reward) or against it (stay decision after hypothetical reward and switch decision after real reward). In GLM3 (for a list of regressor correlations, see Fig. 2B), we included again the same boxcar regressors for the onset and duration of the decision, outcome, and effort exertion phases. We included as our main regressors of interest in the decision phase whether the current trial was a stay or a switch choice but coded separately for instances on which there had been a real or a hypothetical reward on the last trial previous to it. We then looked at whether stay/switch signals were affected by whether the reward was real or hypothetical on the last trial by looking at the difference between these two regressors (stay/switch after real reward − stay/switch after hypothetical reward on the last trial). As confound regressors we included, first, a main effect regressor indicating the reward type on the last trial (regardless of whether the current trial was a stay or a switch decision). Additionally, we also included regressors indexing the predicted reward magnitudes, predicted effort magnitudes, and explicitly shown reward probabilities associated with both the chosen and unchosen options. Each of these quantities was included as separate regressors for when the reward had been real on the last trial and for when it had been hypothetical on the last trial. In the outcome phase, we included, as in GLM1, a regressor indicating current reward type (real vs hypothetical) and what the probability of that reward type had been. Additionally, we included regressors, separately for trials with real or hypothetical reward, for the chosen and the unchosen reward magnitude outcomes and effort magnitude outcomes. The regressors in the effort exertion phase and the other motion confound regressors phase were as in GLM1.
Connectivity analysis.
In the previous analysis (GLM3), we identified regions with activity reflecting the interaction between the decision to stay or switch and the reward type on the last trial. To further examine the relationship between one of those areas (for the sake of simplicity in the description of the analysis procedure, we note here that the region in question was the amygdala, which has previously been implicated in biased decision making) (de Martino et al., 2006; Roiser et al., 2009) and areas that we had identified as opposing biased decision making, we conducted an exploratory analysis of the interactions during task performance. More specifically, we performed a psychophysiological interaction analysis (PPI) (O'Reilly et al., 2012) to determine whether connectivity between those types of region changed as a function of the decision × last reward type interaction effect. We hypothesized, based on previous research (Roiser et al., 2009), that if a region opposes the bias, it could do so partly by suppressing activity in a region, such as the amygdala, that is associated with promoting the bias during the decision. If that were the case, then a decrease in connectivity should be seen on trials when participants ended up making a potentially biased decision. In other words, choices in agreement with last trial's reward bias could be partly due to a failure of the bias-opposing region to suppress the bias-promoting region (the amgydala). To test this hypothesis, we performed a PPI for every time point during the decision phase, equivalent to the other time course analyses. We included as main regressors of interest the time course extracted from the region identified by the bias consistent choice effect in GLM3 and the interaction between this time course and this bias effect. Specifically, the bias consistent choice effect regressor was binary, coding whether decisions were made in line with last trial's reward type (stay after real reward and switch after hypothetical reward) or against it. As usual for a PPI analysis, we included as confound regressors the main effect of the interaction between the current decision and the last trial's reward type, as well as the relative probabilities, reward and effort magnitudes (chosen − unchosen), last trial's reward type, and the global time course (Rogers et al., 2007; Friston et al., 1990).
Results
Decision-making analysis
Participants performed a reward and effort learning task in which they tracked the continuously changing reward and effort magnitude values of two options. The range of reward and effort magnitude differences between the two options and the influence these differences exerted on participants' choices are shown in Figure 3A, B. We found, as predicted, that participants were more likely to select an option associated with a higher expected reward magnitude and a lower expected effort magnitude. To test more formally whether participants learned the changing reward and effort magnitudes, we performed a regression analysis assessing the effect of reward magnitude and effort magnitude outcomes on recent trials and the reward probabilities (which were shown to participants at the time of the choice; Fig. 3C). This analysis demonstrated that participants' decisions to repeat a choice (stay) or select the alternative option (switch) were influenced by the reward probabilities they were shown at the time they made a decision (these varied randomly from trial to trial) and that the history of reward magnitude and effort magnitude outcomes on recent trials (i.e., what should be learned) also influenced whether participants stayed with their previous choice or switched to the alternative. Furthermore, the impact of more recent reward and effort magnitudes was larger than for reward and effort magnitudes received longer ago in the past, as is typically found in a learning task (ANOVA, main effect of time: F(1.4,26.4) = 4.536, p = 0.031).
Figure 3.

Behavioral results. A, Distribution of the Bayesian estimated reward and effort magnitude differences (Option 1 − Option 2) of the two options on the trials used in the task. B, How likely participants were to select one option over the other based on the predicted reward and effort magnitude differences between the options. Decisions were analyzed using a regression analysis (C). Participants were more likely to stay with an option (choose it again) rather than switch to the alternative if the option was associated with a higher displayed probability (“prob”) and higher past (one [t − 1], two [t − 2], or three [t − 3] trials ago) reward and lower past effort magnitudes than the alternative option. Furthermore, participants were more likely to stay if they had received a real rather than a hypothetical reward on the last trial (p = 0.008, highlighted in red). Effort exertion was analyzed using a regression analysis (D) predicting the clicking rate. The regressors were the effort and reward magnitude outcomes, separately for the option participants had chosen (“C”) or not chosen (“UC,” unchosen), and the reward type (i.e., whether the reward was real or hypothetical). Again, participants' behavior was influenced by whether the reward was real or hypothetical (p = 0.039, highlighted in red).
Our main factor of interest in this decision analysis was whether participants' decisions were also influenced by whether the reward had been real or hypothetical on the last trial (reward type). To test this, we also included the last trial's reward type in the regression analysis described above. We found that participants were more likely to repeat a choice (stay) if they had received a real reward on the last trial (Fig. 3C, red bar; z = 2.65, p = 0.008, one-sample Wilcoxon signed rank test). To confirm this result in a simpler way, we divided all trials into two bins: those that occurred after real rewards and those that occurred after hypothetical rewards. We then calculated the percentage of trials for each participant on which they chose the same option again (stay) or selected the other option (switch) after the reward had been real or hypothetical on the last trial. We found, as before, that participants were more likely to stay when the reward had been real rather than hypothetical (z = −3.10, p = 0.002, one-sample Wilcoxon signed rank test).
Computational modeling of the decision behavior
To look at the reward-type-induced decision bias in more detail, we fitted different learning models to the behavioral data. We first fitted five models to the data to determine which model to examine further to assess the effect of reward type (real vs hypothetical). These models differed in the learning and the decision rules used. For each model, we computed the model fit using the DIC. DIC differences between models of 0–5 suggest no evidence in favor of a model, DIC differences of 5–10 suggests mild evidence in favor of a model, and DIC differences >10 suggest strong evidence in favor of a model (Spiegelhalter et al., 2002). The DIC scores are shown in Table 1. A model with a shared learning rate for reward and effort and which integrated reward magnitude and probability in a heuristic manner by linear summation (Addition1α model) showed the best fit (DIC = 2828). This model explained 81% of participants' choices on average. We then analyzed this model further with regard to the mechanism of how reward type could influence decisions. However, we note that the second best model (which used separate learning rates for reward and effort) showed a similar fit, and so we also repeated all the analyses shown below for this alternative model. We do not report these analyses here because the conclusions drawn were identical to those drawn below. It is perhaps worth briefly pointing out that the model with different learning rates for the chosen and the unchosen option (AdditionChosenUnchosenα) also did not provide a better fit to the data than a model with just one learning rate (Addition1α). Therefore, we cannot determine from our data whether the learning occurs separately for each option or for the relative value of the two options.
Table 1.
DIC valuesa
| Model | DIC |
|---|---|
| Simple models | |
| Addition1α | 2828 |
| Addition2α | 2833 |
| AdditionChosenUnchosenα | 2837 |
| Multiplication1α | 4353 |
| Multiplication2α | 4103 |
| Reward-type models (all based on Addition1α) | |
| DecisionBias | 2780 |
| NoLearningHypothetical | 2837 |
| LessLearningHypothetical | 2822 |
| NoRewardHypothetical | 3388 |
| LessRewardHypothetical | 2830 |
aResults of the model fitting analysis. Smaller values indicate a better fit.
Next, we fitted three model types to test different hypotheses of how reward type (real vs hypothetical) could affect decisions (Table 1). The first model type incorporated the hypothesis that reward type changed how participants learn about reward, more specifically whether, as could be expected from some basic reinforcement learning theories, hypothetical reward is not used for learning (NoLearningHypothetical model in table). We found that this model did not provide a better explanation for participants' behavior (DIC = 2837). A variant of this model tested whether, instead of no learning from hypothetical reward, learning from hypothetical reward might be reduced (LessLearningHypothetical model). This model only provided a marginally better fit to the data than the simplest Addition1α model (DIC = 2822).
The second model tested whether hypothetical reward was perceived as nonrewarding (NoRewardHypothetical model in table). Again, this model did not provide a good explanation of participants' behavior (DIC = 3388). A variant of this model tested whether, instead of perceiving hypothetical reward as completely nonrewarding, it might be perceived as somewhat less rewarding (LessRewardHypothetical model). This model did not provide a better fit than the simple Addition1α model (DIC = 2830).
The third model tested whether after receiving a real reward when choosing an option, participants mistakenly perceive the option as having a higher utility and therefore are more likely to select it again (DecisionBias model in table). We found this model to provide the best fit to the data (DIC = 2780). Furthermore, we found that, across participants, reward type had a consistent positive effect (mean = 0.19, 95% confidence interval: 0.01–0.39; Table 2), replicating the result of the regression analysis that participants prefer options that had received a real rather than a hypothetical reward in the past. This suggests that participants can learn from both hypothetical and real reward but that they irrationally behave as if choices that had been associated with a real reward were more valuable to them. The conclusions of this analysis are therefore the same as those drawn from the regression analysis.
Table 2.
Parameters of the DecisionBias modela
| Mean | SE | |
|---|---|---|
| Learning rate (α) | 0.42 | 0.04 |
| Inverse temperature (β) | 3.85 | 0.20 |
| Effort weight (γ) | 1.54 | 0.30 |
| Probability weight (δ) | 1.34 | 0.17 |
| Reward-type weight (ϵ) | 0.19 | 0.06 |
aParameters of the best fitting model incorporating an effect of reward type (DecisionBias model).
It is of note that, although this behavioral modeling is able to tell us that participants are biased toward an option that had been linked to a real reward, it does not distinguish between different possible neural mechanisms that could generate this behavior. In other words, participants could simply have a weak bias or alternatively the bias is due to a competition between a brain mechanism that is biased by real reward (and thus drives the behavior) and another brain mechanism that reflects the true, underlying task structure (i.e., that participants should ignore for future choice whether reward is real or hypothetical). To investigate this question further, we need to interrogate the neural signals.
Effort exertion phase
In the effort exertion phase, we tested for an effect of reward type (real vs hypothetical) on the clicking rate (i.e., on how vigorously participants exerted an effort). A multiple regression analysis (Fig. 3D) revealed that, if the reward were real as opposed to hypothetical, then the clicking rate increased in the subsequent effort exertion phase (t(19) = 2.214, p = 0.039). Thus, this further supports the view that reward type was not ignored by participants but instead affected their decision and effort exertion behavior. The effect is consistent with what would be expected if participants perceived real rewards as more rewarding than hypothetical rewards.
fMRI results
The behavioral modeling was able to tell us that participants were biased toward staying with an option that had been linked to a real reward. However, the behavioral modeling could not distinguish between different possible neural mechanisms that could generate this behavior. For example, the behavioral bias could simply be due to a brain mechanism that is weakly biased toward irrationally repeating a choice after real reward. Alternatively, the behavioral bias could be due to a competition between a brain mechanism that is biased by real reward (and thus drives the behavior) and another brain mechanism with activity that reflects the true task structure (i.e., whether a reward is real or hypothetical should be irrelevant for future choice) and tries to oppose the bias. To investigate this question, we needed to interrogate the neural signals. We reasoned that the effect of reward type might be seen when the outcomes themselves were presented and participants needed to use the reward magnitude and effort magnitude information they received to update their expectations for their next choices. Alternatively, or additionally, an effect of reward type might be seen on the subsequent trial when participants next had to make a decision. Below we first consider reward type effects at the time of outcome processing; and then in a later section, we consider the effects of reward type on subsequent decision-related activity.
Reward magnitude and effort magnitude signals at outcome
When we examined activity during the outcome phase of trials (GLM1; see Materials and Methods), we found that the relative reward magnitude outcome (i.e., the chosen − the unchosen reward magnitude) led to an increase in BOLD activity in the ventral striatum and elsewhere (Fig. 4A, brown; Table 3). There was an analogous effect of relative effort magnitude outcome (the chosen − the unchosen effort magnitude) in FO/AI, ACC, and aPFC (Fig. 4A, red; for a complete list of activations, see Table 3). We did not find any areas that showed a decrease in BOLD with either regressor. We note that we used relative outcome signals, rather than just the chosen outcome, because in our task participants were shown information at outcome about both the chosen and the unchosen options. Therefore, for future decisions, the relevant quantity is how good an option is compared with the other option available. One could consider this quantity to be the relative evidence for switching/staying. However, in control analyses (data not shown), we confirmed that the regions carried signals for both the chosen and the unchosen options separately (with reversed signs). Thus, our data do not speak to the issue of whether learning is about the relative evidence for the chosen versus the unchosen option or occurs separately in relation to the evidence for the chosen option and the unchosen option. Both of these possibilities are compatible with both our fMRI and behavior modeling findings, and further studies are needed to address this specific question.
Figure 4.
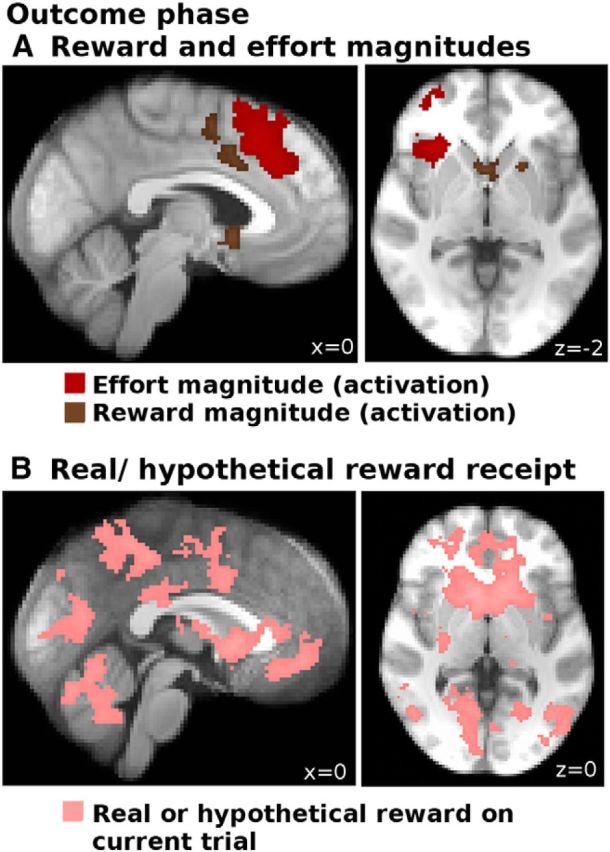
Brain activations in the outcome phase. A, Increases in BOLD activity correlating with the relative effort magnitude outcomes (chosen − unchosen option; red) and relative reward magnitude outcomes (chosen − unchosen option; brown) in the outcome phase. At the same time, whether a reward was real or hypothetical (B) led to widespread increases in BOLD activity throughout the brain (pink). All activations are cluster-corrected at p < 0.05.
Table 3.
Outcome phase (GLM1)a
| x | y | z | Maximum z score | |
|---|---|---|---|---|
| Activations with effort outcome (C − UC) | ||||
| FO/AI | 30 | 24 | −2 | 3.99 |
| Ventral inferior frontal gyrus (44vb) | 46 | 18 | 4 | 3.61 |
| dACC/anterior rostral cingulate zone (RCZa) | 4 | 36 | 32 | 3.65 |
| Pre-SMA | 2 | 18 | 54 | 3.23 |
| Inferior parietal lobule (PFmc), right | 52 | −46 | 40 | 3.46 |
| Inferior parietal lobule, (PFmc), left | −28 | −56 | 46 | 3.33 |
| Area 46/lateral frontal pole (FPl)b, right | 38 | 52 | 8 | 3.40 |
| Dorsolateral prefrontal cortex (area 9/46vd) | 42 | 40 | 22 | 3.30 |
| Activations with reward outcome (C − UC) | ||||
| Supplementary motor area/dACC/posterior rostral cingulate zone (RCZpe) | 2 | 0 | 52 | 3.45 |
| dACC/anterior rostral cingulate zone (RCZa) | 8 | 10 | 38 | 3.27 |
| Inferior parietal lobule (PFopc), left | −50 | −42 | 28 | 3.82 |
| Ventral striatum, left | −12 | 8 | −10 | 4.12 |
| Ventral striatum, right | 10 | 8 | −10 | 3.7 |
| Cluster may extend to subcalloscal cortex | 0 | 10 | −6 | 3.3 |
| Activations with reward type (real/hypothetical) | ||||
| Putamen, right | 14 | 12 | −6 | 5.52 |
| Putamen, left | −18 | 14 | −4 | 4.5 |
| Ventral striatum, left | −10 | 10 | −8 | 5.13 |
| Ventral striatum, right | 6 | 12 | −2 | 4.97 |
| vmPFC | 0 | 48 | −4 | 3.38 |
| Perigenual ACC | −4 | 36 | 8 | 2.65 |
| Dorsal thalamus (extending to pulvinar), right | 6 | −18 | 14 | 3.07 |
| dACC/posterior rostral cingulate zone (RCZp) | 0 | 4 | 36 | 3.04 |
| Posterior cingulate (area 31e) | 0 | −48 | 50 | 2.81 |
| Middle temporal gyrus, right | 56 | −48 | −6 | 4.06 |
| Inferior parietal lobule (PF/PFt/hlP2c), right | 44 | −34 | 48 | 3.72 |
| Inferior parietal lobule (PF/PFt/hlP2c), left | −50 | −40 | 50 | 3.53 |
| Occipital lobe | 6 | −76 | 8 | 3.65 |
| Cerebellum | 4 | −64 | −16 | 4.06 |
aList of activations in the outcome phase (GLM1) for the difference in activity associated with the effort magnitude of the chosen option as opposed to the unchosen option (relative effort magnitude outcome), for the difference in activity associated with the reward magnitude of the chosen option as opposed to the unchosen option (relative reward magnitude outcome) and reward type (real vs hypothetical). All results are cluster-corrected at p < 0.05.
bWhere indicated, anatomical labels were taken from Neubert et al. (2014).
cWhere indicated, anatomical labels were taken from Mars et al. (2011).
dWhere indicated, anatomical labels were taken from Sallet et al. (2013).
eWhere indicated, anatomical labels were taken from Beckmann et al. (2009).
Furthermore, we also note that, as we used sustained effort, there is an inherent (and naturalistic) confound between amount of effort and duration of the effort (or delay). Comparison of our study results with other studies (Prévost et al., 2010) suggests that the effort-related activations resembled those found in a pure effort task rather than in a pure delay-discounting task.
Representation of whether reward is real or hypothetical is widespread at the time of the outcome and relates to decision biases
We found widespread effects, in the outcome phase, of the reward type (real vs hypothetical) in areas including the ventral striatum and the vmPFC (Table 3; Fig. 4B, pink).
Notably, we also found activation with reward type in the aPFC, meaning that aPFC was more active (main effect) when outcomes were real rather than hypothetical (Fig. 4B, right hand panel; t(19) = 2.42, p = 0.025, statistical test in ROI, see “aPFC and FO/AI effort cost and reward outcome representations change when the reward is real as opposed to hypothetical”, below). At first glance, this might be surprising in as far as prior studies (e.g., Boorman et al., 2011) found that aPFC deactivates in proportion to the value of the option chosen. However, the result is consistent with the hypothesis that aPFC carries signals reporting the relative value of the choice not taken (the counterfactual choice), which would be the choice subjects would switch to if they could change their decision (and which they might switch to on the next trial) (Boorman et al., 2011). Thus, in our experiment, the activation found in relation with reward type is consistent with an enhanced switch signal that helps to overcome the stay bias introduced by real reward. If this interpretation is true, then individual differences in the strength of this activity should also relate to individual differences between participants in behavioral bias.
Therefore, we assessed next whether these BOLD increases related to the behavioral impact of reward type (real rewards biased participants toward staying with the same choice on the next trial; Fig. 3C) using GLM2 (see “Relating neural effects of real versus hypothetical reward to behavior”, above). Brain areas that are linked to the bias in behavior induced by real rewards should be ones in which the difference in activity in response to a real versus a hypothetical reward is greatest in participants exhibiting the strongest behavioral bias. We found such an effect in vmPFC (Fig. 5, red). By contrast, brain areas that are linked to resistance against the behavioral bias induced by real rewards should be ones in which the difference in activity in response to a real versus a hypothetical reward is greatest in participants exhibiting the weakest behavioral bias. We found such an effect in aPFC and a dorsal part of ACC (Fig. 5, blue; Table 4). Thus, this further supports the view that aPFC and dACC represent evidence in favor of switching to the alternative, and counteract signals advocating staying with the current choice in vmPFC when the reward was real as opposed to hypothetical.
Figure 5.

Correlations between the decision bias and the neural response to real versus hypothetical reward in the outcome phase. Participants who had a larger BOLD increase to real compared with hypothetical rewards in the vmPFC showed a larger behavioral bias (positive correlation; red). In contrast, participants who showed a larger activation to real compared with hypothetical rewards in the aPFC or the dACC showed a weaker behavioral bias (negative correlation; blue). All results are cluster corrected at p < 0.05. For illustration, we also show scatter plots of these correlations (B, C) using averages within spherical ROI's with a radius of 3 voxels in MNI space.
Table 4.
Outcome phase (GLM2): between-subject correlations neural signal real/hypothetical reward and decision biasa
| x | y | z | Maximum z score | |
|---|---|---|---|---|
| Positive correlations | ||||
| vmPFC | −2 | 40 | −2 | 3.21 |
| Negative correlations | ||||
| Pre-SMA/dACC/anterior rostral cingulate zone (RCZa) | 2 | 22 | 44 | 3.9 |
| aPFC/lateral frontal pole (FPl)b | 38 | 58 | −2 | 3.54 |
aList of positive and negative correlations between individual differences in the neural signal for reward type (real vs hypothetical) in the outcome phase and the behavioral decision bias (GLM2). All results are cluster-corrected at p < 0.05.
bWhere indicated, anatomical labels were taken from Neubert et al. (2014).
To assess whether aPFC and vmPFC made independent contributions in relation to the decision bias, we performed partial correlations between the COPE values extracted from these regions (for coordinates, see Table 4) and the behavioral impact of reward type (decision bias). We found that, when controlling for aPFC correlations, the correlation between vmPFC and decision bias was still significant (r = 0.49, p = 0.032). Similarly, the negative correlation between aPFC and the decision bias remained significant after controlling for vmPFC–behavior correlations (r = −0.498, p = 0.03). Similarly, we found that vmPFC is not a mediator for the effect of aPFC on behavior (z = −0.91, p = 0.36, Sobel test). Distinct neural processes linked to vmPFC and aPFC exert independent influences consistent with induction of the decision bias and with resistance to the decision bias. In contrast, when controlling for dACC, the correlation between aPFC and decision bias was no longer significant (r = −0.34, p = 0.16), suggesting that activity in both of these areas reflects a common process related to resistance to the decision bias. Furthermore, whereas the activations of aPFC and dACC in response to real compared with hypothetical reward were strongly correlated (p = 0.642, p = 0.002), this was not true for aPFC and vmPFC (r = −0.246, p = 0.296) or dACC and vmPFC (r = −0.233, p = 0.324). This further supports the view that, even though both aPFC and vmPFC were more active when a reward is real rather than hypothetical, activity in the two regions made independent and very different contributions to behavior. In other words, aPFC did not exert its influence on behavior by reducing the effect of reward on the vmPFC.
We note that, as with any fMRI study, all results discussed here are correlational, and further studies using techniques that can interfere with brain function will be needed to address questions about causality between brain and behavior more directly.
aPFC and FO/AI effort cost and reward outcome representations change when the reward is real as opposed to hypothetical
So far, we have reported two main types of results. First, we have shown that reward magnitude and effort magnitude significantly affect activity in several frontal cortical regions in the outcome phase, when participants witness the consequence of their decisions. Second, we have shown that reward type (real vs hypothetical) also affects activity in several frontal cortical regions in the outcome phases of trials and that this effect was related to the irrational behavioral bias to repeat choices associated with real as opposed to hypothetical rewards. Thus, the next obvious question was whether, within areas coding reward magnitude and effort magnitude, there was any influence of reward type. This allowed us to arbitrate between two opposing hypotheses: First, a region could code real and hypothetical reward differently because it is sensitive to the rewarding aspect of an outcome. In this case, the effort magnitude should always be represented the same, independent of reward type, as the effort always needs to be executed regardless of the reward type. Second, as an alternative hypothesis, a region could represent reward and effort magnitudes differently when the reward is real if its activity is related to counteracting a decision bias; in this case, we would expect it to represent reward and effort magnitudes more strongly when the reward is real to overcome the bias to stay with the rewarded option by enhancing the representation of the alternative option.
Using a time course analysis (Fig. 6), we found, to our surprise, that in the ventral striatum, there was no difference in the reward magnitude outcome effect for real versus hypothetical rewards (t(19) = 0.55, p = 0.587), even though there was a strong main effect (i.e., BOLD increase when the reward was real vs hypothetical; t(19) = 5.81, p < 0.001).
Figure 6.

Time courses from selected regions showing the main effect of real versus hypothetical reward and how the coding of the relative reward and effort magnitude outcomes is affected by the reward being real. A–C, Locations of the ROIs. Relative effort magnitude outcomes (chosen − unchosen option) (D) led to a larger increase in BOLD when the reward was real rather than hypothetical in aPFC and FO/AI, but not in ventral striatum. Similarly, relative reward magnitudes (chosen − unchosen option) (E) led to a stronger decrease in BOLD when the reward was real rather than hypothetical in aPFC and FO/AI, but not in ventral striatum. F, Whether the reward was real or hypothetical not only led to an increase in BOLD in ventral striatum and vmPFC but also in the aPFC. D, E, Significance was based on the result of paired two-tailed t tests comparing the hemodynamically convolved time courses from trials on which the reward was real or hypothetical: *p < 0.05; **p < 0.01; ***p < 0.001. F, Significance tests were one-sample two-tailed t tests. All ROIs were selected on the basis of an orthogonal contrast; aPFC, FO/AI, and dACC ROIs were selected based on the whole-brain-corrected contrast-relative effort magnitude at the time of outcome (chosen option − unchosen option); the ventral striatum ROI was selected based on the whole-brain-corrected contrast-relative reward magnitude at time of outcome (chosen − unchosen option); the vmPFC ROI was selected based on the whole-brain-corrected contrast real versus hypothetical reward outcome. The ROIs were 3 voxels in radius in the case of all cortical regions (aPFC, FO/AI, dACC, and vmPFC) and 2 voxels in radius in the case of the subcortical region (ventral striatum).
In contrast (Fig. 6), in aPFC and FO/AI, both reward magnitude and effort magnitude signals were significantly affected by reward type. In both regions, relative reward magnitude outcomes (chosen option reward magnitude outcome − unchosen option reward magnitude outcome) led to a BOLD decrease; related results have previously been reported (Boorman et al., 2009, 2011, 2013). But this effect was stronger when the reward was real (aPFC: t(19) = −2.314, p = 0.032; FO/AI: t(19) = −3.671, p = 0.002). Similarly, relative effort magnitude outcomes (chosen option effort magnitude − unchosen option effort magnitude) led to a stronger increase in BOLD signal when the reward was real (aPFC: t(19) = 2.27, p = 0.035; FO/AI: t(19) = 2.89, p = 0.009). This effect is striking because the effort that had to be exerted did not vary depending on whether reward was real or hypothetical. Instead, the effect on effort and reward magnitude outcomes suggests that aPFC and FO/AI code the evidence in favor of the counterfactual option (the switch choice) more when there is more need to consider this because receiving a real reward biases behavior toward staying with the current option. The pattern of results was qualitatively similar in dACC, although it did not reach statistical significance (reward magnitude-related effects of reward type: t(19) = −1.55, p = 0.138; effort magnitude-related effects of reward type: t(19) = 1.534, p = 0.142).
As already discussed in the last section, we also found an activation with real reward (main effect) in aPFC (Fig. 6; t(19) = 2.42, p = 0.025). This is not consistent with aPFC merely coding the value of the chosen option in an inverse or negative fashion. It is, however, like some of the other results found, consistent with the idea that aPFC codes the values of choices in a reference frame tied to the relative value of switching to the alternative choice as opposed to staying with the current choice.
aPFC carries all information necessary for reigning in the impact of rewards on decisions and representing costs when necessary
From the series of analyses conducted so far, aPFC repeatedly emerged as an area carrying various signals that are consistent with it playing a role in counteracting the bias to repeat choices (stay) introduced by real reward (Fig. 7). First, aPFC activated when rewards were real rather than hypothetical, consistent with a switch signal to overcome the bias (GLM1) (Figs. 4, 6). Importantly, participants in whom this signal was stronger had a reduced behavioral bias or, in other words, were better at overcoming the bias (GLM2) (Fig. 5). Next, aPFC also showed an increase in the coding of the reward and effort magnitudes (GLM3) (Fig. 6) when reward was real, again consistent with a role in overcoming the bias by enhancing the signal indexing the value of the alternative choice (switch) when real reward in other brain areas biased behavior toward repeating the current choice (stay).
Figure 7.

Various signals are present in the aPFC during the outcome phase. Different signals are present in aPFC that are consistent with a role in overcoming a bias to stay with the current choice when there is real rather than hypothetical reward. A, First, aPFC activity increases when rewards are real (pink) and participants with a stronger increase are better at overcoming the behavioral bias (blue). B, Second, the representation of effort magnitude outcomes increases in aPFC when reward is real (yellow). We also show the relative effort magnitude outcome contrast (red) used to identify our aPFC ROI (used for time courses in Fig. 6).
At the time of choice, the vmPFC is sensitive to whether the reward was real or hypothetical on the last trial
To understand further what signals at the time of decision-making (as opposed to at the time of the previous trials' outcome phase) might mediate the real reward-induced bias to repeat choices, we next investigated signals at the time of the decision phase. In addition to a regressor indexing the last trial's reward type (real vs hypothetical), we also included regressors indexing all the rational decision variables that ought to have influenced decision making (i.e., the learned reward and effort magnitudes and the explicitly shown probabilities, GLM 1) (Fig. 2A). For simplicity of presentation, we combined these rational decision variables into a “relative decision value” contrast. Specifically, the contrast for relative decision values included the following: chosen option value (reward magnitude + probability − effort magnitude) − unchosen option value (reward magnitude + probability − effort magnitude). We found that relative decision value was associated with activity in several areas (Fig. 8A; Table 5). For example, relative decision value was associated with BOLD increases in a midcingulate region and decreases in dACC, FO/AI, and aPFC. We also note that, although the vmPFC did not carry a statistically significant signal of relative decision value, we found a subthreshold activation.
Figure 8.
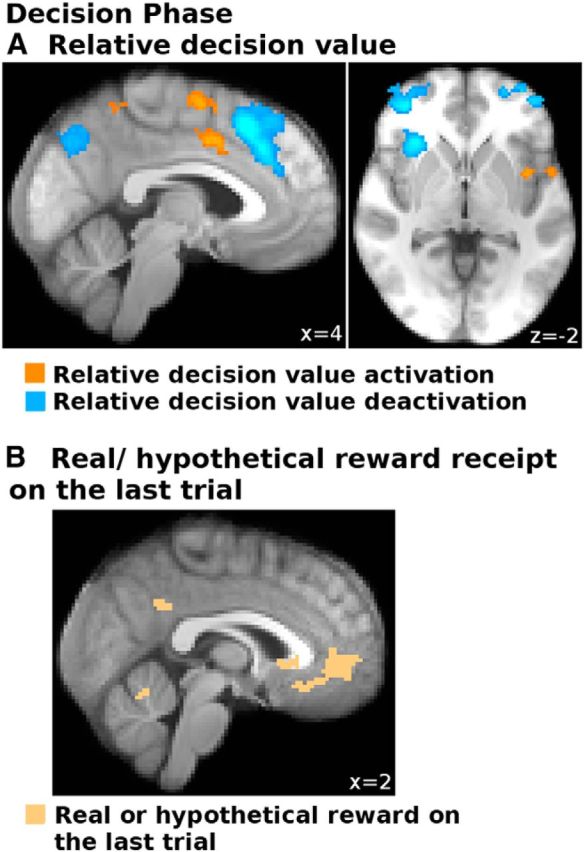
Brain activations in the decision phase. Relative decision value (A), a linear contrast of the regressors for relative (chosen − unchosen option) predicted reward magnitude + shown reward probability − predicted effort magnitude, led to increases (orange) and decreases (blue) in BOLD at the time of the decision. Regions activated in this contrast are regions in which activity is covarying with the value information that ought, rationally, to guide decision-making. Importantly, we also found increases in BOLD (B) in the vmPFC (beige) when a real rather than a hypothetical reward had been received on the last trial. vmPFC activity, therefore, covaries with an outcome feature that led to irrational biases in behavior. All results are cluster-corrected at p < 0.05.
Table 5.
Decision phase (GLM1)a
| x | y | z | Maximum z score | |
|---|---|---|---|---|
| Activations with relative decision value | ||||
| Inferior parietal lobule (PFop and PF/PFt/hlP2b), right | 66 | −30 | 32 | 4.38 |
| Inferior parietal lobule (PFop and PF/PFt/hlP2b), left | −58 | −38 | 34 | 3.87 |
| Ventral premotor (area 6rc), left | −48 | 0 | 8 | 4.04 |
| Insula (middle), left | −38 | 2 | 4 | 3.34 |
| Posterior rostral cingulate zone (RCZpd) | −2 | 2 | 48 | 3.80 |
| Deactivations with relative decision value | ||||
| Pre-SMA | 8 | 24 | 48 | 4.18 |
| dACC/anterior rostral cingulate zone (RCZad) | −6 | 32 | 36 | 3.68 |
| Inferior frontal sulcus/area 46c, right | 40 | 48 | −2 | 4.04 |
| Dorsolateral prefrontal cortex (area 9/46Ve), left | 42 | 30 | 38 | 3.93 |
| aPFC/lateral frontal pole (FPl), left | −24 | 60 | 4 | 3.64 |
| Inferior parietal lobule (PGa/PGpb), right | 48 | −56 | 38 | 4 |
| Inferior parietal lobule (PGa/PGpb), left | −30 | −64 | 34 | 3.32 |
| FO/AI, right | 32 | 26 | −4 | 4.61 |
| Superior parietal lobe (area 7b) | 6 | −64 | 46 | 3.44 |
| Activations with reward type (real/hypothetical) on the last trial | ||||
| vmPFC | 2 | 46 | −2 | 3.3 |
| Superior temporal gyrus | 52 | −8 | −8 | 3.65 |
| Inferior parietal lobule (PGpb), left | −36 | −66 | 30 | 3.28 |
| Posterior cingulate (area 31d), right | 16 | −48 | 34 | 3.2 |
| Posterior cingulate (area 31d), left | −6 | −54 | 22 | 3.04 |
| Cerebellum | −16 | −48 | −22 | 3.05 |
aList of activations and deactivations with relative decision value and of activation with last trial's reward type (real vs hypothetical) during the decision phase (GLM1). All results are cluster-corrected at p < 0.05.
bWhere indicated, anatomical labels were taken from Mars et al. (2011).
cWhere indicated, anatomical labels were taken from Neubert et al. (2014).
dWhere indicated, anatomical labels were taken from Beckmann et al. (2009).
eWhere indicated, anatomical labels were taken from Sallet et al. (2013).
The important result, however, is that whether the reward on the last trial had been real as opposed to hypothetical again affected vmPFC at the time of decision-making just as had been the case in the outcome phase (Fig. 8B, beige). This signal was significant even after whole-brain cluster-based correction for multiple comparisons. The outcome-related and decision-related effects in vmPFC relating to whether rewards were real or hypothetical were distinct because of their large temporal separation. On average, 17 s elapsed between the outcome phase of one trial and the decision phase of the next trial (Fig. 1).
Amygdalar activity at the time of choice reflects the bias to repeat choices when reward was real as opposed to hypothetical on the last trial
So far, we have identified regions susceptible to the bias induced by real rewards because they activated differently when reward was real versus hypothetical. Although such an activation pattern reflects the registration of the impact of the reward type, one could also imagine a region that then uses this information to bias behavior (i.e., the decision to stay or switch). Previous studies (de Martino et al., 2006; Roiser et al., 2009) have found the amygdala to play such a role; more precisely, they found the amygdala to activate more when decisions were in agreement with a frame (or bias) than when decisions were made against it. In our case, this would translate to more activity when a decision is made to stay after a real reward or switch after a hypothetical reward (i.e., behavior in both cases that is in line with the “frame” introduced by the real/hypothetical reward on the last trial). And on the other hand, this would translate to reduced activity when a decision is made to switch after a real reward or stay after a hypothetical reward. We tested this hypothesis (GLM3) by including a stay-switch regressor and a regressor for last trial's reward type (in addition to regressors controlling for the options' values). This analysis then allowed examination of how such stay-switch signals interacted with the previous trials' reward type: We compared activity associated with staying and switching on trials that followed either real or hypothetical rewards (i.e., a contrast of the regressors stay/switch on trials after a real reward minus stay/switch on trials after a hypothetical reward). The contrast revealed activations in the amygdala (Fig. 9A, green) and other regions (for a full list of activations, see Table 6). For the next analyses, we focused on the amygdala because previous studies suggested that this was a key area of interest (de Martino et al., 2006; Roiser et al., 2009). However, further studies should also investigate the other areas found in the same contrast in more detail. To look at the effect in more detail, we extracted the BOLD time course from an ROI in the amygdala (Fig. 9B). We found that the amygdala was more active when participants decided to stay with the same option (repeat a choice) only after they had received a real reward on the last trial. In contrast, the amygdala was more active when participants decide to switch when the reward outcome on the last trial was only hypothetical. In other words, when the decision to stay or leave was made in line with the participants' overall decision bias, the amygdala was more active.
Table 6.
Decision phase (GLM3)a
| x | y | z | Maximum z score | |
|---|---|---|---|---|
| Deactivations with stay> switch | ||||
| dACC/anterior rostral cingulate zone (RCZa)/d32b | −8 | 36 | 32 | 3.27 |
| Medial superior parietal cortex near IPS1/IPS2 | 4 | −74 | 46 | 3.03 |
| Inferior parietal lobule (PGac), left | −40 | −54 | 50 | 3.35 |
| Activations for interaction (stay-switch) × (real/hypothetical reward on last trial) | ||||
| Amygdala, right | 30 | −6 | −20 | 3.05 |
| Putamen, right | 28 | 14 | −10 | 3.66 |
| Caudate, right | 18 | 16 | 4 | 3.08 |
| Temporal fusiform cortex | −42 | −32 | −16 | 3.86 |
| Putamen, left | −28 | 8 | −10 | 3.56 |
| Hippocampus, left | −22 | −24 | −18 | 3.42 |
| aPFC/medial frontal pole (FPmd) | 2 | 58 | 18 | 3.57 |
| dACC/anterior rostral cingulate zone | ||||
| (RCZab), left | −14 | 10 | 40 | 3.21 |
| Brainstem | 6 | −24 | −26 | 3.64 |
aList of activations for stay versus switch and its interaction with last trial's reward type (real vs hypothetical). All results are cluster-corrected at p < 0.05. Lists comprise main peaks and subpeaks.
bWhere indicated, anatomical labels were taken from Beckmann et al. (2009).
cWhere indicated, anatomical labels were taken from Mars et al. (2011).
dWhere indicated, anatomical labels were taken from Sallet et al. (2013).
As an exploratory analysis, we next hypothesized, by analogy with previous studies (Roiser et al., 2009), that if the amygdala biases participants, its activity might be affected by an area that opposes the bias. If this were the case, then decisions would be more likely to be made in line with the overall decision bias when connectivity between a frontal lobe area and amygdala is weaker (i.e., the frontal lobe area is less able to influence the amygdala). In our experiment, the frontal brain area most likely to have such a role was aPFC. To test this idea, we performed a PPI analysis in which we measured whether the functional coupling between amygdala and aPFC (measured as correlation in activity) was reduced when decisions were made in line with the overall decision bias. We found (Fig. 9Ci) that, at the time of the decision, aPFC and amygdala were, in general, negatively coupled (p < 0.05 at every time point, two-tailed one-sample t test). This negative coupling was smaller (Fig. 9Cii) when decisions were made in line with the bias, shown as a reduction in the negative correlation between the two areas (p < 0.05 at 16 time points, two-tailed one-sample t test). Thus, in summary, we found that the functional connectivity or coupling between aPFC and amygdala may be linked to how well participants are able to prevent themselves from being biased. However, we also note that our design may not be the most ideal for examining such an interaction effect; in our task (in contrast to the task used by de Martino et al., 2006), decisions should be influenced by many factors; thus, our categorization of whether a trial was in line with, or against, the bias was somewhat simplistic: for example, on some trials, the rationally better option might also have happened to either be the option consistent or inconsistent with the bias. Thus, further research is needed to probe the connectivity between these areas in more detail.
Discussion
In complex natural environments, single choices can lead to multiple aspect outcomes. Humans should particularly learn about those aspects contingent upon choice: in our task, such aspects were reward and effort magnitudes. Importantly, participants should not learn choice–outcome feature relationships when those outcome features have no contingent relationship with choice: in our task, whether a reward was really received or only hypothetical. Participants were able to learn the real contingencies; they could use the informational content of reward, but they were also biased by its rewarding properties. At a neural level, we found areas possibly inducing (e.g., vmPFC and amygdala) and counteracting (aPFC, dACC, AI/FO) this bias.
Real rewards biased decisions
After obtaining real rather than hypothetical rewards, participants were more likely to repeat choices. This irrational bias remained even after controlling for factors that should, rationally, have influenced decisions. This suggests that participants perceived choices recently associated with real reward as preferable to those associated with hypothetical reward. Intriguingly, whether reward was real or hypothetical also affected how participants exerted effort. Using computational modeling, we found that this bias was not due to participants not learning about hypothetical rewards or treating hypothetical rewards as if no reward had occurred. Instead, we found that the bias was best explained as participants simply preferring options that had led to a real reward independent of their other attributes that should rationally influence decisions (e.g., learned reward or effort magnitudes or explicitly shown probabilities).
Brain networks driving decision bias
Two competing networks were related to the extent irrational biases manifested in behavior. Activity patterns and between-subject correlations suggested that vmPFC and amygdala contributed to the bias, whereas aPFC, together with FO/AI and dACC, counteracted it.
When participants saw choice outcomes, vmPFC encoded whether reward had been real or hypothetical. We also found a positive correlation between this signal and participants' behavioral biases to repeat choices after real rewards. Participants whose vmPFC activity was more affected by whether reward was real were more biased.
vmPFC was not just active at choice outcome but also during decisions. Then vmPFC activity reflected whether reward had been real or hypothetical on the last trial, but it did not significantly encode any quantity that should rationally have affected decisions, such as reward and effort magnitudes or reward probabilities. These quantities were instead represented in aPFC, dACC, and FO/AI. This result recalls other studies that failed to find vmPFC activity when both rewards and effort costs had to be integrated before participants could choose (Croxson et al., 2009; Prévost et al., 2010; Burke et al., 2013; Kurniawan et al., 2013; but see also Skvortsova et al., 2014). It contrasts, however, with a large body of work confirming the importance of vmPFC in reward-guided decision-making (Rangel and Hare, 2010; Rushworth et al., 2012) and in subjective estimates of real reward contingencies (Tanaka et al., 2008).
vmPFC's role in inducing decision bias may be related to a more general role in choice repetition when this is advantageous. vmPFC activity at choice outcome predicts whether similar choices will be taken on the next opportunity (Boorman et al., 2011). Moreover, contrary to widespread beliefs about perseverative behavior after frontal lesions, vmPFC lesions reduce the rates at which advantageous choices are retaken (Noonan et al., 2012).
vmPFC has been linked to construction of task models to guide behavior (Daw et al., 2011; Wunderlich et al., 2012). In those studies, vmPFC contextualized real reward information relevant for decision-making in task models. In contrast, in our study, whether reward is real should be completely ignored, rather than used within a model framework. Thus, our results suggest that, although vmPFC may be good at contextualizing real reward within a task model, it may be not as good at ignoring whether a reward is real or hypothetical.
Bias-related activity was also present in amygdala. Amygdala and vmPFC are monosynaptically interconnected, and their activity is coupled (Carmichael and Price, 1995; Neubert et al., 2015). Whereas vmPFC was always more active when the last trial had been rewarded, the amygdala was more active whenever choices accorded with the irrational behavioral bias that the vmPFC signal could induce. It may be helpful to consider this result in relation to the response potentiating effect that reward-related amygdala activity exerts in Pavlovian instrumental transfer (Bray et al., 2008; Talmi et al., 2008; Geurts et al., 2013) and to observations that amygdala choice coding changes when participants make decisions “framed” in terms of losses or gains and irrational changes in behavior ensue (de Martino et al., 2006). It is also noteworthy that, although we focused on the amygdala here, other areas were also more active when choices were in accordance with the irrational bias, and further studies need to establish the specific roles they play.
Ventral striatum has also been implicated in the response-potentiating influences of reward in Pavlovian instrumental transfer (Bray et al., 2008; Talmi et al., 2008; Prévost et al., 2012; Geurts et al., 2013), but these regions were less central to the behavioral biases identified in the present study. Ventral striatal activity increased identically when reward magnitude outcomes were larger regardless of whether outcomes were real or hypothetical, although there was a main effect of reward type (real vs hypothetical) that meant activity was greater when rewards were real as opposed to hypothetical. Thus, although ventral striatum was sensitive to reward type, this effect did not interact with reward magnitude. These results are similar to previous reports of no difference in coding of real or hypothetical rewards in ventral striatum (Bickel et al., 2009) and reports of both fictive and real reward prediction errors in ventral striatum (Lohrenz et al., 2007; Chiu et al., 2008). These results are, however, surprising in the context of other brain regions that did code reward magnitudes differently when rewards were real rather than hypothetical.
A network including aPFC opposed the irrational bias in decision-making induced by real rewards
Having identified which regions bias behavior when reward was real, we looked also for whether regions existed that opposed this bias. We found different activations in aPFC, FO/AI, and dACC that contributed to overcoming the bias to repeat choices recently associated with real rewards. The results suggest that one reason that these regions code costs (e.g., Palminteri et al., 2012) may be not just because costs are aversive but because they motivate change in behavior when repetition is maladaptive.
The aPFC was particularly interesting because it carried several important signals. In agreement with previous studies (Boorman et al., 2009, 2011; Donoso et al., 2014), aPFC activation increased as the unchosen option's reward magnitude increased and deactivated with the chosen option's reward magnitude, suggesting that aPFC represents the relative advantage of switching to the alternative option rather than staying with the current choice. We extend this finding by reporting a complementary pattern for the coding of learned effort cost magnitudes.
Coding of reward magnitude outcomes in aPFC and FO/AI was affected by whether reward outcome was real or hypothetical. The relative reward magnitude of the unchosen option was associated with increased activity when reward was real compared with hypothetical. This suggests that it is not simply the hypothetical nature of choices that leads to them being represented in aPFC; if that had been the case, then reward magnitude ought to have been represented more strongly when the outcome was hypothetical and effort representation should be unaffected by reward type. Instead, these results suggest that aPFC activity is driven by the importance reward and effort magnitudes have for switching to an alternative choice. Specifically, when a reward is real, brain regions, such as vmPFC, bias behavior toward choice repetition. To overcome this bias, it may be necessary to enhance the representation of the alternative choice in aPFC. Moreover, as functional coupling between amygdala and aPFC increased, decisions were less likely to be made in a biased manner.
The importance of aPFC in overcoming the bias is further supported by the observation that reward type (real vs hypothetical) led to an increase in activation in aPFC. This increase in activation would be surprising if aPFC only coded a negative value signal, as then real reward should have led to a deactivation compared with hypothetical reward. Instead, activation in aPFC is related to promoting the choice of the alternative option. In agreement with this interpretation, we also found that participants with stronger activation to reward type in aPFC were better at counteracting the bias to repeat choices previously followed by real rewards. Thus, although individual variation in vmPFC activity was positively correlated with susceptibility to decision biases induced by real rewards, the relationship was the opposite way around for aPFC. Further analysis demonstrated that aPFC and vmPFC constitute two independent systems: one biasing behavior toward staying with rewarded options and the other one counteracting this bias when it is important to do so. aPFC, together with ACC, is not only involved in value-guided exploration (Daw et al., 2006; Kolling et al., 2012), but also in counteracting reward-based choice repetition when this should be avoided. In a similar vein, Kolling et al. (2014) suggested that activity in aPFC and dACC, as opposed to vmPFC, guides decision making in risky contexts to maximize longer-term reward even when this did not maximize reward on the current trial.
Footnotes
This work was supported by The Wellcome Trust and Medical Research Council to J.S., N.K., M.K.W., and M.F.S.R. and a Christ Church College Junior Research Fellowship to N.K. We thank Miriam Klein-Flügge for helpful comments on an earlier draft of the manuscript and Mark Walton for help with finding the right words.
C.J.H. has acted as a paid consultant for Lundbeck, Servier, and P1vital and is a company director of Oxford Psychologists and holds shares in the company. The remaining authors declare no competing financial interests.
This is an Open Access article distributed under the terms of the Creative Commons Attribution License Creative Commons Attribution 4.0 International, which permits unrestricted use, distribution and reproduction in any medium provided that the original work is properly attributed.
References
- Ahn WY, Krawitz A, Kim W, Busmeyer JR, Brown JW. A model-based fMRI analysis with hierarchical Bayesian parameter estimation. J Neurosci Psychol Econ. 2011;4:95–110. doi: 10.1037/a0020684. [DOI] [PMC free article] [PubMed] [Google Scholar]
- Beckmann CF, Smith SM. Probabilistic independent component analysis for functional magnetic resonance imaging. IEEE Trans Med Imaging. 2004;23:137–152. doi: 10.1109/TMI.2003.822821. [DOI] [PubMed] [Google Scholar]
- Beckmann CF, Jenkinson M, Smith SM. General multilevel linear modeling for group analysis in fMRI. Neuroimage. 2003;20:1052–1063. doi: 10.1016/S1053-8119(03)00435-X. [DOI] [PubMed] [Google Scholar]
- Beckmann M, Johansen-Berg H, Rushworth MF. Connectivity-based parcellation of human cingulate cortex and its relation to functional specialization. J Neurosci. 2009;29:1175–1190. doi: 10.1523/JNEUROSCI.3328-08.2009. [DOI] [PMC free article] [PubMed] [Google Scholar]
- Behrens TE, Woolrich MW, Walton ME, Rushworth MF. Learning the value of information in an uncertain world. Nat Neurosci. 2007;10:1214–1221. doi: 10.1038/nn1954. [DOI] [PubMed] [Google Scholar]
- Bickel WK, Pitcock JA, Yi R, Angtuaco EJ. Congruence of BOLD response across intertemporal choice conditions: fictive and real money gains and losses. J Neurosci. 2009;29:8839–8846. doi: 10.1523/JNeurosci.5319-08.2009. [DOI] [PMC free article] [PubMed] [Google Scholar]
- Boorman ED, Behrens TE, Woolrich MW, Rushworth MF. How green is the grass on the other side? Frontopolar cortex and the evidence in favor of alternative courses of action. Neuron. 2009;62:733–743. doi: 10.1016/j.neuron.2009.05.014. [DOI] [PubMed] [Google Scholar]
- Boorman ED, Behrens TE, Rushworth MF. Counterfactual choice and learning in a neural network centered on human lateral frontopolar cortex. PLoS Biol. 2011;9:e1001093. doi: 10.1371/journal.pbio.1001093. [DOI] [PMC free article] [PubMed] [Google Scholar]
- Boorman ED, Rushworth MF, Behrens TE. Ventromedial prefrontal and anterior cingulate cortex adopt choice and default reference frames during sequential multialternative choice. J Neurosci. 2013;33:2242–2253. doi: 10.1523/JNEUROSCI.3022-12.2013. [DOI] [PMC free article] [PubMed] [Google Scholar]
- Bray S, Rangel A, Shimojo S, Balleine B, O'Doherty JP. The neural mechanisms underlying the influence of pavlovian cues on human decision making. J Neurosci. 2008;28:5861–5866. doi: 10.1523/JNEUROSCI.0897-08.2008. [DOI] [PMC free article] [PubMed] [Google Scholar]
- Burke CJ, Brünger C, Kahnt T, Park SQ, Tobler PN. Neural integration of risk and effort costs by the frontal pole: only upon request. J Neurosci. 2013;33:1706–1713. doi: 10.1523/JNEUROSCI.3662-12.2013. [DOI] [PMC free article] [PubMed] [Google Scholar]
- Carmichael ST, Price JL. Limbic connections of the orbital and medial prefrontal cortex in macaque monkeys. J Comp Neurol. 1995;363:615–641. doi: 10.1002/cne.903630408. [DOI] [PubMed] [Google Scholar]
- Chau BK, Kolling N, Hunt LT, Walton ME, Rushworth MF. A neural mechanism underlying failure of optimal choice with multiple alternatives. Nat Neurosci. 2014;17:463–470. doi: 10.1038/nn.3649. [DOI] [PMC free article] [PubMed] [Google Scholar]
- Chiu PH, Lohrenz TM, Montague PR. Smokers' brains compute, but ignore, a fictive error signal in a sequential investment task. Nat Neurosci. 2008;11:514–520. doi: 10.1038/nn2067. [DOI] [PubMed] [Google Scholar]
- Croxson PL, Walton ME, O'Reilly JX, Behrens TE, Rushworth MF. Effort-based cost-benefit valuation and the human brain. J Neurosci. 2009;29:4531–4541. doi: 10.1523/JNEUROSCI.4515-08.2009. [DOI] [PMC free article] [PubMed] [Google Scholar]
- Daw ND, O'Doherty JP, Dayan P, Seymour B, Dolan RJ. Cortical substrates for exploratory decisions in humans. Nature. 2006;441:876–879. doi: 10.1038/nature04766. [DOI] [PMC free article] [PubMed] [Google Scholar]
- Daw ND, Gershman SJ, Seymour B, Dayan P, Dolan RJ. Model-based influences on humans' choices and striatal prediction errors. Neuron. 2011;69:1204–1215. doi: 10.1016/j.neuron.2011.02.027. [DOI] [PMC free article] [PubMed] [Google Scholar]
- Deichmann R, Gottfried JA, Hutton C, Turner R. Optimized EPI for fMRI studies of the orbitofrontal cortex. Neuroimage. 2003;19:430–441. doi: 10.1016/S1053-8119(03)00073-9. [DOI] [PubMed] [Google Scholar]
- de Martino B, Kumaran D, Seymour B, Dolan RJ. Frames, biases, and rational decision-making in the human brain. Science. 2006;313:684–687. doi: 10.1126/science.1128356. [DOI] [PMC free article] [PubMed] [Google Scholar]
- Donoso M, Collins AG, Koechlin E. Human cognition: foundations of human reasoning in the prefrontal cortex. Science. 2014;344:1481–1486. doi: 10.1126/science.1252254. [DOI] [PubMed] [Google Scholar]
- Friston KJ, Frith CD, Liddle PF, Dolan RJ, Lammertsma AA, Frackowiak RS. The relationship between global and local changes in PET scans. J Cereb Blood Flow Metab. 1990;10:458–466. doi: 10.1038/jcbfm.1990.88. [DOI] [PubMed] [Google Scholar]
- Geurts DE, Huys QJ, den Ouden HE, Cools R. Aversive Pavlovian control of instrumental behavior in humans. J Cogn Neurosci. 2013;25:1428–1441. doi: 10.1162/jocn_a_00425. [DOI] [PubMed] [Google Scholar]
- Jenkinson M, Beckmann CF, Behrens TE, Woolrich MW, Smith SM. Fsl. Neuroimage. 2012;62:782–790. doi: 10.1016/j.neuroimage.2011.09.015. [DOI] [PubMed] [Google Scholar]
- Kelly RE, Jr, Alexopoulos GS, Wang Z, Gunning FM, Murphy CF, Morimoto SS, Kanellopoulos D, Jia Z, Lim KO, Hoptman MJ. Visual inspection of independent components: defining a procedure for artifact removal from fMRI data. J Neurosci Methods. 2010;189:233–245. doi: 10.1016/j.jneumeth.2010.03.028. [DOI] [PMC free article] [PubMed] [Google Scholar]
- Kolling N, Behrens TE, Mars RB, Rushworth MF. Neural mechanisms of foraging. Science. 2012;336:95–98. doi: 10.1126/science.1216930. [DOI] [PMC free article] [PubMed] [Google Scholar]
- Kolling N, Wittmann M, Rushworth MF. Multiple neural mechanisms of decision making and their competition under changing risk pressure. Neuron. 2014;81:1190–1202. doi: 10.1016/j.neuron.2014.01.033. [DOI] [PMC free article] [PubMed] [Google Scholar]
- Kurniawan IT, Guitart-Masip M, Dayan P, Dolan RJ. Effort and valuation in the brain: the effects of anticipation and execution. J Neurosci. 2013;33:6160–6169. doi: 10.1523/JNEUROSCI.4777-12.2013. [DOI] [PMC free article] [PubMed] [Google Scholar]
- Lee MD, Wagenmakers E-J. Bayesian cognitive modeling: a practical course. Cambridge: Cambridge UP; 2014. [Google Scholar]
- Lohrenz T, McCabe K, Camerer CF, Montague PR. Neural signature of fictive learning signals in a sequential investment task. Proc Natl Acad Sci U S A. 2007;104:9493–9498. doi: 10.1073/pnas.0608842104. [DOI] [PMC free article] [PubMed] [Google Scholar]
- Mars RB, Jbabdi S, Sallet J, O'Reilly JX, Croxson PL, Olivier E, Noonan MP, Bergmann C, Mitchell AS, Baxter MG, Behrens TE, Johansen-Berg H, Tomassini V, Miller KL, Rushworth MF. Diffusion-weighted imaging tractography-based parcellation of the human parietal cortex and comparison with human and macaque resting-state functional connectivity. J Neurosci. 2011;31:4087–4100. doi: 10.1523/JNEUROSCI.5102-10.2011. [DOI] [PMC free article] [PubMed] [Google Scholar]
- Neubert FX, Mars RB, Thomas AG, Sallet J, Rushworth MF. Comparison of human ventral frontal cortex areas for cognitive control and language with areas in monkey frontal cortex. Neuron. 2014;81:700–713. doi: 10.1016/j.neuron.2013.11.012. [DOI] [PubMed] [Google Scholar]
- Neubert FX, Mars RB, Sallet J, Rushworth MFS. Connectivity profiles reveal relationship of brain areas for reward-guided learning and decision making in human and monkey frontal cortex. Proc Natl Acad Sci U S A. 2015;112:E2695–E2704. doi: 10.1073/pnas.1410767112. [DOI] [PMC free article] [PubMed] [Google Scholar]
- Nilsson H, Rieskamp J, Wagenmakers EJ. Hierarchical Bayesian parameter estimation for cumulative prospect theory. J Math Psychol. 2011;55:84–93. doi: 10.1016/j.jmp.2010.08.006. [DOI] [Google Scholar]
- Noonan MP, Kolling N, Walton ME, Rushworth MF. Re-evaluating the role of the orbitofrontal cortex in reward and reinforcement. Eur J Neurosci. 2012;35:997–1010. doi: 10.1111/j.1460-9568.2012.08023.x. [DOI] [PubMed] [Google Scholar]
- O'Reilly JX, Woolrich MW, Behrens TE, Smith SM, Johansen-Berg H. Tools of the trade: psychophysiological interactions and functional connectivity. Soc Cogn Affect Neurosci. 2012;7:604–609. doi: 10.1093/scan/nss055. [DOI] [PMC free article] [PubMed] [Google Scholar]
- Palminteri S, Justo D, Jauffret C, Pavlicek B, Dauta A, Delmaire C, Czernecki V, Karachi C, Capelle L, Durr A, Pessiglione M. Critical roles for anterior insula and dorsal striatum in punishment-based avoidance learning. Neuron. 2012;76:998–1009. doi: 10.1016/j.neuron.2012.10.017. [DOI] [PubMed] [Google Scholar]
- Pessiglione M, Schmidt L, Draganski B, Kalisch R, Lau H, Dolan RJ, Frith CD. How the brain translates money into force: a neuroimaging study of subliminal motivation. Science. 2007;316:904–906. doi: 10.1126/science.1140459. [DOI] [PMC free article] [PubMed] [Google Scholar]
- Plummer M. JAGS: a program for analysis of Bayesian graphical models using Gibbs sampling. Proceedings of the 3rd international workshop on distributed statistical computing; Vienna. 2003. p. 125. [Google Scholar]
- Preacher KJ, Hayes AF. SPSS and SAS procedures for estimating indirect effects in simple mediation models. Behav Res Methods Instrum Comput. 2004;36:717–731. doi: 10.3758/BF03206553. [DOI] [PubMed] [Google Scholar]
- Prévost C, Pessiglione M, Météreau E, Cléry-Melin ML, Dreher JC. Separate valuation subsystems for delay and effort decision costs. J Neurosci. 2010;30:14080–14090. doi: 10.1523/JNEUROSCI.2752-10.2010. [DOI] [PMC free article] [PubMed] [Google Scholar]
- Prévost C, Liljeholm M, Tyszka JM, O'Doherty JP. Neural correlates of specific and general Pavlovian-to-Instrumental Transfer within human amygdalar subregions: a high-resolution fMRI study. J Neurosci. 2012;32:8383–8390. doi: 10.1523/JNEUROSCI.6237-11.2012. [DOI] [PMC free article] [PubMed] [Google Scholar]
- Rangel A, Hare T. Neural computations associated with goal-directed choice. Curr Opin Neurobiol. 2010;20:262–270. doi: 10.1016/j.conb.2010.03.001. [DOI] [PubMed] [Google Scholar]
- Rogers BP, Morgan VL, Newton AT, Gore JC. Assessing functional connectivity in the human brain by fMRI. Magn Reson Imaging. 2007;25:1347–1357. doi: 10.1016/j.mri.2007.03.007. [DOI] [PMC free article] [PubMed] [Google Scholar]
- Roiser JP, de Martino B, Tan GC, Kumaran D, Seymour B, Wood NW, Dolan RJ. A genetically mediated bias in decision making driven by failure of amygdala control. J Neurosci. 2009;29:5985–5991. doi: 10.1523/JNEUROSCI.0407-09.2009. [DOI] [PMC free article] [PubMed] [Google Scholar]
- Rudebeck PH, Walton ME, Smyth AN, Bannerman DM, Rushworth MF. Separate neural pathways process different decision costs. Nat Neurosci. 2006;9:1161–1168. doi: 10.1038/nn1756. [DOI] [PubMed] [Google Scholar]
- Rushworth MF, Kolling N, Sallet J, Mars RB. Valuation and decision-making in frontal cortex: one or many serial or parallel systems? Curr Opin Neurobiol. 2012;22:946–955. doi: 10.1016/j.conb.2012.04.011. [DOI] [PubMed] [Google Scholar]
- Salamone JD, Cousins MS, McCullough LD, Carriero DL, Berkowitz RJ. Nucleus accumbens dopamine release increases during instrumental lever pressing for food but not free food consumption. Pharmacol Biochem Behav. 1994;49:25–31. doi: 10.1016/0091-3057(94)90452-9. [DOI] [PubMed] [Google Scholar]
- Salamone JD, Correa M, Mingote S, Weber SM. Nucleus accumbens dopamine and the regulation of effort in food-seeking behavior: implications for studies of natural motivation, psychiatry, and drug abuse. J Pharmacol Exp Ther. 2003;305:1–8. doi: 10.1124/jpet.102.035063. [DOI] [PubMed] [Google Scholar]
- Sallet J, Mars RB, Noonan MP, Neubert FX, Jbabdi S, O'Reilly JX, Filippini N, Thomas AG, Rushworth MF. The organization of dorsal frontal cortex in humans and macaques. J Neurosci. 2013;33:12255–12274. doi: 10.1523/JNEUROSCI.5108-12.2013. [DOI] [PMC free article] [PubMed] [Google Scholar]
- Scholl J, Günthner J, Kolling N, Favaron E, Rushworth MF, Harmer CJ, Reinecke A. A role beyond learning for NMDA receptors in reward-based decision-making-a pharmacological study using d-cycloserine. Neuropsychopharmacology. 2014;39:2900–2909. doi: 10.1038/npp.2014.144. [DOI] [PMC free article] [PubMed] [Google Scholar]
- Shiffrin RM, Lee MD, Kim W, Wagenmakers EJ. A survey of model evaluation approaches with a tutorial on hierarchical bayesian methods. Cogn Sci. 2008;32:1248–1284. doi: 10.1080/03640210802414826. [DOI] [PubMed] [Google Scholar]
- Skvortsova V, Palminteri S, Pessiglione M. Learning to minimize efforts versus maximizing rewards: computational principles and neural correlates. J Neurosci. 2014;34:15621–15630. doi: 10.1523/JNEUROSCI.1350-14.2014. [DOI] [PMC free article] [PubMed] [Google Scholar]
- Smith SM. Fast robust automated brain extraction. Hum Brain Mapp. 2002;17:143–155. doi: 10.1002/hbm.10062. [DOI] [PMC free article] [PubMed] [Google Scholar]
- Smith SM, Jenkinson M, Woolrich MW, Beckmann CF, Behrens TE, Johansen-Berg H, Bannister PR, De Luca M, Drobnjak I, Flitney DE, Niazy RK, Saunders J, Vickers J, Zhang Y, De Stefano N, Brady JM, Matthews PM. Advances in functional and structural MR image analysis and implementation as FSL. Neuroimage. 2004;23(Suppl 1):S208–S219. doi: 10.1016/j.neuroimage.2004.07.051. [DOI] [PubMed] [Google Scholar]
- Spiegelhalter DJ, Best NG, Carlin BP, van der Linde A. Bayesian measures of model complexity and fit. J R Statist Soc B. 2002;64:583–639. doi: 10.1111/1467-9868.00353. [DOI] [Google Scholar]
- Talmi D, Seymour B, Dayan P, Dolan RJ. Human Pavlovian-instrumental transfer. J Neurosci. 2008;28:360–368. doi: 10.1523/JNEUROSCI.4028-07.2008. [DOI] [PMC free article] [PubMed] [Google Scholar]
- Tanaka SC, Balleine BW, O'Doherty JP. Calculating consequences: brain systems that encode the causal effects of actions. J Neurosci. 2008;28:6750–6755. doi: 10.1523/JNEUROSCI.1808-08.2008. [DOI] [PMC free article] [PubMed] [Google Scholar]
- Vickery TJ, Chun MM, Lee D. Ubiquity and specificity of reinforcement signals throughout the human brain. Neuron. 2011;72:166–177. doi: 10.1016/j.neuron.2011.08.011. [DOI] [PubMed] [Google Scholar]
- Walton ME, Bannerman DM, Rushworth MF. The role of rat medial frontal cortex in effort-based decision making. J Neurosci. 2002;22:10996–11003. doi: 10.1523/JNEUROSCI.22-24-10996.2002. [DOI] [PMC free article] [PubMed] [Google Scholar]
- Walton ME, Bannerman DM, Alterescu K, Rushworth MF. Functional specialization within medial frontal cortex of the anterior cingulate for evaluating effort-related decisions. J Neurosci. 2003;23:6475–6479. doi: 10.1523/JNEUROSCI.23-16-06475.2003. [DOI] [PMC free article] [PubMed] [Google Scholar]
- Walton ME, Kennerley SW, Bannerman DM, Phillips PE, Rushworth MF. Weighing up the benefits of work: behavioral and neural analyses of effort-related decision making. Neural Netw. 2006;19:1302–1314. doi: 10.1016/j.neunet.2006.03.005. [DOI] [PMC free article] [PubMed] [Google Scholar]
- Woolrich MW, Ripley BD, Brady M, Smith SM. Temporal autocorrelation in univariate linear modeling of fMRI data. Neuroimage. 2001;14:1370–1386. doi: 10.1006/nimg.2001.0931. [DOI] [PubMed] [Google Scholar]
- Wunderlich K, Dayan P, Dolan RJ. Mapping value based planning and extensively trained choice in the human brain. Nat Neurosci. 2012;15:786–791. doi: 10.1038/nn.3068. [DOI] [PMC free article] [PubMed] [Google Scholar]