

Abstract
The possibility that mechanisms of synaptic modulation differ between males and females has far-reaching implications for understanding brain disorders that vary between the sexes. We found recently that 17β-estradiol (E2) acutely suppresses GABAergic inhibition in the hippocampus of female rats through a sex-specific estrogen receptor α (ERα), mGluR, and endocannabinoid-dependent mechanism. Here, we define the intracellular signaling that links ERα, mGluRs, and endocannabinoids in females and identify where in this pathway males and females differ. Using a combination of whole-cell patch-clamp recording and biochemical analyses in hippocampal slices from young adult rats, we show that E2 acutely suppresses inhibition in females through mGluR1 stimulation of phospholipase C, leading to inositol triphosphate (IP3) generation, activation of the IP3 receptor (IP3R), and postsynaptic endocannabinoid release, likely of anandamide. Analysis of sex differences in this pathway showed that E2 stimulates a much greater increase in IP3 levels in females than males, whereas the group I mGluR agonist DHPG increases IP3 levels equivalently in each sex. Coimmunoprecipitation showed that ERα–mGluR1 and mGluR1–IP3R complexes exist in both sexes but are regulated by E2 only in females. Independently of E2, a fatty acid amide hydrolase inhibitor, which blocks breakdown of anandamide, suppressed >50% of inhibitory synapses in females with no effect in males, indicating tonic endocannabinoid release in females that is absent in males. Together, these studies demonstrate sex differences in both E2-dependent and E2-independent regulation of the endocannabinoid system and suggest that manipulation of endocannabinoids in vivo could affect physiological and behavioral responses differently in each sex.
SIGNIFICANCE STATEMENT Many brain disorders vary between the sexes, yet the degree to which this variation arises from differential experience versus intrinsic biological sex differences is unclear. In this study, we demonstrate intrinsic sex differences in molecular regulation of a key neuromodulatory system, the endocannabinoid system, in the hippocampus. Endocannabinoids are involved in diverse aspects of physiology and behavior that involve the hippocampus, including cognitive and motivational state, responses to stress, and neurological disorders such as epilepsy. Our finding that molecular regulation of the endocannabinoid system differs between the sexes suggests mechanisms through which experiences or therapeutics that engage endocannabinoids could affect males and females differently.
Keywords: endocannabinoid, estradiol, GABA, metabotropic glutamate receptor
Introduction
Being male or female contributes to the risk of developing neuropsychiatric or neurological disorders. Many brain disorders, including anxiety and depression (Altemus et al., 2014), autism spectrum disorders (Werling and Geschwind, 2013), stroke (Herson et al., 2013), and epilepsy (Savic and Engel, 2014) vary between the sexes in their incidence, clinical manifestations, and/or therapeutic response. How these sex differences arise, for example through differential experience and/or biological differences in the brain intrinsic to one sex or the other, is largely unknown. The possibility of intrinsic sex differences has far-reaching implications for understanding normal brain functions, as well as for the study, diagnosis, and treatment of brain disorders that differ between the sexes.
There is growing awareness that a key modulatory system in the brain, the endocannabinoid (eCB) system, may differ between males and females (Wiley et al., 2008; Reich et al., 2009; Atkinson et al., 2010). eCBs are lipid-derived neuromodulators that influence cognitive, emotional, and motivational states (Zanettini et al., 2011), pain (Maione et al., 2013), responses to stress (Hill and Patel, 2013), and neurological disorders such as epilepsy (Alger, 2004). At a cellular level, eCBs act as retrograde messengers that are released from a postsynaptic neuron to inhibit presynaptic neurotransmitter release from inputs that express cannabinoid receptor 1 (CB1R). The two primary eCBs in the brain, 2-arachidonylglycerol (2-AG) and N-arachidonylethanolamide (AEA, also known as anandamide), are produced tonically or “on demand” by changes in neural activity. Depending on the pattern of activity, eCBs can produce transient or persistent decreases in neurotransmitter release (Castillo et al., 2012).
We recently discovered a sex-specific mechanism of persistent eCB-mediated synaptic modulation in the hippocampus (Huang and Woolley, 2012). Using acute application of 17β-estradiol (E2) to hippocampal slices as a model for neurosteroid E2 actions in the brain, we found that E2 suppresses perisomatic inhibitory synaptic transmission within minutes, specifically in females with no effect in males. This is in contrast to acute E2-induced potentiation of excitatory synaptic transmission, which occurs in both sexes (Kramár et al., 2009; Smejkalova and Woolley, 2010). Additional studies showed that E2-induced suppression of inhibition is mediated by the α form of the estrogen receptor (ERα) and requires CB1Rs, indicating the involvement of eCBs. Consistent with the fact that only a subset of inhibitory inputs in the hippocampus expresses CB1Rs and is therefore sensitive to eCBs (Katona et al., 1999), E2 suppresses inhibition in a subset of recordings (∼55%).
Similar to the most commonly studied form of persistent eCB-mediated synaptic depression, long-term depression of inhibition (iLTD; Chevaleyre and Castillo, 2003), E2-induced suppression of inhibition requires group I mGluR activation (Huang and Woolley, 2012). However, beyond this, little is known about the molecular steps that link E2 activation of ERα to eCB synthesis, or what accounts for the sex specificity of E2-induced suppression of inhibition. Therefore, the goals of the current study were twofold: (1) to define the intracellular signaling that underlies acute E2-induced suppression of inhibition; and (2) to identify where in this pathway males and females differ.
Materials and Methods
Animals and preparation of hippocampal slices.
All experiments were done with gonadectomized young adult (47–57 d of age) male and female Sprague Dawley rats (Harlan). Rats were group housed on a 12 h light/dark cycle with ad libitum access to water and phytoestrogen-free chow. All animal procedures were performed in accordance with the National Institutes of Health Guide to the Care and Use of Laboratory Animals and were approved by the Northwestern University Animal Care and Use Committee. Females were ovariectomized bilaterally under ketamine (85 mg/kg)/xylazine (13 mg/kg) anesthesia and used for experiments 3–7 d after surgery. Males were castrated under the same anesthesia and also were used 3–7 d after surgery. For electrophysiology and biochemistry experiments, rats were anesthetized with sodium pentobarbital (125 mg/kg, i.p.) and perfused transcardially with ice-cold oxygenated (95% O2/5% CO2) sucrose artificial CSF (aCSF) containing the following (in mm): 75 sucrose, 75 NaCl, 2 KCl, 25 NaHCO3, 1.25 NaH2PO4, 2.4 Na pyruvate, 1.3 ascorbic acid, 3 MgCl2, 0.5 CaCl2, and 15 dextrose, pH 7.4. The brain was removed quickly, and 300 μm transverse hippocampal slices were cut using a VT1200S vibratome (Leica). Slices were allowed to recover for 30–60 min at 34–35°C in oxygenated regular aCSF containing the following (in mm): 126 NaCl, 3 KCl, 26 NaHCO3, 1.25 NaH2PO4, 1 MgCl2, 2 CaCl2, and 10 dextrose, pH 7.5 and then were treated for biochemical experiments or maintained in regular aCSF at room temperature (20–22°C) until used for electrophysiological recording or single-cell PCR. For electron microscopy, female rats were anesthetized with sodium pentobarbital and perfused transcardially with 2% paraformaldehyde/2% glutaraldehyde in 0.1 m phosphate buffer (PB). Brains were removed, blocked to contain the hippocampus, postfixed overnight at 4°C, and then cryoprotected with 30% sucrose in PB.
Electrophysiological recording.
Recordings of synaptically evoked GABAA receptor-mediated IPSCs from CA1 pyramidal cells were performed as described previously (Huang and Woolley, 2012). Each slice was transferred to a submersion chamber mounted on a Zeiss Axio Examiner microscope equipped with a water-immersion 40×/1.0 differential interference contrast (DIC) objective and was continuously perfused at 1.5–2.0 ml/min with oxygenated regular aCSF at 34–35°C. CA1 pyramidal cells were visualized using a Sensicam QE CCD camera. Whole-cell patch-clamp recordings were obtained using a MultiClamp 700B amplifier (Molecular Devices) and Clampex 10.2 software (Molecular Devices). Signals were low-pass filtered at 2 kHz and sampled at 5 kHz with a DigiData 1440A interface (Molecular Devices). Recording electrodes had tip resistances ranging from 4 to 6 MΩ when filled with internal solution, which contained the following (in mm): 110 K-gluconate, 25 KCl, 10 HEPES, 0.2 EGTA, 2 MgATP, 0.3 NaGTP, and 10 Na2-creatinine phosphate, pH 7.2–7.3. In some experiments, AM404 [N-(4-hydroxyphenyl)-arachidonamide (2 μm)] or BAPTA [1,2-bis(o-aminophenoxy)ethane-N,N,N′,N′-tetraacetic acid) (20 mm)] was included in the recording pipette. IPSCs were evoked via a glass bipolar stimulating electrode (10–20 μm tip) placed in the CA1 pyramidal cell layer 30–150 μm from the recording electrode and were recorded in the presence of DNQX [6,7-dinitroquinoxaline-2,3-dione (10 μm)], DL-APV [dl-2-amino-5-phosphonopentanoic acid (50 μm)], and CGP55845 [(2S)-3-[(15)-1-(3,4-dichlorophenyl)ethyl]amino-2-hydroxypropyl)(phenylmethyl)phosphinic acid (1 μm)]. The GABAA receptor antagonist SR 95531 [2-(3-carboxypropyl)-3-amino-6-(4-methoxyphenyl)pyridazinium bromide (2 μm)] was applied at the end of each experiment. In most experiments, paired stimulations (0.1 ms) were delivered at 0.067 Hz with a 100 ms interstimulus interval using a WPI stimulus isolation unit. For theta-burst firing (TBF)–iLTD experiments, each TBF episode consisted of 10 bursts of five action potentials at 50 Hz, delivered at 5 Hz; TBF–iLTD was induced by delivering 60 TBF episodes, one every 5 s (Younts et al., 2013). To measure depolarization-induced suppression of inhibition (DSI), cells were depolarized to 0 mV for 5 s. Stock solutions were prepared in DMSO or ddH2O and were diluted in aCSF on the day of recording to the final concentrations indicated. Control aCSF contained an equivalent concentration of DMSO (<0.1%). Drug and/or E2 effects were assessed by averaging IPSCs recorded during the last 2 min before drug application to those recorded during the last 2 min in each condition. CGP55845, SR 95531, U73343 [(1-[6-((17β)-3-methoxyestra-1,3,5(10)-trien-17-yl)amino)hexyl]-2,5-pyrrolidine-dione)], U73122 [(1-[6[[(17β)-3-methoxyestra-1,3,5(10)-trien-17-yl]amino]hexyl]-1H-pyrrole-2,5-dione)], JNJ 16259685 [(3,4-dihydro-2H-pyrano[2,3]β-quinolin-7-yl)(cis-4-methoxycyclohexyl) methanone)], Xestospongin C (Xest), DHPG [(RS)-3,5-dihydroxyphenylglycine], AM404, and BAPTA were purchased from Tocris Bioscience. E2 and URB597 [3′-(aminocarbonyl)[1,1′-biphenyl]-3-yl)-cyclohexylcarbamate] were purchased from Sigma.
Measurement of inositol triphosphate levels.
Each inositol triphosphate (IP3) experiment used hippocampal slices from male and female rats split evenly between treatment groups and time points within sex; 12–14 slices from each rat were used in each experiment, with a total of four slices per treatment/time point. After recovery at 34–35°C in oxygenated regular aCSF, the solution was replaced with fresh aCSF containing vehicle or treatment for various times, as indicated for each experiment. After treatment, slices were transferred immediately to HEPES homogenization buffer containing (in mm): 5 HEPES-KOH, pH 7.2, 320 sucrose, 5 EDTA, 1 Na orthovanadate, 50 NaF, 10 Na pyrophosphate, 20 Na glycerophosphate, 0.1 phenylmethylsulfonyl fluoride, plus the protease inhibitors leupeptin and aprotinin at 1 μg/ml each and 0.2 N perchloric acid to stabilize IP3. Hippocampi were dissected quickly from each slice on ice, sonicated (two times, 3 s pulses) in homogenization buffer, and processed immediately for IP3 assay.
Intracellular levels of IP3 were measured using a Hit-Hunter IP3 Fluorescence Polarization Assay kit (DiscoveRx) according to the instructions of the manufacturer. Cell lysates or IP3 standards were pipetted into a 384-well plate with a nonbinding surface. The IP3 tracer (10 μl) was added to each well, followed by the addition of IP3 binding protein (40 μl). The plate was incubated for 30 min at room temperature in the dark on a shaker, and then the fluorescence polarization signal of the IP3 tracer was detected by a multimode microplate reader (Analyst) with a fluorescence polarization filter, using 485 nm excitation and 530 nm emission wavelengths. The IP3 concentration in each sample was calculated from a standard curve generated with sigmoidal curve fitting.
Coimmunoprecipitation.
Each coimmunoprecipitation (co-IP) experiment used slices from four male and four female rats, 12–14 slices per rat, split evenly between treatment groups within sex. After recovery at 34–35°C in oxygenated regular aCSF, slices were treated with either vehicle or E2 (100 nm) in oxygenated regular aCSF at room temperature for 10 min. After treatment, hippocampi were dissected from each slice and sonicated on ice in HEPES homogenization buffer containing protease inhibitors as above. Tissue homogenates were centrifuged at 1000 × g for 10 min to remove unbroken cells and nuclei. Membrane fractions were prepared by ultracentrifugation of postnuclear supernatant at 100,000 × g for 1 h at 4°C using a fixed angle rotor. Protein concentration was determined using the Bradford protein assay.
Co-IP was performed using a Pierce co-IP kit according to the instructions of the manufacturer. Briefly, 15 μg of primary mouse anti-mGluR1 monoclonal (BD Biosciences) or rabbit anti-mGluR5 polyclonal (Millipore) antibodies were coupled to AminoLink resin containing A/G magnetic beads for 2 h at room temp. After extensive washing to remove unbound antibodies, beads were used for lysate application. All protein samples were first precleared using control beads, and then 300 μg of total protein for each sample was incubated with antibody-coupled beads on a rotator at 4°C overnight. Samples were washed three times and eluted by adding Laemmli sample buffer and boiling for 5 min. No lysate and no antibody controls were included in each experiment.
Western blotting.
Immunoprecipitated samples along with input samples were resolved on 6–10% SDS-PAGE gels and transferred to PVDF membranes. Membranes were blocked with 5% nonfat milk and then incubated with one of the following primary antibodies overnight at 4°C: mouse monoclonal anti-mGluR1 (1:2000; BD Biosciences), rabbit-polyclonal anti-mGluR5 (1:1000; Millipore), rabbit-polyclonal anti-ERα (1:1000, MC-20; Santa Cruz Biotechnology), rabbit polyclonal anti-IP3 receptor (IP3R; 1:1000; Cell Signaling Technology), rabbit polyclonal anti-Homer-1b/c (1:2000; Santa Cruz Biotechnology), or rabbit polyclonal anti-PSD-95 (1:500; Cell Signaling Technology). Membranes were washed in TBS and then in 0.1% Tween 20 in TBS and incubated at room temperature for 1 h with horseradish peroxidase-conjugated anti-mouse or anti-rabbit IgG secondary antibodies (1:1000; Vector Laboratories). Immunoreactivity was visualized using an enhanced chemiluminescence kit (ECL Plus). Films were scanned and imported into Image J (NIH). To obtain ERα/mGluR1, IP3R/mGluR1, and Homer-1b/c/mGluR1 ratios, the OD value of each IP sample band was divided by the OD value of its corresponding input run on the same gel, and then ERα, IP3R, and Homer-1b/c values were divided by mGluR1 values from the same sample.
Electron microscopy.
Tissue from three ovariectomized female rats was prepared for immunoelectron microscopy as described previously (Hart et al., 2007). Briefly, tissue blocks containing the dorsal hippocampus were sectioned at 50 μm using an SM20000R freezing microtome (Leica). Sections were labeled with anti-ERα rabbit polyclonal MC-20 (0.5 μg/ml; Santa Cruz Biotechnology), incubated with anti-rabbit biotinylated IgG (1:800; Vector Laboratories), and visualized with DAB using an ABC kit (Vector Laboratories). Sections were then stained with 1% osmium tetroxide and flat embedded in Eponate resin (Ted Pella). The CA1 region was then dissected from flat-embedded sections and mounted onto BEEM capsules. Series of ultrathin (∼75 nm) sections were cut using a Reichert Ultracut S ultramicrotome (Leica), collected onto Formvar-coated slot grids, stained with 3% uranyl acetate followed by 2.66% Reynold's lead citrate, and imaged with a JEOL 1230 transmission electron microscope equipped with a CCD camera. For each brain, a low-magnification image (400×) of the first section in a series was used to select two regions in the CA1 cell body layer using a random systematic approach. Then, five CA1 pyramidal cell somata within each region (10 per brain) were imaged (20,000×) through five consecutive sections, and images were examined offline for sites of extranuclear ERα immunoreactivity.
Single-cell nested PCR.
Cell collection for single-cell PCR was performed according to the study by Citri et al. (2012) using hippocampal slices from eight female rats prepared as for electrophysiology experiments. The cell bodies of putative CA1 pyramidal cells or interneurons were identified using DIC imaging. A patch pipette with a tip diameter of 1.8–2.0 μm was lowered to the slice with slight positive pressure. Once the pipette tip touched a targeted cell, pressure was relieved and slight suction was applied for gradual aspiration of the cell body. The pipette was withdrawn, and positive pressure was used to expel the contents into a PCR tube containing 4 μl of ultrapure nuclease-free water. Each sample was frozen immediately on dry ice.
Nested PCR was conducted in two steps using separate primer pairs for each step. Primers were designed using the Primer-BLAST designing tool (NIH) and are shown in Table 1, which includes sequences, target locations, and amplicon sizes. In the first step, reverse transcription (RT)-PCR was used to amplify longer fragments from each gene of interest, which was followed by real-time PCR targeting sequences within the amplicons generated by the first RT-PCR step. RT reactions for each cell were performed using the GoScript Reverse Transcription System (Promega). RNA was mixed with 0.5 μl oligo-dT15 Primer and 0.5 μl random primers. Samples were incubated at 70°C for 5 min, followed by immediate chilling on ice for 5 min. The RT master mix consisted of 2 μl of GoScript 5× reaction buffer, 1.5 μl of MgCl2, 0.5 μl of PCR nucleotide mix, 0.25 μl of recombinant RNasin, and 0.5 μl of GoScript reverse transcriptase and was added to each sample for a total volume of 10 μl. Samples were incubated at 25°C for 5 min, 42°C for 1 h, and 70°C for 15 min. The resulting cDNAs were then subjected to multiplex PCR amplification (Price et al., 2005) using all first PCR primer pairs shown in Table 1. Each PCR reaction contained 8 μl of cDNA, 0.08 μl of each forward primer (0.3 μm), 0.08 μl of each reverse primer (0.3 μm), 12.5 μl of GoTaq colorless master mix (Promega), and 2.5 μl nuclease-free water for a total volume of 25 μl, and 20 cycles were run (95°C, 30 s; 62°C, 30 min; 72°C, 1 min). After the first PCR step, samples were cleaned by adding 10 μl of ExoSAP-IT (Affymetrix) and were returned to the PCR machine for 15 min at 37°C to digest primers and dNTPs, followed by 15 min at 80°C to denature the enzyme. Samples were then spun down briefly and diluted (1:100) in nuclease-free water for subsequent real-time PCR.
Table 1.
Primers used for both steps of nested PCR, including sequences, target locations, and amplicon sizes
| Gene | GenBank accession number | First PCR primers | Size (bp) | Second nested PCR primers | Size (bp) |
|---|---|---|---|---|---|
| GAPDH | NM_017008.4 | Sense, 373: TTCACCACCATGGAGAAGGC | 321 | Sense, 468: GGGTGTGAACCACGAGAAATA | 104 |
| Antisense, 693: AGGGATGATGTTCTGGGCTG | Antisense, 571: AGTTGTCATGGATGACCTTGG | ||||
| HPRT | NM_012583.2 | Sense, 514: GTCAAGCAGTACAGCCCCAA | 256 | Sense, 567: GACCTCTCGAAGTGTTGGATAC | 107 |
| Antisense, 769: TGGCCACATCAACAGGACTC | Antisense, 673: TCAAATCCCTGAAGTGCTCAT | ||||
| mGluR1 (pan) | NM_017011.1 | Sense, 1652: AACATGCACCATGCTCTGTG | 205 | Sense, 1682: GTGGGCCTGTGTGATGCTAT | 93 |
| Antisense, 1856: AGTCATAGCGATTAGCTTCTGTG | Antisense, 1774: CTCCTCTCCAGACACTCCGA | ||||
| mGluR1a-1 | NM_017011.1 | Sense, 2934: CTGATGTTGTCCGCATGCAC | 210 | Sense, 2934: CTGATGTTGTCCGCATGCAC | 113 |
| Antisense, 3143: CCGTCTCGTTGGTCTTCACG | Antisense, 3046: GCCGTTAGAATTGGCATTCCC | ||||
| mGluR1a-2 | NM_017011.1 | Sense, 2934: CTGATGTTGTCCGCATGCAC | 210 | Sense, 3026: GGGAATGCCAATTCTAACGGC | 118 |
| Antisense, 3143: CCGTCTCGTTGGTCTTCACG | Antisense, 3143: CCGTCTCGTTGGTCTTCACG | ||||
| mGluR1a-3 | NM_017011.1 | Sense, 5662: TCTCTTCCTTATGATCCTCATGTGT | 276 | Sense, 5843: TGTGAGATGAACCCGTTCCC | 91 |
| Antisense, 5937: AGAAACCAGCAGCTTCGACA | Antisense, 5933: ACCAGCAGCTTCGACATGAA | ||||
| mGluR1a-4 | NM_017011.1 | Sense, 5662: TCTCTTCCTTATGATCCTCATGTGT | 276 | Sense, 5781: TGACCCTACCTTTTCGAACCC | 92 |
| Antisense, 5937: AGAAACCAGCAGCTTCGACA | Antisense, 5872: ACCCGTTCCCTTTAAATAAT | ||||
| mGluR5 | NM_017012.1 | Sense, 2711: GCATGTTTGTCCCGAAGGTG | 231 | Sense, 2797: ATGCATGTAGGAGACGGCAA | 110 |
| Antisense, 2941: CCAGAATGAGAAGAGTACCC | Antisense, 2906: TTTCCGTTGGAGCTTAGGGT | ||||
| ERBB4 | NM_021687.1 | Sense, 682: TGTGATGGCAGGTGCTATGG | 368 | Sense, 717: CTGCTGCCATCGAGAATGTG | 120 |
| Antisense, 1049: GTGCCGATTCCATCACATGC | Antisense, 836: GTGCCGATTCCATCACATGC | ||||
| vGAT | AF030253.1 | Sense, 1783: ACCTCCGGTTCCTAGTTGCT | 337 | Sense, 1888: ACATCGTCCTGATTTGGGGG | 117 |
| Antisense, 2119: TGGCTGGACGCAGTAGATTC | Antisense, 2004: ACCCCTAACATTGACTGGAGC | ||||
| GAD65 | NM_012563.1 | Sense, 771: GGCTCTGGCGATGGAATCTT | 306 | Sense, 798: GGTGGTGCCATCTCCAACAT | 116 |
| Antisense, 1076: GGCACTCACCAGGAAAGGAA | Antisense, 913: TGCTCTGACGTGAATGCGAT | ||||
| GFAP | NM_017009.2 | Sense, 961: GAGTTACCAGGAGGCACTCG | 300 | Sense, 1098: AATTGCTGGAGGGCGAAGAA | 112 |
| Antisense, 1260: TTAATGACCTCGCCATCCCG | Antisense, 1209: TTGAGGTGGCCTTCTGACAC |
In the first step of nested PCR, RT-PCR was used to amplify longer fragments from each gene of interest, which was followed by real-time PCR targeting sequences within the amplicons generated by the first RT-PCR step.
Real-time PCR for the second step was run in duplicates in a 384-well plate by mixing 1.2 μl of cDNA and 1.2 μl of GoTaq real-time PCR master mix (Promega) using a Mosquito LCP automated liquid handler (TTP Labtech) and then adding 10 nl of each primer pair mix (200 nm each primer) with an Echo Liquid Handler (Labcyte). PCR was performed using the following program: 95°C for 5 min, 40 cycles of 95°C for 15 s, and 62°C for 1 min, followed by a melt curve analysis (95°C for 15 s, 62 to 95°C with 0.5°C intervals, 30 s per interval).
To determine primer specificity, mRNA was isolated from whole hippocampus of a female rat using a Purelink RNA Mini Kit (Ambion) according to the instructions of the manufacturer. The nested PCR products were run on a 2% agarose gel at 120 V for 1 h and viewed with a gel imager (Bio-Rad). To assess nested primer efficiencies for real-time PCR, four sequential dilutions (0.01–10 ng) of cDNA derived from whole hippocampal mRNA were run in duplicate. Amplification efficiencies for all primer pairs were between 98 and 100%. Based on the standard curve generated for determination of primer efficiencies, the limit of detection for each PCR product was determined (Caraguel et al. 2011) and used to set an overall detection threshold of Ct ≤ 35. Thus, for each cell, PCR products that were detected within 35 cycles were designated as +, and targets that showed no amplification or required >35 cycles were designated as −. The following controls were included each time single-cell nested PCR was run: no cDNA, aCSF alone, and cell contents without RT to exclude the possibility that the primers amplified nuclear DNA. None of these controls resulted in amplification of any target.
Statistical analyses.
All data are reported as mean ± SEM. For electrophysiological experiments, n is the number of cells, with one to two cells recorded per animal. For biochemical experiments, n is the number of independent runs of each experiment. The Shapiro–Wilk test was used to determine that data were normally distributed. Statistical comparisons for electrophysiology and co-IP results were made using two-tailed paired Student's t tests. For IP3 levels, two-way mixed ANOVA and one-way ANOVA were followed by Tukey's post hoc tests. Distributions of responsive and nonresponsive cells were compared using χ2 tests. Significance was determined at p < 0.05.
Results
E2 occludes mGluR-mediated suppression of inhibition
We first verified the effect of E2 to suppress a subset of inhibitory synapses in females and tested whether these are the same synapses suppressed by group I mGluR activation, which is known to stimulate eCB synthesis (Ohno-Shosaku et al., 2002). We recorded IPSCs in CA1 pyramidal cells evoked by paired-pulse stimulation in the cell body layer and applied E2 (100 nm) either before or in the presence of the group I mGluR agonist DHPG (50 μm). In five of nine recordings (55%) in which E2 was applied first (Fig. 1A), E2 rapidly decreased IPSC amplitude by 54 ± 3%, and DHPG applied after E2 produced no additional decrease (−8 ± 5%; Fig. 1B), demonstrating that E2 occluded DHPG-induced suppression of inhibition. In parallel with decreasing IPSC amplitude, E2 increased the paired-pulse ratio (PPR; p < 0.01), indicating reduced presynaptic GABA release probability, and DHPG applied after E2 did not increase PPR any further (Fig. 1C). In the four recordings in which E2 had no effect on IPSC amplitude (2 ± 3%; Fig. 1D) or PPR, DHPG also had no effect on IPSC amplitude (4 ± 3%) or PPR. In the converse experiment, DHPG was applied before E2 (Fig. 1E). In 8 of 13 recordings (62%), DHPG decreased IPSC amplitude by 47 ± 4% (Fig. 1F) and increased PPR (p < 0.05; Fig. 1G), and E2 applied in the presence of DHPG had no additional effect on IPSC amplitude (−8 ± 2%; Fig. 1F) or PPR (Fig. 1G). In the five recordings that did not respond to DHPG, E2 also had no effect on IPSC amplitude (−0.6 ± 3%; Fig. 1H) or PPR.
Figure 1.
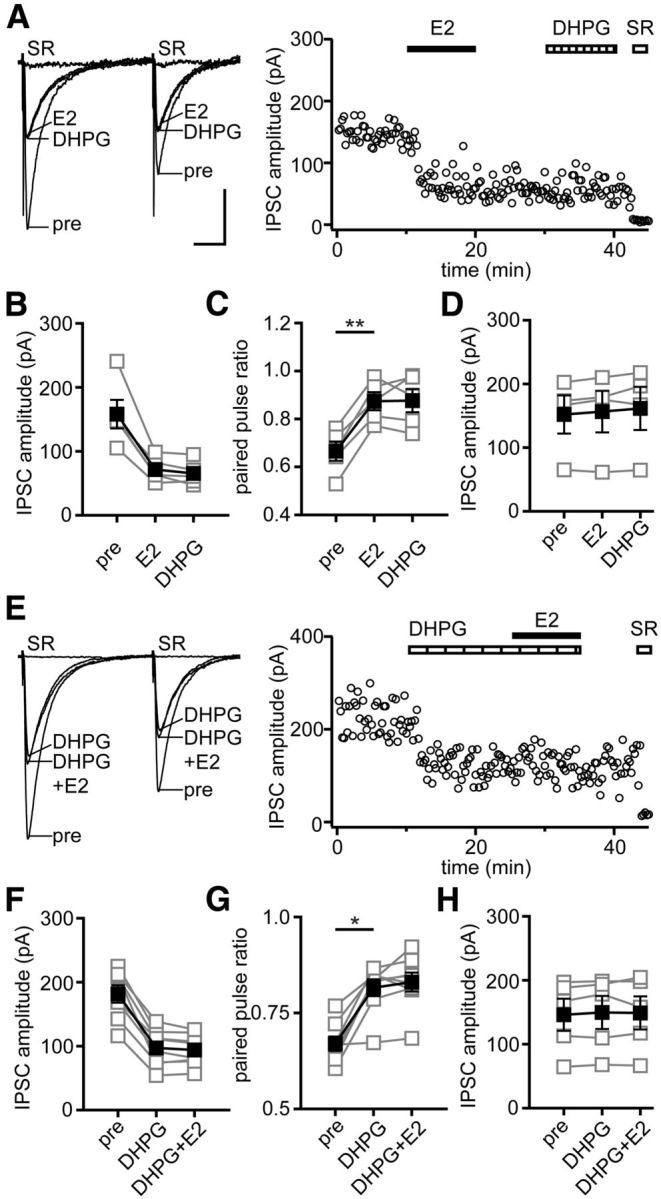
Mutual occlusion of E2- and DHPG-induced suppression of inhibition. A, Individual traces and time course of IPSC suppression in a representative experiment in which E2 (100 nm) was applied before DHPG (group I mGluR agonist, 50 μm). E2 occluded DHPG-induced IPSC suppression. Each point in the time course is an individual sweep, and SR 95531 (SR; 2 μm) applied at the end of the experiment blocked IPSCs (also in E). B, Group IPSC amplitude data for experiments with E2-responsive IPSCs (n = 5). Connected open symbols are individual cells; filled symbols are mean ± SEM for all cells (also in C, D, F–H). C, Group PPR data for the same cells as in B; **p < 0.01, paired t test. D, Group IPSC amplitude data for E2- and DHPG-nonresponsive experiments (n = 4). E, Individual traces and time course of IPSC suppression in a representative experiment in which DHPG was applied before E2. DHPG occluded E2-induced IPSC suppression. F, Group IPSC amplitude data for all DHPG-responsive experiments (n = 8). G, Group PPR data for the same cells as in F; *p < 0.05, paired t test. H, Group IPSC amplitude data for DHPG- and E2-nonresponsive experiments (n = 5). Calibration: A, 50 pA, 25 ms (also applies to E).
Together, these experiments showed that E2 and group I mGluR activation each mimic and occlude the effects of the other to suppress inhibition. Because E2-nonresponsive IPSCs also showed no response to DHPG and vice versa, the subset of inhibitory synapses that is suppressed by E2 is likely the same subset that is suppressed by group I mGluR activation.
E2 occludes eCB-mediated iLTD triggered by TBF
E2-induced IPSC suppression is blocked by a CB1R antagonist and occluded by a CB1R agonist (Huang and Woolley, 2012), indicating that eCB signaling is involved. The mGluR dependence of E2's effect and its persistence after E2 washout resemble synaptically evoked iLTD, which lasts for at least 30 min after induction (Chevaleyre and Castillo, 2003). However, synaptically evoked iLTD in CA1 is typically induced using trains of stimulation in the dendritic layer and is restricted to dendritic synapses, where released glutamate can activate mGluRs. In contrast, E2-induced suppression of inhibition occurs at perisomatic synapses. Thus, to verify the effects of E2 to induce eCB-dependent suppression of perisomatic inhibitory synapses, we tested whether E2 occludes TBF–iLTD and vice versa. TBF–iLTD is a form of persistent eCB-dependent suppression of inhibitory synapses that affects both somatic and dendritic inputs (Younts et al., 2013).
In the first set of experiments, E2 (100 nm) was applied before TBF–iLTD was induced 15 min later (Fig. 2A). In 6 of 12 recordings (50%), E2 decreased IPSC amplitude by 43 ± 2% (Fig. 2B) and increased PPR (p < 0.05; Fig. 2C). TBF after E2 failed to further affect IPSC amplitude (−4 ± 3%) or PPR (Fig. 2B,C), indicating that E2 occluded TBF–iLTD. In the other six recordings, neither E2 nor TBF had any effect on IPSC amplitude (Fig. 2D) or PPR. In the converse experiment, TBF–iLTD was induced first and then E2 (100 nm) was applied 10 min later (Fig. 2E). In 6 of 15 recordings (40%), TBF decreased IPSC amplitude by 40 ± 4% (Fig. 2F) and increased PPR (p < 0.01; Fig. 2G); E2 applied after TBF produced no additional decrease in IPSC amplitude (2 ± 3%) or change in PPR (Fig. 2F,G), showing that E2-induced suppression of inhibition was occluded by prior TBF. In seven recordings, TBF had no effect on IPSC amplitude (−1 ± 2%), and E2 applied after TBF also had no effect on IPSCs (Fig. 2H). However, in the remaining two recordings, there was a dissociation between TBF and E2 effects on IPSCs; in these experiments, TBF failed to decrease IPSC amplitude (1 ± 2%), but E2 applied after TBF decreased IPSC amplitude by 39 ± 8% and increased PPR from 0.5 ± 0.05 to 0.7 ± 0.03 (data not shown). Thus, with the exception of two (of 27) recordings, E2 and TBF each mimicked and occluded the effects of the other to suppress inhibition.
Figure 2.
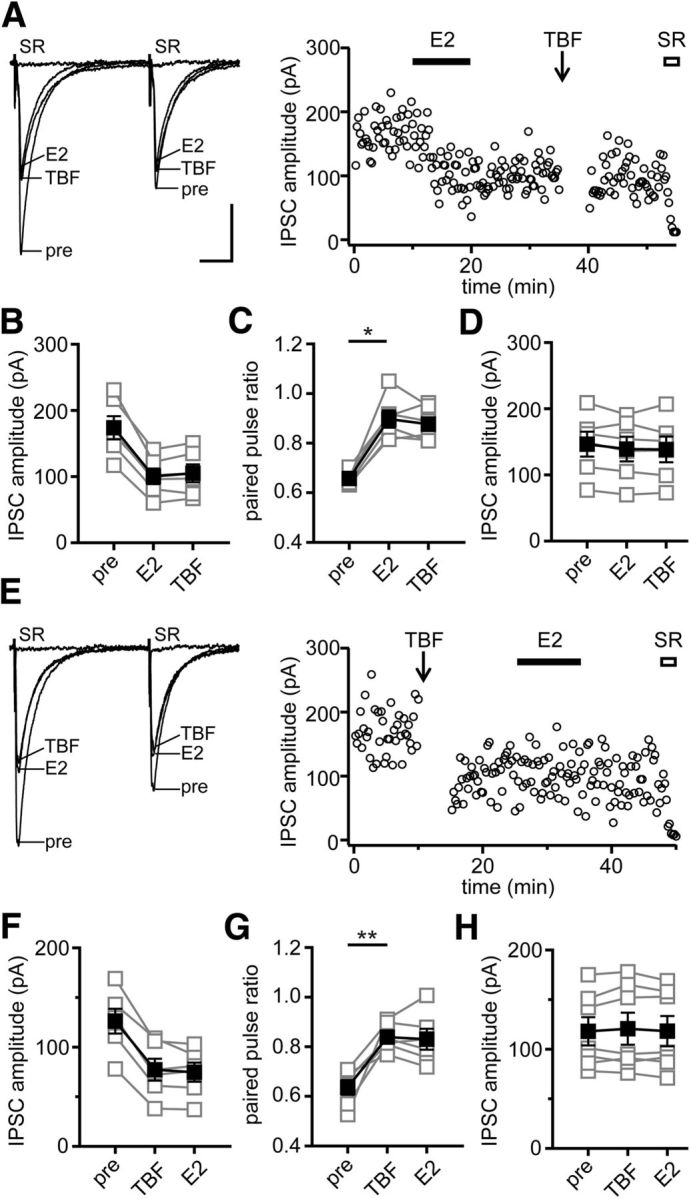
Mutual occlusion of E2- and TBF-induced suppression of inhibition. A, Individual traces and time course of IPSC suppression in a representative experiment in which E2 (100 nm) was applied before delivering TBF stimulation. E2 occluded TBF-induced iLTD. Each point in the time course is an individual sweep, and SR 95531 (SR; 2 μm) applied at the end of the experiment blocked IPSCs (also in E). B, Group IPSC amplitude data for experiments with E2-responsive IPSCs (n = 6). Connected open symbols are individual cells; filled symbols are mean ± SEM for all cells (also in C, D, F–H). C, Group PPR data for the same cells as in B; *p < 0.05, paired t test. D, Group IPSC amplitude data for E2- and TBF-nonresponsive experiments (n = 6). E, Individual traces and time course of IPSC suppression in a representative experiment in which TBF was delivered before E2. TBF occluded E2-induced IPSC suppression. F, Group IPSC amplitude data for all TBF-responsive experiments (n = 6). G, Group PPR data for the same cells as in F; **p < 0.01, paired t test. H, Group IPSC amplitude data for TBF- and E2-nonresponsive experiments (n = 7). Not shown are two cells that failed to respond to TBF but did respond to E2 (see Results). Calibration: A, 50 pA, 25 ms (also applies to E).
Together, these experiments corroborated previous evidence that E2-induced suppression of inhibition depends on group I mGluR signaling leading to the mobilization of eCBs to suppress GABA release at a subset of inhibitory synapses. We next investigated what signaling downstream of group I mGluRs is required for E2-induced IPSC suppression.
E2-induced suppression of inhibition requires phospholipase C
Group I mGluRs are Gαq coupled and lead to activation of phospholipase C (PLC), which is required for synaptically evoked mGluR-dependent iLTD (Chevaleyre and Castillo, 2003; Hashimotodani et al., 2005). We tested whether PLC is required for E2-induced suppression of IPSCs by applying E2 (100 nm) in the presence of the PLC inhibitor U73122 or its inactive analog U73343 (both 10 μm). Because ∼45% of recordings are not responsive to E2, it was necessary to apply E2 alone after U73122 washout to confirm E2 responsiveness of IPSCs in each experiment (Fig. 3A). In 7 of 12 recordings (58%), E2 had no effect on IPSCs in the presence of U73122 (4 ± 3%) but decreased IPSC amplitude by 43 ± 3% (Fig. 3B) and increased PPR (p < 0.01; Fig. 3C) after U73122 washout. The remaining five recordings with U73122 were not responsive to E2 (2 ± 4% change in IPSC amplitude; Fig. 3D). As expected, the inactive analog U73343 had no effect on IPSCs on its own (2 ± 2%) and failed to block E2-induced IPSC suppression (Fig. 3E) or the increase in PPR when applied in combination with E2. In 7 of 12 recordings with U73343 (58%), E2 decreased IPSC amplitude by 48 ± 3% (Fig. 3F) and increased PPR (p < 0.01; Fig. 3G). The remaining five recordings in U73343 showed no response to E2 (Fig. 2H). These experiments demonstrated that PLC activation is required for E2-induced suppression of inhibition.
Figure 3.
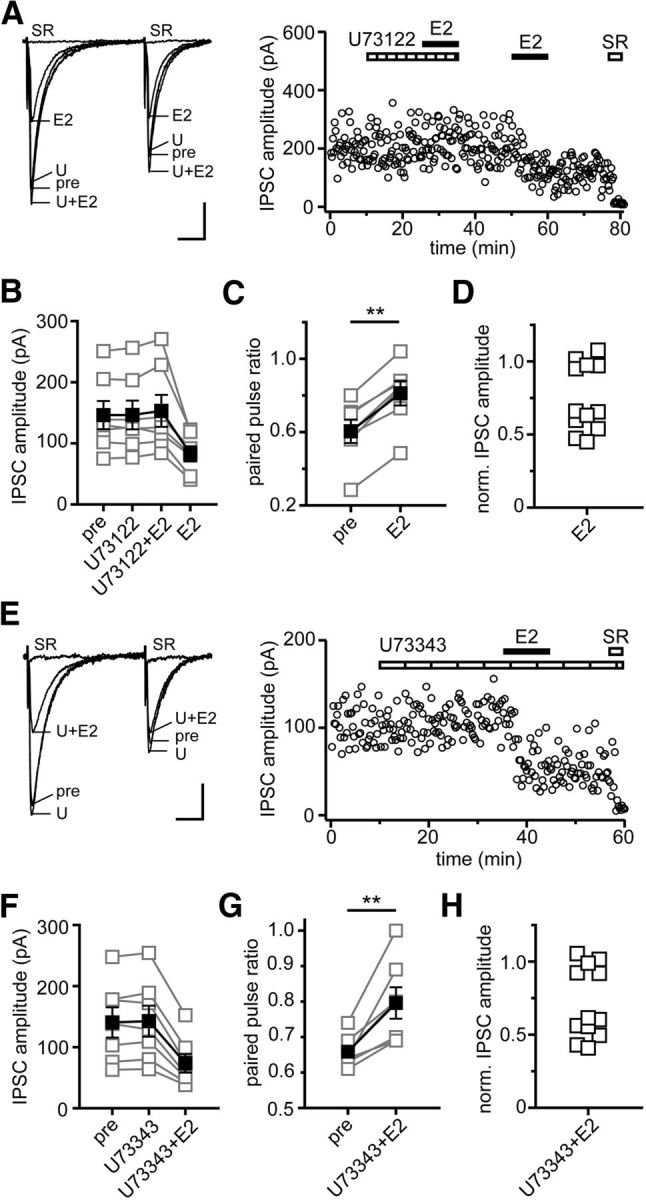
E2-induced suppression of inhibition requires PLC. A, Individual traces and time course of IPSC suppression in a representative experiment in which E2 (100 nm) was applied first in the presence of U73122 (U; PLC inhibitor, 10 μm) and then again after U73122 washout to confirm E2 responsiveness of IPSCs. U73122 blocked E2-induced IPSC suppression. Each point in the time course is an individual sweep, and SR 95531 (SR; 2 μm) applied at the end of the experiment blocked IPSCs (also in E). B, Group IPSC amplitude data for experiments with E2-responsive IPSCs (n = 7). Connected open symbols are individual cells; filled symbols are mean ± SEM for all cells (also in C, F, G). C, Group PPR data for the same cells as in B; **p < 0.01, paired t test. D, Normalized IPSC amplitude for E2-responsive (n = 7, same as in B and C) and E2-nonresponsive (n = 5) experiments. E, Individual traces and time course of IPSC suppression in a representative experiment in which E2 was applied in the presence of U73343 (an inactive analog of U73122, 10 μm). E2 decreased IPSC amplitude in the presence of U73343. F, Group IPSC amplitude data for all E2-responsive experiments (n = 7). G, Group PPR data for the same cells as in F; **p < 0.01, paired t test. H, Normalized IPSC amplitude for E2-responsive (n = 7, same as in F and G) and E2-nonresponsive (n = 5) experiments in the presence of U73343. Calibration: A, 50 pA, 25 ms; E, 25 pA, 25 ms.
Sex difference in acute E2 regulation of intracellular IP3 levels
We next addressed what signaling downstream of PLC is activated by E2 and whether this differs between males and females. Activation of PLC cleaves phosphatidylinositol 4,5-bisphosphate into diaceylglycerol (DAG) and IP3. DAG is a precursor of one principal eCB, 2-AG, which is a product of DAG lipase; however, E2-induced IPSC suppression is unaffected when 2-AG synthesis is blocked by a DAG lipase inhibitor (Huang and Woolley, 2012). Therefore, we focused on the alternative product of PLC activity, IP3, which binds to the IP3R to stimulate release of Ca2+ from intracellular stores (Furuichi et al., 1989) and can also stimulate eCB synthesis (Di Marzo et al., 1994; Fino et al., 2010).
We used a fluorescence polarization assay (Jin et al., 2013) to measure IP3 levels in hippocampal slices. As a positive control, we first tested how DHPG affects IP3 levels. Hippocampal slices were prepared from male and female rats and treated with vehicle or DHPG (100 μm) for 0, 5, 10, 15, 20, 30, or 60 s. As expected (Nakamura et al., 2000), DHPG induced a robust, transient increase in IP3. At elevated temperature (34°C, n = 3 independent experiments), the DHPG-induced increase in IP3 was essentially identical in males (9.7-fold; Fig. 4A) and females (9.8-fold; Fig. 4B), in both cases peaking at 15 s and returning to baseline by 30 s; at room temperature (n = 2 independent experiments), the increase was similar in magnitude (9.5-fold for both sexes) but peaked later, at 20 s (data not shown). There were no sex differences in basal IP3 levels (males, 2.4 ± 0.2 nm; females, 2.8 ± 0.02 nm; p = 0.172) or in peak levels after DHPG stimulation (males, 23.2 ± 2.5 nm; females, 27.5 ± 1.4 nm; p = 0.818).
Figure 4.

Sex difference in E2-induced generation of IP3. A, Fold change in intracellular IP3 levels measured in hippocampal slices from male rats treated with vehicle (veh) or DHPG (100 μm) for 0, 5, 10, 15, 20, 30, or 60 s. Connected open symbols are independent experiments (n = 3); filled symbols are mean ± SEM for all experiments (also in B–D). DHPG increased IP3 levels by 9.7-fold in males peaking at 15 s and returning to baseline by 30 s. B, Fold change in intracellular IP3 levels measured in hippocampal slices from female rats treated exactly as in A (n = 3). Similar to males, DHPG increased IP3 levels by 9.8-fold in females, peaking at 15 s and returning to baseline by 30 s. C, Fold change in intracellular IP3 levels measured in hippocampal slices from male and female rats treated with vehicle or E2 (100 nm) for 0, 10, 15, 30, 60, or 90 s (n = 3 in each sex). E2 increased IP3 levels in both sexes but to a much greater extent in females (7.3-fold) than males (2.6-fold). Two-way ANOVA with repeated measures showed significant effects of treatment (p < 0.001), sex (p < 0.001), and a treatment × sex interaction (p < 0.001). D, Fold change in intracellular IP3 levels measured in hippocampal slices from female rats pretreated with vehicle or JNJ 16259685 (JNJ; mGluR1 antagonist, 0.2 μm) each followed by the addition of vehicle or E2 (100 nm) for 0, 10, 15, 30, 60, or 90 s (n = 2). JNJ 16259685 blocked the E2-induced increase in IP3 (p < 0.05 one-way repeated-measures ANOVA, followed by Tukey's post hoc test).
E2 also increased IP3 levels, but in contrast to experiments with DHPG, there was a clear sex difference. Based on pilot experiments indicating that the E2-induced increase in IP3 was slower than with DHPG, we tested E2 (100 nm, 34°C) at 0, 10, 15, 30, 60, or 90 s (n = 3 independent experiments). This showed that E2 increased IP3 levels in both sexes but to a much greater extent in females (7.3-fold) than males (2.6-fold; Fig. 4C). In both sexes, E2-induced IP3 peaked at 30 s and returned to baseline by 60 s. As with DHPG experiments, there was no sex difference in basal IP3 levels (males, 3.8 ± 0.3 nm; females, 3.0 ± 0.09 nm; p = 0.522). However, E2 increased IP3 levels to 21.9 ± 0.6 nm in females but only 9.7 ± 0.9 nm in males. Two-way ANOVA with repeated measures confirmed significant effects of treatment (F(1,8) = 426.6, p < 0.001), sex (F(1,8) = 222.1, p < 0.001), and a treatment × sex interaction (F(1,8) = 98.7, p < 0.001). Next, because the E2-induced IPSC suppression that occurs in females is blocked by either the mGluR1 antagonist JNJ 16259685 or the mixed mGluR1/5 antagonist CPCCOEt but not by the mGluR5 antagonist MPEP (Huang and Woolley, 2012), we tested whether JNJ 16259685 also inhibited E2-induced IP3 generation in females. Slices were pretreated with JNJ 16259685 (0.2 μm) or vehicle for 15 min and then exposed to vehicle or E2 for 0, 10, 15, 30, 60, or 90 s (n = 2 independent experiments). This showed that JNJ 16259685 completely blocked the E2-induced increase in IP3 (Fig. 4D; F(3,7) = 29.6, p < 0.05, one-way repeated-measures ANOVA, followed by Tukey's post hoc test).
Together, these experiments demonstrated that E2 acutely increases IP3 levels to a significantly greater extent in females than males and that this effect in females requires mGluR1. That DHPG produced nearly identical increases in IP3 in both sexes indicates that mGluR to PLC signaling itself does not differ between the sexes.
E2 acutely promotes ERα–mGluR1a interaction in females but not males
As noted previously, E2-induced suppression of inhibition involves ERα. To investigate whether the sex specificity of E2-induced IPSC suppression arises upstream of mGluR–PLC signaling, we used co-IP to test for E2 regulation of an interaction between ERα and mGluR1. We prepared hippocampal slices from adult male and female rats and treated half the slices from each animal with E2 (100 nm) or vehicle for 10 min to parallel electrophysiology experiments. We then prepared membrane fractions from these slices and subjected them to IP using anti-mGluR1a. Input and IP samples from males and females were run together on the same gel, along with a no-lysate control, and Western blots were probed for ERα, PSD-95 (as a negative control), or mGluR1a (Fig. 5A). Quantification of five independent runs of this experiment showed that E2 increased the levels of ERα associated with mGluR1a in females (p < 0.05), but not in males, without affecting mGluR1a itself in either sex (Fig. 5B). Comparing the ratio of ERα to mGluR1a within each experiment (Fig. 5C) confirmed that E2 increased the ERα/mGluR1a ratio in females in all five experiments (p < 0.05), with no effect in males. PSD-95 showed no interaction with mGluR1a (Fig. 5A), confirming the specificity of the co-IP procedure. The no-lysate control was used to identify anti-mGluR1a antibody chains that were also eluted and detected by Western blot in the IP samples. Together, these experiments demonstrated that E2 promotes a physical interaction between ERα and mGluR1a in the female, but not male, hippocampus.
Figure 5.

E2 acutely promotes ERα–mGluR1 interaction in females but not males. A, Hippocampal slices from male and female rats were treated with either E2 (100 nm) or vehicle (veh) for 10 min. Membrane fractions were prepared from these slices and subjected to IP using anti-mGluR1a. Representative Western blots (WB) of input and IP samples from males and females on the same gel including a no-lysate control are shown. Blots were probed for ERα, PSD-95 (negative control), and mGluR1a. B, Mean ± SEM of ERα and mGluR1 levels in males and females (n = 5 independent experiments). E2 increased the levels of ERα associated with mGluR1a in females, but not in males, without affecting mGluR1a levels in either sex; *p < 0.05, Student's t test. C, ERα/mGluR1 ratio for the same five experiments as in B (see Materials and Methods). Connected open symbols are individual experiments; filled symbols are mean ± SEM for all experiments. E2 increased ERα/mGluR1 ratio in females with no effect in males; *p < 0.05, paired t test. D, Hippocampal slices from female rats were treated either with E2 (100 nm) or vehicle for 10 min. Membrane fractions were prepared from these slices and subjected to IP using anti-mGluR5. Representative Western blots of input and IP samples probed for ERα and mGluR5 are shown. No interaction was detected between ERα and mGluR5 in either of the IP samples. E, Representative electron micrographs of three serial sections (E1–E3) showing ERα immunoreactivity (ERα-IR) located in patches along the CA1 pyramidal cell somatic plasma membrane. Note endoplasmic reticulum associated with ERα–IR and an axonal varicosity apposed to the soma near ERα–IR. Scale bar: E3, 500 nm (applies to all panels).
Although multiple studies point to ERα–mGluR1 interaction as being important in mediating acute E2 actions (Dewing et al., 2007; Huang and Woolley, 2012; Boulware et al., 2013), other studies indicate that mGluR5 plays the predominant role in eCB-mediated retrograde suppression of IPSCs in the hippocampus (Katona et al., 2006; Tanimura et al., 2010). Thus, we used the same co-IP approach in slices from females to investigate ERα interaction with mGluR5. However, in three independent experiments, we detected no interaction between ERα and mGluR5 and no effect of E2 (Fig. 5D). This lack of ERα interaction with mGluR5 corroborates electrophysiological evidence that mGluR1 and not mGluR5 mediates E2-induced suppression of inhibition.
Extranuclear ERα has been reported presynaptically and postsynaptically in the CA1 region, in both pyramidal cells and interneurons (Milner et al., 2001; Hart et al., 2007). To investigate whether ERα detected in co-IP analysis of membrane fractions could be associated with CA1 pyramidal cell somatic plasma membranes, we evaluated ERα immunolabeling in 30 CA1 pyramidal cell somata, 10 from each of three ovariectomized female rats. This showed patches of ERα labeling along the inner side of the somatic plasma membrane (Fig. 5E), often associated with the endoplasmic reticulum. ERα labeling was also observed associated with the Golgi apparatus and in a subset of axonal boutons, as has been reported previously (Hart et al., 2007). Thus, ERα detected in co-IP experiments could reflect ERα localized at the somatic plasma membrane of CA1 pyramidal cells, at least in part, but could also include other membrane compartments as well.
E2 acutely promotes mGluR1a–IP3R interaction in females but not males
Group I mGluRs are physically coupled to IP3Rs and regulate Ca2+ signaling in CA1 pyramidal cells (El-Hassar et al., 2011). Our findings that E2 acutely stimulates IP3 synthesis more robustly in females (7.3-fold) than males (2.6-fold) suggested that E2 might modulate an mGluR1–IP3R interaction differentially in males and females. To investigate this, we used co-IP in hippocampal slices to test whether E2 influences interaction between mGluR1 and IP3R, using the same approach as in experiments investigating ERα–mGluR1 interaction (Fig. 5). Hippocampal slices from males and females were treated for 10 min with E2 (100 nm) or vehicle, and then membrane fractions were subjected to IP using anti-mGluR1a. Samples from each experiment were run together on the same gel, and Western blots were probed for IP3R and mGluR1 (Fig. 6A); in a subset of experiments, we also probed for Homer-1b/c (see below). Quantification of six independent experiments showed that E2 increased the levels of IP3R associated with mGluR1 in females (p < 0.01), but not in males, without affecting mGluR1 in either sex (Fig. 6B). Comparing IP3R to mGluR1 ratios (Fig. 6C) confirmed that, in all six experiments, E2 increased the IP3R/mGluR1 ratio in females (p < 0.01), with no effect in males.
Figure 6.

E2 acutely promotes mGluR1–IP3R interaction in females but not males. A, Hippocampal slices from male and female rats were treated either with E2 (100 nm) or vehicle (veh) for 10 min. Membrane fractions were prepared from these slices and subjected to IP using anti-mGluR1a. Representative Western blots (WB) of input and IP samples from males and females on the same gel are shown. The blots were probed for IP3R, Homer-1b/c and mGluR1. B, Mean ± SEM of IP3R and mGluR1 levels in males and females (n = 6 independent experiments). E2 increased the levels of IP3R associated with mGluR1a in females, but not in males, without affecting mGluR1a levels in either sex; **p < 0.01, Student's t test. C, IP3R/mGluR1 ratio for the same six experiments as in B (see Materials and Methods). Connected open symbols are individual experiments (n = 6); filled symbols are mean ± SEM for all experiments. E2 increased the IP3R/mGluR1 ratio in females with no effect in males; **p < 0.01, paired t test. D, Individual traces and time course of IPSC suppression in a representative experiment in which E2 (100 nm) was applied first in the presence of Xest (IP3R inhibitor, 2 μm) and then again after Xest washout to confirm E2 responsiveness of IPSCs. Dotted line shows average IPSC amplitude during 2 min before the second E2 application. Xest blocked E2-induced IPSC suppression. Each point in the time course is an individual sweep, and SR 95531 (SR; 2 μm) applied at the end of the experiment blocked IPSCs. E, Group IPSC amplitude data for all experiments with E2-responsive IPSCs (n = 4). Connected open symbols are individual cells; filled symbols are mean ± SEM for all cells. Calibration: D, 25 pA, 25 ms.
Studies in multiple cell types have demonstrated that Homer proteins associate with mGluR1 in complex with the IP3R (Tu et al., 1998; Hu et al., 2012). In particular, long-form Homers, such as Homer-1b/c, tether mGluRs in close proximity to IP3Rs and promote IP3R signaling (Kammermeier, 2008; Hayashi et al., 2009). Thus, in four experiments, we also probed blots for Homer-1b/c. However, as for the IP3R, we found no sex differences in vehicle-treated slices and that E2 increased the Homer-1b/c/mGluR1 ratio in females 38 ± 9% (range 13–56%, p = 0.05), with no effect in males (0.3 ± 4%; range −12–7%; data not shown).
E2-induced suppression of inhibition requires the IP3R
Having shown that ERα, mGluR1, and IP3R form a complex that is sensitive to E2 specifically in females and that E2 acutely increases IP3 levels to a greater extent in females than males, we next investigated whether the IP3R is required for E2-induced suppression of IPSCs in females. The synthesis of eCBs is known to be Ca2+ dependent (Di Marzo et al., 1994), and Ca2+ release from intracellular stores, such as through the IP3R, regulates eCB synthesis (Hashimotodani et al., 2007).
We tested whether the IP3R inhibitor Xestospongin C (2 μm) blocks E2-induced suppression of inhibition by applying E2 (100 nm) in the presence of Xest and then again after Xest washout to confirm E2 responsiveness of IPSCs (Fig. 6D). In four of seven recordings (57%), blocking the IP3R with Xest itself increased IPSC amplitude by 107 ± 20%, without affecting PPR, consistent with previous reports that Xest increases postsynaptic sensitivity to GABA (Yu et al., 2006). Importantly, E2 applied in the presence of Xest had no effect on IPSC amplitude (−1 ± 3%) yet decreased IPSC amplitude by 43 ± 3% when applied a second time after Xest washout (Fig. 6E). In parallel, the second application of E2 increased PPR from 0.66 ± 0.02 to 0.81 ± 0.05 (p < 0.05). The three cells that did not respond to Xest (7 ± 0.7% change in IPSC amplitude) also showed no response to E2 (4 ± 2% change in IPSC amplitude; data not shown). Thus, the IP3R is required for E2-induced IPSC suppression.
A subset of CA1 pyramidal cells expresses mGluR1a mRNA
Our results so far indicated that E2-induced suppression of inhibition occurs through ERα–mGluR1–PLC–IP3–IP3R signaling. The simplest model to explain these results posits that this pathway is activated in postsynaptic CA1 pyramidal cells to mobilize eCBs from these cells. The presence of ERα at CA1 pyramidal cell somatic membranes is consistent with this idea. However, one caveat is that previous immunostaining (Baude et al., 1993) and in situ hybridization (Shigemoto et al., 1992) studies show little to no mGluR1 expression in CA1 pyramidal cells. Thus, either the pathway we have described is active in some other cell type leading to suppression of inhibitory synapses on CA1 pyramidal cells or CA1 pyramidal cells express mGluR1 that is not detected by antibody staining or in situ hybridization. To investigate this further, we used single-cell nested PCR to test for mGluR1a mRNA expression in individual CA1 pyramidal cells from ovariectomized female rats. For the first RT-PCR step in this procedure, primers were designed to target three distinct regions in the mGluR1a mRNA sequence: (1) the N-terminal region common in all splice variants (Kosinski et al., 1998); (2) the splicing region; and (3) the C-terminal region that contains the recognition site for the mGluR1a antibody used in co-IP experiments. In the second real-time PCR step, five separate pairs of nested PCR primers were designed to amplify fragments of various lengths within the first PCR amplicons (Fig. 7A; Table 1). To aid in identifying CA1 pyramidal cells, we included nested PCR primers for the following: (1) two housekeeping genes, glyceraldehyde 3-phosphate dehydrogenase (GAPDH) and hypoxanthine phosphoribosyltransferase (HPRT); (2) three markers for GABAergic neurons, neuregulin-1 receptor ERBB4, vesicular GABA transporter (vGAT), and glutamic acid decarboxylase 2 (GAD65); and (3) glial fibrillary acidic protein (GFAP) to identify astrocytes. We also tested for mGluR5. Specificity tests confirmed that each primer generated a unique amplicon of the appropriate size (Fig. 7B). To consider cells to be CA1 pyramidal cells, we required them to be positive for both housekeeping genes and negative for all three GABAergic markers as well as GFAP. To identify GABAergic neurons, we required cells to be positive for both housekeeping genes and at least two of three GABAergic markers and negative for GFAP.
Figure 7.
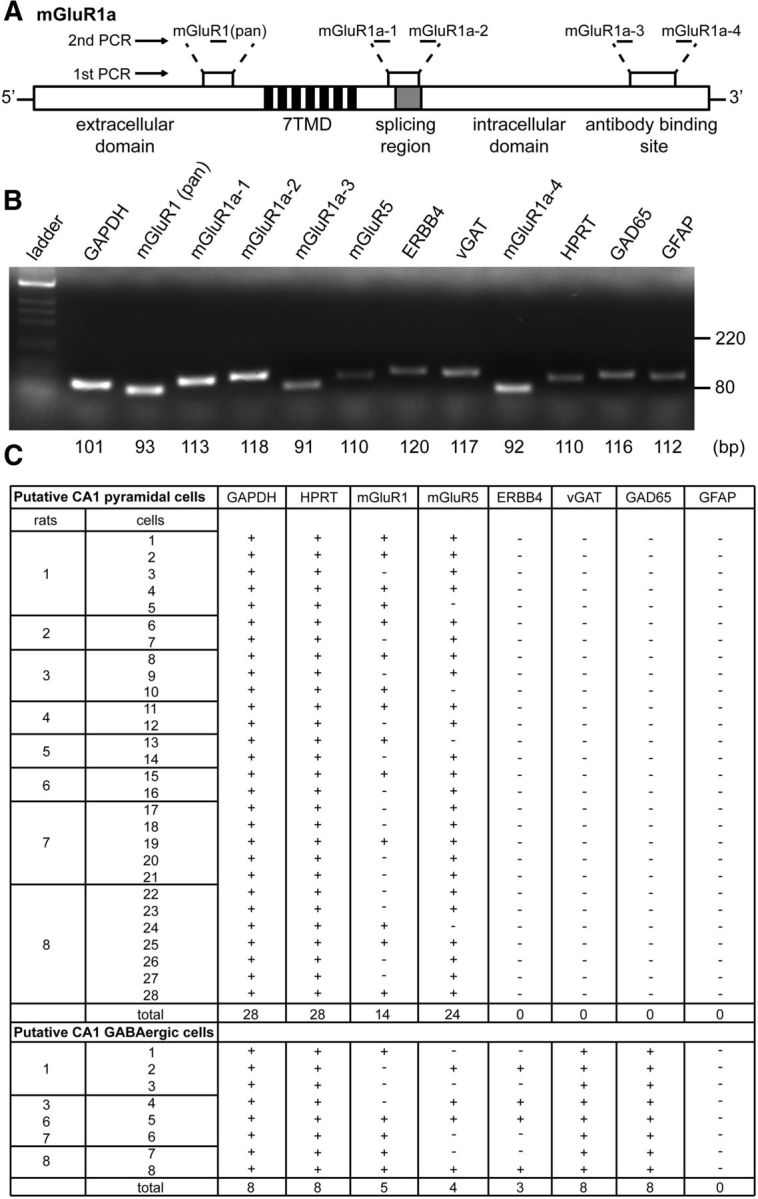
A subset of CA1 pyramidal cells expresses mGluR1a mRNA. A, A schematic mGluR1a mRNA sequence showing three regions that were targeted in single-cell nested PCR experiments: the first region is located within the N-terminal extracellular domain common in all splice variants, the second region is located after the seven transmembrane domain (7TMD) and includes the splicing region, and the third region is located in the C-terminal domain that contains the recognition site for the mGluR1a antibody used in co-IP experiments. In the second real-time PCR step, five separate pairs of nested PCR primers targeted fragments of various lengths within the first PCR amplicons (mGluR1 pan, mGluR1a-1, -2, -3, -4). B, Specificity of all primers was tested on whole hippocampal mRNA isolated from a female rat. Representative gel image showing unique amplicons of appropriate sizes for each gene tested. C, Single-cell nested PCR results showing mRNA expression profiles for all putative CA1 pyramidal neurons and GABAergic neurons derived from eight female rats. To be considered as a putative CA1 pyramidal neuron, a cell was required to be positive for GAPDH and HPRT (housekeeping genes) and negative for ERBB4, vGAT, GAD65 (GABAergic markers), and GFAP (astrocyte marker). To be considered mGluR1a positive, a cell was required to be positive for all five mGluR1a fragments. Of 28 putative CA1 pyramidal neurons, 14 (50%) were mGluR1a positive and 24 (86%) were mGluR5 positive.
Based on these requirements, we identified 28 CA1 pyramidal neurons from eight female rats and eight GABAergic neurons from five of the same pool of rats (Fig. 7C). Of the 28 putative CA1 pyramidal cells, 14 (50%) showed mGluR1a expression, evidenced by detection of all five targeted mGluR1a fragments. A greater fraction of pyramidal cells, 24 of 28 (86%), expressed mGluR5. Four mGluR1a-positive cells lacked mGluR5, 14 mGluR5-positive cells lacked mGluR1a, and 10 cells expressed both mGluR1a and mGluR5. Of the eight putative GABAergic neurons we identified, five expressed mGluR1a, four expressed mGluR5, and two cells expressed both (Fig. 7C). Together, these results indicated that as many as 50% of CA1 pyramidal cells express mGluR1a mRNA, making it possible that E2 acts directly on these cells to activate mGluR1-dependent signaling leading to IPSC suppression.
E2-induced suppression of inhibition is blocked by postsynaptic eCB transporter inhibition
We next tested whether the eCB(s) that underlie E2-induced IPSC suppression are derived from CA1 pyramidal cells. eCB transport from postsynaptic cells can be inhibited by including AM404 (2 μm) in the recording pipette (Ronesi et al., 2004). Of 19 experiments with AM404-loaded pipettes (Fig. 8A), E2 decreased IPSC amplitude in only three cases (16%), which is a much lower response rate than the 29 of 52 (56%) experiments with standard internal solution in the current study (Fig. 8B; χ2 = 8.9, p < 0.01). This strongly suggests that the eCB(s) that mediate E2-induced IPSC suppression are released directly from postsynaptic CA1 pyramidal cells. We also tested DSI in experiments with AM404 and found no effect on DSI (Fig. 8C), indicating that 2-AG-dependent modulation of inhibition was intact even when E2-induced suppression of inhibition was blocked. This is consistent with our previous findings that inhibition of 2-AG synthesis or breakdown has no effect on E2-induced suppression of inhibition (Huang and Woolley, 2012).
Figure 8.
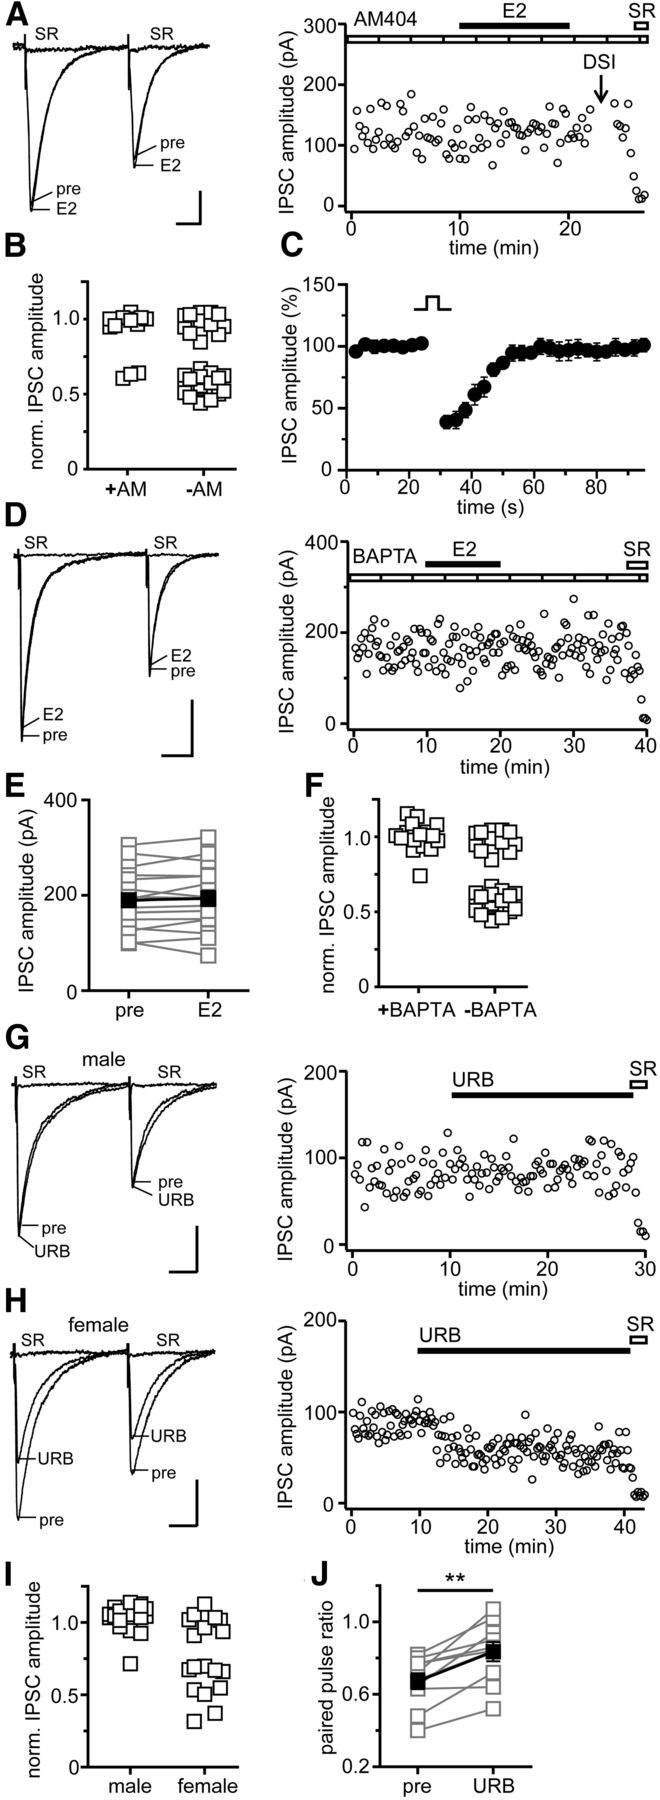
E2-induced suppression of inhibition is Ca2+ dependent and requires postsynaptic eCB release. A, Individual traces and time course of a representative experiment in which E2-induced suppression of inhibition was tested with AM404 (AM; eCB transporter inhibitor, 2 μm) applied postsynaptically via the recording pipette. Each point in the time course is an individual sweep, and SR 95531 (SR; 2 μm) applied at the end of the experiment blocked IPSCs (also in D, G, H). E2-induced suppression of inhibition was rare in AM404-loaded cells. B, Normalized IPSC amplitude for E2-responsive and -nonresponsive experiments with and without AM404 in the recording pipette. Of 19 cells recorded with AM404, only three showed E2-induced IPSC suppression compared with 29 of 52 cells recorded without AM404; p < 0.01, χ2 test. C, DSI was normal in the same AM404-loaded cells as in B, confirming that AM404 did not affect 2-AG-mediated modulation of inhibition. Points are mean ± SEM for all experiments. D, Individual traces and time course of a representative experiment in which BAPTA (Ca2+ chelator, 20 mm) was applied postsynaptically via the recording pipette. E, Group IPSC amplitude data for all experiments with BAPTA (n = 17). Connected open symbols are individual cells; filled symbols are mean ± SEM for all cells. E2-induced suppression of inhibition was rare in BAPTA-loaded cells. F, Normalized IPSC amplitude for E2-responsive and -nonresponsive experiments with and without BAPTA in the recording pipette. Of 17 cells recorded with BAPTA, only one showed E2-induced IPSC suppression, compared with 29 of 52 cells recorded without BAPTA; p < 0.001, χ2 test. G, Individual traces and time course of a representative experiment in which URB597 (URB; FAAH inhibitor, 1 μm) was applied to a male slice. URB597 had no overall effect on IPSC amplitude in males. H, Individual traces and time course of a representative experiment in which URB597 was applied to a female slice. URB597 often decreased IPSC amplitude in females. I, Normalized IPSC amplitude for all cells recorded from both sexes in the presence of URB597 showing a significant sex difference in response rate. Of 17 cells recorded in males, only one showed a URB597-induced decrease in IPSC amplitude, compared with 10 of 18 cells recorded in females; p < 0.01, χ2 test. J, Group PPR data for all URB597-responsive cells in females (n = 10); **p < 0.01, paired t test. Calibration: 25 pA, 25 ms.
The evidence against 2-AG as being involved in E2-induced suppression of inhibition points to AEA as the eCB most likely to mediate the effects of E2. AEA is synthesized via Ca2+-sensitive phosphodiesterase activity (Di Marzo et al., 1994), and mobilization of intracellular Ca2+ by the PLC/IP3 pathway stimulates AEA synthesis in HEK-293 cells and sensory neurons (van der Stelt et al., 2005). Thus, activation of PLC/IP3 signaling by E2 could stimulate AEA synthesis in the hippocampus. In support of this idea, E2-induced IPSC suppression is occluded by inhibition of fatty acid amide hydrolase (FAAH), which degrades AEA, but not by inhibition of monoacylglycerol lipase, which degrades 2-AG (Huang and Woolley, 2012). To investigate a role for postsynaptic Ca2+ in E2-induced suppression of inhibition, we performed experiments with BAPTA (20 mm) in the recording pipette (Chevaleyre and Castillo, 2003; Younts et al., 2013; Fig. 8D). This showed that chelating postsynaptic Ca2+ strongly inhibited E2-induced IPSC suppression. Only 1 of 17 experiments (6%) with BAPTA-loaded pipettes showed a decrease in IPSC amplitude of >10% after E2 application (Fig. 8E), a much lower response rate than the 56% of E2-responsive experiments with standard internal solution (Fig. 8F; χ2 = 12.97, p < 0.001). In parallel, BAPTA also inhibited the E2-induced increase in PPR (0.7 ± 0.01 vs 0.7 ± 0.02).
Together, these results corroborated previous evidence that an eCB other than 2-AG mediates E2-induced suppression of perisomatic inhibition in females and further indicate that this eCB is released from postsynaptic CA1 pyramidal cells through a Ca2+ dependent process. AEA is the most likely candidate to mediate the actions of E2, although we cannot rule out the possibility that other FAAH-sensitive lipids, such as oleamide or N-palmitoylethanolamide, could be involved (Cravatt et al., 1996).
Sex difference in tonic eCB signaling
That E2-induced suppression of inhibition is sex-specific suggests that AEA signaling at inhibitory synapses in the hippocampus might differ between males and females. To investigate a sex difference independently of E2, we tested how inhibitory synapses in males and females respond to inhibition of FAAH. Previous studies using slices from male rats found no effect of FAAH inhibition on baseline IPSCs (Hájos et al., 2004; Kim and Alger, 2004), indicating no tonic AEA release under basal conditions. Consistent with this, we found that, in 17 recordings in males (Fig. 8G), the FAAH inhibitor URB597 (1 μm) had no overall effect on IPSC amplitude (3 ± 2%), and only one cell showed a decrease of >10%. In contrast, in 10 of 18 (55%) identical experiments in females (Fig. 8H), URB597 decreased IPSC amplitude by 43 ± 4% (Fig. 8I) and increased PPR (p < 0.01; Fig. 8J). In the other eight experiments with females, there was no effect of URB597 on IPSC amplitude (0.7 ± 2%) or PPR. There was no difference in initial PPR between URB597-responsive and -nonresponsive recordings (0.67 ± 0.04 vs 0.69 ± 0.03, p = 0.712) in females. Figure 8I shows a comparison of URB597-induced changes in IPSC amplitude for all cells recorded from both sexes, demonstrating a significant sex difference in response rate (χ2 = 10.01, p < 0.01). The ability of URB597 alone to decrease IPSC amplitude and increase PPR in more than half of experiments in females indicates that a substantial fraction of inhibitory synapses in females is under tonic inhibition by a FAAH-sensitive eCB, likely AEA, which is lacking in males. These results demonstrate that, even beyond sex differences in acute E2 modulation of inhibitory synapses, regulation of the eCB system in the hippocampus differs fundamentally between males and females.
Discussion
In the current study, we investigated molecular factors that underlie acute, sex-specific modulation of inhibitory synapses in the hippocampus by E2. Previous work showed that E2 modulation of inhibition depends on ERα, mGluR1, and CB1Rs (Huang and Woolley, 2012). Here, we demonstrate that this effect requires PLC, the IP3R, and eCB mobilization from postsynaptic cells. We further show that mGluR1 forms a complex with ERα and the IP3R in hippocampal cell membranes of both sexes, but that this complex is regulated by E2 only in females. Likely related to this difference, E2 stimulates IP3 synthesis much more strongly in females than in males. Overall, our results suggest a model in which, in females specifically, E2 acutely suppresses inhibition by promoting an interaction between ERα and mGluR1, which activates PLC to generate IP3 and stimulate Ca2+ release via the IP3R, leading to AEA mobilization from postsynaptic cells (Fig. 9). We also found evidence of a sex difference in eCB signaling independently of E2. Inhibition of FAAH, the enzyme that degrades AEA, suppressed inhibition in more than half of experiments in females but had very little effect in males. This indicates that a substantial fraction of inhibitory synapses in females, but not in males, is under tonic suppression by AEA or another FAAH-sensitive eCB. These findings have implications for understanding how eCB-dependent physiological and behavioral responses differ between the sexes.
Figure 9.

Model of intracellular signaling that underlies acute E2-induced suppression of inhibition. Our results support a model in which, in the female hippocampus, E2 acutely suppresses inhibition by promoting an interaction between membrane-associated ERα and mGluR1, which activates PLC to generate IP3 and stimulate Ca2+ release via the IP3R located on the endoplasmic reticulum, leading to Ca2+-dependent AEA synthesis and mobilization from postsynaptic cells.
Sex differences in modulation of mGluR signaling
All animals in our study were gonadectomized as adults before being used for experiments, making it very unlikely that the sex differences we observed depend on circulating gonadal hormones. Rather, parallels between our experiments and previous studies in cell culture suggest that the sex difference in E2 stimulation of ERα–mGluR1 signaling arises through developmental programming by perinatal hormones. Before our study, Boulware et al. (2005) demonstrated that E2 acutely stimulates CREB phosphorylation in hippocampal cultures from female but not male rats and that this depends on an interaction between membrane-associated ERα and mGluR1 that occurs in the absence of an increase in released glutamate. Importantly, this group later showed that E2 responsiveness of neurons from females can be eliminated by injection of E2 or testosterone (T; which can be converted to E2 in the brain) on postnatal day 0 (P0) and P1, before cultures were prepared on P2 (Meitzen et al., 2012). This suggests that the sex difference in E2 modulation of mGluR1 signaling is a classical “organizational” effect of gonadal hormones, in which early life exposure to E2 or T masculinizes the brain and the lack of E2 or T results in feminization. The first demonstrations of organizational hormone effects focused on sex behavior (Phoenix et al., 1959; Feder and Whalen, 1965). Meitzen et al. (2012) extended this concept to acute E2 signaling at a molecular level, and our study demonstrates that the sex difference persists into adulthood to influence the susceptibility of synapses to modulation by E2. Thus, once the developmental programming of this molecular response is established as male or female early in life, the sex difference is maintained through puberty and even in the absence of circulating gonadal hormones.
It is important to note that we observed a sex difference in E2 modulation of mGluR signaling but not in mGluR signaling independently of E2. For example, we found that DHPG activation of group I mGluRs stimulates IP3 synthesis equivalently in hippocampal slices from males and females, indicating no sex difference in mGluR1 to PLC signaling. In contrast, indirect activation of mGluR1 by E2 (presumably via ERα) stimulated mGluR1-dependent IP3 synthesis to a much greater extent in females than in males. Again, this parallels results from Meitzen et al. (2012) who found that, unlike the effects of E2, DHPG-induced CREB phosphorylation in female hippocampal cultures was not eliminated by early T treatment. Together, these observations indicate that the sex difference in E2 signaling likely arises at the level of ERα activation of mGluR1.
Our co-IP results are consistent with a sex difference in E2–ERα activation of mGluR1. We found no differences between males and females in overall levels of ERα, mGluR1a, IP3R, or in the interaction of these molecules under basal conditions (i.e., in vehicle-treated slices). We considered the possibility that Homer-1b/c, which tethers mGluRs to the IP3R, might differ between males and females, but again we found no evidence of a sex difference in levels of Homer-1b/c or its ability to interact with IP3R. In each set of experiments, sex differences were detected specifically in E2 modulation of molecular interactions.
These results suggest two not mutually exclusive possibilities to explain sex-specific E2 modulation of mGluR signaling. First, there may be an additional, yet-to-be-identified, E2-sensitive factor that participates in complex with ERα and mGluR1 and that promotes interaction between them and/or downstream Gαq signaling. Alternatively, differences in membrane targeting of ERα and/or mGluR1 that are not detectable in co-IP experiments may lead to differential modulation and/or downstream signaling. Consistent with this idea, Boulware et al. (2007) have shown in hippocampal cultures that manipulation of caveolin proteins that target ERα to membranes or of palmitoyltransferases that are required for ERα anchoring to membranes via S-palmitoylation (Meitzen et al., 2013; Tabatadze et al., 2013) can influence acute E2 signaling through membrane-associated ERα. Additional studies will be required to investigate whether sex differences in these factors, or their E2 sensitivity, account for sex differences in E2 modulation of mGluR signaling in adulthood.
mGluR1-dependent eCB signaling in females
Previous electrophysiological studies using selective antagonists for mGluR1 and mGluR5 indicated that E2-induced suppression of inhibition depends on mGluR1, not mGluR5 (Huang and Woolley, 2012). In the current study, results of co-IP experiments corroborated this by showing that ERα interacts with mGluR1a but not mGluR5. Previous studies in the hypothalamus (Dewing et al., 2007) and hippocampus (Boulware et al., 2013) also have shown that ERα interacts with mGluR1a. However, the mGluR1 dependence of E2 suppression of inhibition in CA1 pyramidal cells is surprising because both DHPG-induced suppression of inhibition (Ohno-Shosaku et al., 2002) and synaptically induced mGluR-dependent iLTD (Chevaleyre and Castillo, 2003; Izumi and Zorumski, 2012) in CA1 have been shown to depend on mGluR5. We confirmed that the inhibitory synapses suppressed by E2 are the same as those suppressed by group I mGluR activation and by eCBs through mutual occlusion experiments with E2 and DHPG or TBF stimulation to induce iLTD.
Several distinctions between our experiments and previous studies may help to explain the differences. First, other studies of mGluR-dependent regulation of IPSCs have typically focused on dendritic IPSCs, whereas we recorded perisomatic IPSCs. Thus, it is possible that the mGluR involved in modulating intracellular signaling at the soma differs from that in the dendrites. Consistent with this, mGluR1-selective, but not mGluR5-selective, antagonists block DHPG-induced somatic Ca2+ transients in CA1 pyramidal cells, whereas mGluR5 and not mGluR1 antagonists block DHPG-induced potentiation of NMDA-evoked currents (Mannaioni et al., 2001). Similarly, mGluR1 and mGluR5 antagonists each only partially block DHPG-induced suppression of IPSCs evoked by a bipolar stimulating electrode, which likely activated both somatic and dendritic inputs (Mannaioni et al., 2001). It is also possible that differences are related to the age or sex of animals used. Most electrophysiological studies of IPSC modulation use animals younger than in our experiments (e.g., P10–P12 in the study by Ohno-Shosaku et al., 2002; P21–P28 in the study by Chevaleyre and Castillo, 2003) and only rarely indicate the sex of animals used.
The cellular location of mGluR1 that mediates E2-induced suppression of inhibition is uncertain. The simplest explanation of our results involves mGluR1 in CA1 pyramidal cells at or near the inhibitory synapses modulated by E2. Although immunostaining studies find little evidence of mGluR1 labeling in CA1 pyramidal cells (Baude et al., 1993; Petralia et al., 1997), our single-cell nested PCR analysis indicated that ∼50% of CA1 pyramidal cells contain mGluR1a mRNA; mGluR5 was detected in a greater fraction, 86%. Although the abundance of mGluR1a mRNA in each cell cannot be determined with this approach, nor can we determine whether mRNA is translated into protein, PCR results indicate that a subset of CA1 pyramidal cells expresses mGluR1. Alternatively, it is also possible that E2–ERα–mGluR1 signaling in another cell type, such as astrocytes (Kuo et al., 2009) or stratum oriens interneurons (Ferraguti et al., 2004), might lead to eCB production in CA1 pyramidal cells.
Sex difference in tonic eCB signaling
Our experiments also indicate a sex difference in hippocampal eCB signaling independently of E2 regulation. Specifically, we found that FAAH inhibition suppressed inhibitory synapses in females, indicating tonic AEA production, but had no effect in males. This is potentially relevant to the development of therapeutics that target AEA metabolism. For example, FAAH inhibitors have been considered for cannabis withdrawal and in regulation of fear responses in clinical trials (ClinicalTrials.gov). That FAAH inhibitors affect synapses differently in males versus females provides a strong rationale for considering sex as a variable in clinical studies that investigate eCB regulation of physiological or behavioral responses.
Footnotes
This research was supported by National Institutes of Health Grant R01 NS037324, the Office for Research on Women's Health, and the Northwestern University Biological Imaging Facility and High Throughput Analysis Facility.
The authors declare no conflicts of interest.
References
- Alger BE. Endocannabinoids and their implications for epilepsy. Epilepsy Curr. 2004;4:169–173. doi: 10.1111/j.1535-7597.2004.04501.x. [DOI] [PMC free article] [PubMed] [Google Scholar]
- Altemus M, Sarvaiya N, Neill Epperson C. Sex differences in anxiety and depression clinical perspectives. Front Neuroendocrinol. 2014;35:320–330. doi: 10.1016/j.yfrne.2014.05.004. [DOI] [PMC free article] [PubMed] [Google Scholar]
- Atkinson HC, Leggett JD, Wood SA, Castrique ES, Kershaw YM, Lightman SL. Regulation of the hypothalamic-pituitary-adrenal axis circadian rhythm by endocannabinoids is sexually diergic. Endocrinology. 2010;151:3720–3727. doi: 10.1210/en.2010-0101. [DOI] [PMC free article] [PubMed] [Google Scholar]
- Baude A, Nusser Z, Roberts JD, Mulvihill E, McIlhinney RA, Somogyi P. The metabotropic glutamate receptor (mGluR1 alpha) is concentrated at perisynaptic membrane of neuronal subpopulations as detected by immunogold reaction. Neuron. 1993;11:771–787. doi: 10.1016/0896-6273(93)90086-7. [DOI] [PubMed] [Google Scholar]
- Boulware MI, Weick JP, Becklund BR, Kuo SP, Groth RD, Mermelstein PG. Estradiol activates group I and II metabotropic glutamate receptor signaling, leading to opposing influences on cAMP response element-binding protein. J Neurosci. 2005;25:5066–5078. doi: 10.1523/JNEUROSCI.1427-05.2005. [DOI] [PMC free article] [PubMed] [Google Scholar]
- Boulware MI, Kordasiewicz H, Mermelstein PG. Caveolin proteins are essential for distinct effects of membrane estrogen receptors in neurons. J Neurosci. 2007;27:9941–9950. doi: 10.1523/JNEUROSCI.1647-07.2007. [DOI] [PMC free article] [PubMed] [Google Scholar]
- Boulware MI, Heisler JD, Frick KM. The memory-enhancing effects of hippocampal estrogen receptor activation involve metabotropic glutamate receptor signaling. J Neurosci. 2013;33:15184–15194. doi: 10.1523/JNEUROSCI.1716-13.2013. [DOI] [PMC free article] [PubMed] [Google Scholar]
- Caraguel CG, Stryhn H, Gagné N, Dohoo IR, Hammell KL. Selection of a cutoff value for real-time polymerase chain reaction results to fit a diagnostic purpose: analytical and epidemiologic approaches. J Vet Diagn Invest. 2011;23:2–15. doi: 10.1177/104063871102300102. [DOI] [PubMed] [Google Scholar]
- Castillo PE, Younts TJ, Chávez AE, Hashimotodani Y. Endocannabinoid signaling and synaptic function. Neuron. 2012;76:70–81. doi: 10.1016/j.neuron.2012.09.020. [DOI] [PMC free article] [PubMed] [Google Scholar]
- Chevaleyre V, Castillo PE. Heterosynaptic LTD of hippocampal GABAergic synapses: a novel role of endocannabinoids in regulating excitability. Neuron. 2003;38:461–472. doi: 10.1016/S0896-6273(03)00235-6. [DOI] [PubMed] [Google Scholar]
- Citri A, Pang ZP, Südhof TC, Wernig M, Malenka RC. Comprehensive qPCR profiling of gene expression in single neuronal cells. Nat Protoc. 2012;7:118–127. doi: 10.1038/nprot.2011.430. [DOI] [PMC free article] [PubMed] [Google Scholar]
- Cravatt BF, Giang DK, Mayfield SP, Boger DL, Lerner RA, Gilula NB. Molecular characterization of an enzyme that degrades neuromodulatory fatty-acid amides. Nature. 1996;384:83–87. doi: 10.1038/384083a0. [DOI] [PubMed] [Google Scholar]
- Dewing P, Boulware MI, Sinchak K, Christensen A, Mermelstein PG, Micevych P. Membrane estrogen receptor-alpha interactions with metabotropic glutamate receptor 1a modulate female sexual receptivity in rats. J Neurosci. 2007;27:9294–9300. doi: 10.1523/JNEUROSCI.0592-07.2007. [DOI] [PMC free article] [PubMed] [Google Scholar]
- Di Marzo V, Fontana A, Cadas H, Schinelli S, Cimino G, Schwartz JC, Piomelli D. Formation and inactivation of endogenous cannabinoid anandamide in central neurons. Nature. 1994;372:686–691. doi: 10.1038/372686a0. [DOI] [PubMed] [Google Scholar]
- El-Hassar L, Hagenston AM, D'Angelo LB, Yeckel MF. Metabotropic glutamate receptors regulate hippocampal CA1 pyramidal neuron excitability via Ca2+ wave-dependent activation of SK and TRPC channels. J Physiol. 2011;589:3211–3229. doi: 10.1113/jphysiol.2011.209783. [DOI] [PMC free article] [PubMed] [Google Scholar]
- Feder HH, Whalen RE. Feminine behavior in neonatally castrated and estrogen-treated male rats. Science. 1965;147:306–307. doi: 10.1126/science.147.3655.306. [DOI] [PubMed] [Google Scholar]
- Ferraguti F, Cobden P, Pollard M, Cope D, Shigemoto R, Watanabe M, Somogyi P. Immunolocalization of metabotropic glutamate receptor 1α (mGluR1α) in distinct classes of interneurons in the CA1 region of rat hippocampus. Hippocampus. 2004;14:193–215. doi: 10.1002/hipo.10163. [DOI] [PubMed] [Google Scholar]
- Fino E, Paille V, Cui Y, Morera-Herreras T, Deniau JM, Venance L. Distinct coincidence detectors govern the corticostriatal spike timing-dependent plasticity. J Physiol. 2010;588:3045–3062. doi: 10.1113/jphysiol.2010.188466. [DOI] [PMC free article] [PubMed] [Google Scholar]
- Furuichi T, Yoshikawa S, Miyawaki A, Wada K, Maeda N, Mikoshiba K. Primary structure and functional expression of the inositol 1,4,5-trisphosphate-binding protein P400. Nature. 1989;342:32–38. doi: 10.1038/342032a0. [DOI] [PubMed] [Google Scholar]
- Hájos N, Kathuria S, Dinh T, Piomelli D, Freund TF. Endocannabinoid transport tightly controls 2-arachidonoyl glycerol actions in the hippocampus: effects of low temperature and the transport inhibitor AM404. Eur J Neurosci. 2004;19:2991–2996. doi: 10.1111/j.0953-816X.2004.03433.x. [DOI] [PubMed] [Google Scholar]
- Hart SA, Snyder MA, Smejkalova T, Woolley CS. Estrogen mobilizes a subset of estrogen receptor-alpha-immunoreactive vesicles in inhibitory presynaptic boutons in hippocampal CA1. J Neurosci. 2007;27:2102–2111. doi: 10.1523/JNEUROSCI.5436-06.2007. [DOI] [PMC free article] [PubMed] [Google Scholar]
- Hashimotodani Y, Ohno-Shosaku T, Tsubokawa H, Ogata H, Emoto K, Maejima T, Araishi K, Shin HS, Kano M. Phospholipase Cbeta serves as a coincidence detector through its Ca2+ dependency for triggering retrograde endocannabinoid signal. Neuron. 2005;45:257–268. doi: 10.1016/j.neuron.2005.01.004. [DOI] [PubMed] [Google Scholar]
- Hashimotodani Y, Ohno-Shosaku T, Kano M. Ca(2+)-assisted receptor-driven endocannabinoid release: mechanisms that associate presynaptic and postsynaptic activities. Curr Opin Neurobiol. 2007;17:360–365. doi: 10.1016/j.conb.2007.03.012. [DOI] [PubMed] [Google Scholar]
- Hayashi MK, Tang C, Verpelli C, Narayanan R, Stearns MH, Xu RM, Li H, Sala C, Hayashi Y. The postsynaptic density proteins Homer and Shank form a polymeric network structure. Cell. 2009;137:159–171. doi: 10.1016/j.cell.2009.01.050. [DOI] [PMC free article] [PubMed] [Google Scholar]
- Herson PS, Palmateer J, Hurn PD. Biological sex and mechanisms of ischemic brain injury. Transl Stroke Res. 2013;4:413–419. doi: 10.1007/s12975-012-0238-x. [DOI] [PMC free article] [PubMed] [Google Scholar]
- Hill MN, Patel S. Translational evidence for the involvement of the endocannabinoid system in stress-related psychiatric illnesses. Biol Mood Anxiety Disord. 2013;3:19. doi: 10.1186/2045-5380-3-19. [DOI] [PMC free article] [PubMed] [Google Scholar]
- Hu JH, Yang L, Kammermeier PJ, Moore CG, Brakeman PR, Tu J, Yu S, Petralia RS, Li Z, Zhang PW, Park JM, Dong X, Xiao B, Worley PF. Preso1 dynamically regulates group I metabotropic glutamate receptors. Nat Neurosci. 2012;15:836–844. doi: 10.1038/nn.3103. [DOI] [PMC free article] [PubMed] [Google Scholar]
- Huang GZ, Woolley CS. Estradiol acutely suppresses inhibition in the hippocampus through a sex-specific endocannabinoid and mGluR-dependent mechanism. Neuron. 2012;74:801–808. doi: 10.1016/j.neuron.2012.03.035. [DOI] [PMC free article] [PubMed] [Google Scholar]
- Izumi Y, Zorumski CF. NMDA receptors, mGluR5, and endocannabinoids are involved in a cascade leading to hippocampal long-term depression. Neuropsychopharmacology. 2012;37:609–617. doi: 10.1038/npp.2011.243. [DOI] [PMC free article] [PubMed] [Google Scholar]
- Jin DZ, Guo ML, Xue B, Fibuch EE, Choe ES, Mao LM, Wang JQ. Phosphorylation and feedback regulation of metabotropic glutamate receptor 1 by calcium/calmodulin-dependent protein kinase II. J Neurosci. 2013;33:3402–3412. doi: 10.1523/JNEUROSCI.3192-12.2013. [DOI] [PMC free article] [PubMed] [Google Scholar]
- Kammermeier PJ. Endogenous homer proteins regulate metabotropic glutamate receptor signaling in neurons. J Neurosci. 2008;28:8560–8567. doi: 10.1523/JNEUROSCI.1830-08.2008. [DOI] [PMC free article] [PubMed] [Google Scholar]
- Katona I, Sperlágh B, Sík A, Käfalvi A, Vizi ES, Mackie K, Freund TF. Presynaptically located CB1 cannabinoid receptors regulate GABA release from axon terminals of specific hippocampal interneurons. J Neurosci. 1999;19:4544–4558. doi: 10.1523/JNEUROSCI.19-11-04544.1999. [DOI] [PMC free article] [PubMed] [Google Scholar]
- Katona I, Urbán GM, Wallace M, Ledent C, Jung KM, Piomelli D, Mackie K, Freund TF. Molecular composition of the endocannabinoid system at glutamatergic synapses. J Neurosci. 2006;26:5628–5637. doi: 10.1523/JNEUROSCI.0309-06.2006. [DOI] [PMC free article] [PubMed] [Google Scholar]
- Kim J, Alger BE. Inhibition of cyclooxygenase-2 potentiates retrograde endocannabinoid effects in hippocampus. Nat Neurosci. 2004;7:697–698. doi: 10.1038/nn1262. [DOI] [PubMed] [Google Scholar]
- Kosinski CM, Standaert DG, Testa CM, Penney JB, Jr, Young AB. Expression of metabotropic glutamate receptor 1 isoforms in the substantia nigra pars compacta of the rat. Neuroscience. 1998;86:783–798. doi: 10.1016/S0306-4522(97)00654-4. [DOI] [PubMed] [Google Scholar]
- Kramár EA, Chen LY, Brandon NJ, Rex CS, Liu F, Gall CM, Lynch G. Cytoskeletal changes underlie estrogen's acute effects on synaptic transmission and plasticity. J Neurosci. 2009;29:12982–12993. doi: 10.1523/JNEUROSCI.3059-09.2009. [DOI] [PMC free article] [PubMed] [Google Scholar]
- Kuo J, Hariri OR, Bondar G, Ogi J, Micevych P. Membrane estrogen receptor-alpha interacts with metabotropic glutamate receptor type 1a to mobilize intracellular calcium in hypothalamic astrocytes. Endocrinology. 2009;150:1369–1376. doi: 10.1210/en.2008-0994. [DOI] [PMC free article] [PubMed] [Google Scholar]
- Maione S, Costa B, Di Marzo V. Endocannabinoids: a unique opportunity to develop multitarget analgesics. Pain. 2013;1:S87–S93. doi: 10.1016/j.pain.2013.03.023. [DOI] [PubMed] [Google Scholar]
- Mannaioni G, Marino MJ, Valenti O, Traynelis SF, Conn PJ. Metabotropic glutamate receptors 1 and 5 differentially regulate CA1 pyramidal cell function. J Neurosci. 2001;21:5925–5934. doi: 10.1523/JNEUROSCI.21-16-05925.2001. [DOI] [PMC free article] [PubMed] [Google Scholar]
- Meitzen J, Grove DD, Mermelstein PG. The organizational and aromatization hypotheses apply to rapid, nonclassical hormone action: neonatal masculinization eliminates rapid estradiol action in female hippocampal neurons. Endocrinology. 2012;153:4616–4621. doi: 10.1210/en.2012-1525. [DOI] [PMC free article] [PubMed] [Google Scholar]
- Meitzen J, Luoma JI, Boulware MI, Hedges VL, Peterson BM, Tuomela K, Britson KA, Mermelstein PG. Palmitoylation of estrogen receptors is essential for neuronal membrane signaling. Endocrinology. 2013;154:4293–4304. doi: 10.1210/en.2013-1172. [DOI] [PMC free article] [PubMed] [Google Scholar]
- Milner TA, McEwen BS, Hayashi S, Li CJ, Reagan LP, Alves SE. Ultrastructural evidence that hippocampal alpha estrogen receptors are located at extranuclear sites. J Comp Neurol. 2001;429:355–371. doi: 10.1002/1096-9861(20010115)429:3%3C355::AID-CNE1%3E3.0.CO%3B2-%23. [DOI] [PubMed] [Google Scholar]
- Nakamura T, Nakamura K, Lasser-Ross N, Barbara JG, Sandler VM, Ross WN. Inositol 1,4,5-trisphosphate (IP3)-mediated Ca2+ release evoked by metabotropic agonists and backpropagating action potentials in hippocampal CA1 pyramidal neurons. J Neurosci. 2000;20:8365–8376. doi: 10.1523/JNEUROSCI.20-22-08365.2000. [DOI] [PMC free article] [PubMed] [Google Scholar]
- Ohno-Shosaku T, Shosaku J, Tsubokawa H, Kano M. Cooperative endocannabinoid production by neuronal depolarization and group I metabotropic glutamate receptor activation. Eur J Neurosci. 2002;15:953–961. doi: 10.1046/j.1460-9568.2002.01929.x. [DOI] [PubMed] [Google Scholar]
- Petralia RS, Wang YX, Singh S, Wu C, Shi L, Wei J, Wenthold RJ. A monoclonal antibody shows discrete cellular and subcellular localizations of mGluR1 alpha metabotropic glutamate receptors. J Chem Neuroanat. 1997;13:77–93. doi: 10.1016/S0891-0618(97)00023-9. [DOI] [PubMed] [Google Scholar]
- Phoenix CH, Goy RW, Gerall AA, Young WC. Organizing action of prenatally administered testosterone propionate on the tissues mediating mating behavior in the female guinea pig. Endocrinology. 1959;65:369–382. doi: 10.1210/endo-65-3-369. [DOI] [PubMed] [Google Scholar]
- Price CJ, Cauli B, Kovacs ER, Kulik A, Lambolez B, Shigemoto R, Capogna M. Neurogliaform neurons form a novel inhibitory network in the hippocampal CA1 area. J Neurosci. 2005;25:6775–6786. doi: 10.1523/JNEUROSCI.1135-05.2005. [DOI] [PMC free article] [PubMed] [Google Scholar]
- Reich CG, Taylor ME, McCarthy MM. Differential effects of chronic unpredictable stress on hippocampal CB1 receptors in male and female rats. Behav Brain Res. 2009;203:264–269. doi: 10.1016/j.bbr.2009.05.013. [DOI] [PMC free article] [PubMed] [Google Scholar]
- Ronesi J, Gerdeman GL, Lovinger DM. Disruption of endocannabinoid release and striatal long-term depression by postsynaptic blockade of endocannabinoid membrane transport. J Neurosci. 2004;24:1673–1679. doi: 10.1523/JNEUROSCI.5214-03.2004. [DOI] [PMC free article] [PubMed] [Google Scholar]
- Savic I, Engel J., Jr Structural and functional correlates of epileptogenesis—does gender matter? Neurobiol Dis. 2014;70:69–73. doi: 10.1016/j.nbd.2014.05.028. [DOI] [PMC free article] [PubMed] [Google Scholar]
- Shigemoto R, Nakanishi S, Mizuno N. Distribution of the mRNA for a metabotropic glutamate receptor (mGluR1) in the central nervous system: an in situ hybridization study in adult and developing rat. J Comp Neurol. 1992;322:121–135. doi: 10.1002/cne.903220110. [DOI] [PubMed] [Google Scholar]
- Smejkalova T, Woolley CS. Estradiol acutely potentiates hippocampal excitatory synaptic transmission through a presynaptic mechanism. J Neurosci. 2010;30:16137–16148. doi: 10.1523/JNEUROSCI.4161-10.2010. [DOI] [PMC free article] [PubMed] [Google Scholar]
- Tabatadze N, Smejkalova T, Woolley CS. Distribution and posttranslational modification of synaptic ERα in the adult female rat hippocampus. Endocrinology. 2013;154:819–830. doi: 10.1210/en.2012-1870. [DOI] [PMC free article] [PubMed] [Google Scholar]
- Tanimura A, Yamazaki M, Hashimotodani Y, Uchigashima M, Kawata S, Abe M, Kita Y, Hashimoto K, Shimizu T, Watanabe M, Sakimura K, Kano M. The endocannabinoid 2-arachidonoylglycerol produced by diacylglycerol lipase alpha mediates retrograde suppression of synaptic transmission. Neuron. 2010;65:320–327. doi: 10.1016/j.neuron.2010.01.021. [DOI] [PubMed] [Google Scholar]
- Tu JC, Xiao B, Yuan JP, Lanahan AA, Leoffert K, Li M, Linden DJ, Worley PF. Homer binds a novel proline-rich motif and links group 1 metabotropic glutamate receptors with IP3 receptors. Neuron. 1998;21:717–726. doi: 10.1016/S0896-6273(00)80589-9. [DOI] [PubMed] [Google Scholar]
- van der Stelt M, Trevisani M, Vellani V, De Petrocellis L, Schiano Moriello A, Campi B, McNaughton P, Geppetti P, Di Marzo V. Anandamide acts as an intracellular messenger amplifying Ca2+ influx via TRPV1 channels. EMBO J. 2005;24:3026–3037. doi: 10.1038/sj.emboj.7600784. [DOI] [PMC free article] [PubMed] [Google Scholar]
- Werling DM, Geschwind DH. Sex difference in autism spectrum disorders. Curr Opin Neurol. 2013;26:146–153. doi: 10.1097/WCO.0b013e32835ee548. [DOI] [PMC free article] [PubMed] [Google Scholar]
- Wiley JL, Kendler SH, Burston JJ, Howard DR, Selley DE, Sim-Selley LJ. Antipsychotic-induced alterations in CB1 receptor-mediated G-protein signaling and in vivo pharmacology in rats. Neuropharmacology. 2008;55:1183–1190. doi: 10.1016/j.neuropharm.2008.07.026. [DOI] [PMC free article] [PubMed] [Google Scholar]
- Younts TJ, Chevaleyre V, Castillo PE. CA1 pyramidal cell theta-burst firing triggers endocannabinoid-mediated long-term depression at both somatic and dendritic inhibitory synapses. J Neurosci. 2013;33:13743–13757. doi: 10.1523/JNEUROSCI.0817-13.2013. [DOI] [PMC free article] [PubMed] [Google Scholar]
- Yu YC, Cao LH, Yang XL. Modulation by brain natriuretic peptide of GABA receptors on rat retinal ON-type bipolar cells. J Neurosci. 2006;26:696–707. doi: 10.1523/JNEUROSCI.3653-05.2006. [DOI] [PMC free article] [PubMed] [Google Scholar]
- Zanettini C, Panlilio LV, Alicki M, Goldberg SR, Haller J, Yasar S. Effects of endocannabinoid system modulation on cognitive and emotional behavior. Front Behav Neurosci. 2011;5:57. doi: 10.3389/fnbeh.2011.00057. [DOI] [PMC free article] [PubMed] [Google Scholar]