

Abstract
Much of the molecular understanding of synaptic pathology in Alzheimer's disease (AD) comes from studies of various mouse models that express familial AD (FAD)-linked mutations, often in combinations. Most studies compare the absolute magnitudes of long-term potentiation (LTP) and long-term depression (LTD) to assess deficits in bidirectional synaptic plasticity accompanying FAD-linked mutations. However, LTP and LTD are not static, but their induction threshold is adjusted by overall neural activity via metaplasticity. Hence LTP/LTD changes in AD mouse models may reflect defects in metaplasticity processes. To determine this, we examined the LTP/LTD induction threshold in APPswe;PS1ΔE9 transgenic (Tg) mice across two different ages. We found that in young Tg mice (1 month), LTP is enhanced at the expense of LTD, but in adults (6 months), the phenotype is reversed to promote LTD and reduce LTP, compared to age-matched wild-type (WT) littermates. The apparent opposite phenotype across age was due to an initial offset in the induction threshold to favor LTP and the inability to undergo developmental metaplasticity in Tg mice. In WTs, the synaptic modification threshold decreased over development to favor LTP and diminish LTD in adults. However, in Tg mice, the magnitudes of LTP and LTD stayed constant across development. The initial offset in LTP/LTD threshold in young Tg mice did not accompany changes in the LTP/LTD induction mechanisms, but altered AMPA receptor phosphorylation and appearance of Ca2+-permeable AMPA receptors. We propose that the main synaptic defect in AD mouse models is due to their inability to undergo developmental metaplasticity.
SIGNIFICANCE STATEMENT This work offers a new insight that metaplasticity defects are central to synaptic dysfunctions seen in AD mouse models. In particular, we demonstrate that the apparent differences in LTP/LTD magnitude seen across ages in AD transgenic mouse models reflect the inability to undergo a normal developmental shift in metaplasticity.
Keywords: AD, APPswe;PS1ΔE9, LTD, LTP, pull–push metaplasticity, sliding threshold
Introduction
Alzheimer's disease (AD) is a progressive neurodegenerative disorder, which is believed to be preceded by synaptic dysfunction leading to memory loss in its early stages (Shankar and Walsh, 2009). Molecular understanding of synaptic deficits accompanying AD comes from studying mouse models expressing familial AD (FAD)-linked mutations. However, depending on the combination of FAD-linked mutations, distinct phenotypes are observed across age and brain regions studied (Marchetti and Marie, 2011). Most studies compare magnitudes of long-term potentiation (LTP) and long-term depression (LTD) to determine synaptic plasticity deficits associated with FAD-linked mutations. Although absolute magnitudes of LTP/LTD could be informative, the induction threshold of LTP/LTD is not static, but is itself adjusted by past neuronal activity through metaplasticity processes such as the “sliding threshold” (Cooper and Bear, 2012) or the “pull–push” (Huang et al., 2012). Therefore, the diversity seen in the magnitudes of LTP/LTD across various AD mouse models (Marchetti and Marie, 2011) may reflect a more fundamental defect in metaplasticity.
Metaplasticity adjusts the magnitude and polarity of synaptic plasticity in tune with the past history of synaptic and neural activity to provide stability to neural networks. Hence, proper metaplasticity is crucial for neural circuits to operate within normal functional ranges. The sliding threshold model of metaplasticity, proposed by Bienenstock et al. (1982), states that the synaptic modification threshold slides as a consequence of the time-averaged postsynaptic neuronal activity, such that LTP is preferred when the time-averaged postsynaptic activity is low, whereas LTD dominates when it is high (Bienenstock et al., 1982; Bear et al., 1987; Cooper and Bear, 2012). The sliding threshold model provides a stable network that can generate neuronal selectivity during development, experience-dependent plasticity, and learning/memory (Cooper and Bear, 2012). Changes in LTP/LTD induction mechanisms, especially altering the function of NMDA receptors (NMDARs) has been shown critical for mediating the sliding threshold (Quinlan et al., 1999, 2004; Philpot et al., 2001; Philpot et al., 2003). Alternatively, changes in LTP/LTD expression by neuromodulation of AMPA receptors (AMPARs) also produce a similar metaplasticity, termed the push–pull model (Huang et al., 2012). Adenylyl cyclase-coupled signaling cascades leading to PKA activity promote LTP, whereas phospholipase C signaling cascades promote LTD. Changes in AMPAR phosphorylation downstream of these signaling cascades are proposed to alter LTP/LTD expression mechanisms (Seol et al., 2007; Huang et al., 2012).
Increased activity in memory networks has been observed in AD patients before clinical pathologies (Sperling et al., 2010), and aberrant excitatory neuronal activity has been suggested as an early symptom of AD (Palop et al., 2007; Palop and Mucke, 2010). Therefore, it may not be the change in absolute LTP/LTD magnitude, but the inability to adequately adapt to changes in overall neural activity, that drives cognitive defects. We determined whether changes in synaptic plasticity seen in an AD mouse model (APPswe;PS1ΔE9) are due to metaplasticity defects. We found there is a differential contribution of FAD-linked mutations to LTP/LTD magnitude in young versus adult AD mice, but the major defect is in the developmental regulation of metaplasticity via altered expression mechanisms of LTP/LTD.
Materials and Methods
Animals.
Young (1-month-old) and adult (6-month-old) APPswe;PS1ΔE9 Tg and their wild-type (WT) littermate mice (129/C57BL/6 mixed background) were used. Genotypes were distinguished by PCR of isolated genomic DNA obtained from each pup after weaning. Young preadolescent mice were of either sex, whereas adult older mice were only male. APPswe;PS1ΔE9 Tg mice have accelerated amyloid pathologies and have a substantial number of plaque deposits by 6 months of age (Jankowsky et al., 2004; Savonenko et al., 2005). Therefore, these mice were used at both preamyloidogenic and postamyloidogenic ages. The Institutional Animal Care and Use Committees of Johns Hopkins University approved all procedures involving animals.
Preparation of acute hippocampal slices.
Acute hippocampal slices were prepared from 1-month-old and 6-month-old WT and APPswe;PS1ΔE9 Tg mice as described previously (Lee et al., 2003). Briefly, each mouse was killed by decapitation following overdose of isoflurane. Hippocampi were rapidly removed and sectioned into either 300 μm (for whole-cell recording) or 400 μm [for field potential (FP) recording] slices on a vibratome (Vibratome 3000 series; Ted Pella). Hippocampi were dissected using oxygenated ice-cold dissection buffer [composed of (in mm) 212.7 sucrose, 2.6 KCl, 1.23 NaH2PO4, 26 NaHCO3, 10 dextrose, 3 MgCl2, and 1 CaCl2] and recovered at room temperature in artificial CSF [ACSF; composed of (in mm) 124 NaCl, 5 KCl, 1.25 NaH2PO4, 26 NaHCO3, 10 dextrose, 1.5 MgCl2, and 2.5 CaCl2].
Field potential recordings from Schaffer collateral inputs to CA1.
All recordings were done in a submersion recording chamber perfused with ACSF (29–30°C, 2 ml/min) bubbled with 95% O2/5% CO2. For FP recordings, synaptic responses were delivered through a bipolar glass stimulating electrode placed to activate the Schaffer collaterals with a 0.2 ms duration pulse (baseline stimulation at 0.0333 Hz) and recorded from the dendritic field of CA1. Synaptic responses were digitized and stored online using Igor Pro software (WaveMetrics). Input–output curves were generated by measuring extracellular field potential responses with varying stimulus intensities. For measurement of paired-pulse facilitation (PPF), 25, 50, 100, 200, 400, 1000, and 2000 ms interstimulus intervals (ISIs) were used. LTP was induced using a theta burst stimulation [TBS; four trains, each consisting of 10 100 Hz bursts (four pulses) given at 5 Hz, repeated at 10 s intervals (4×TBS)]. LTD in young mice was induced using a 1 Hz, 900 pulse stimulation protocol. LTD in adult mice was induced using a paired-pulse 1 Hz (50 ms ISI), 900 pulse stimulation. An intermediate stimulation frequency of 10 Hz, 900 pulses, was chosen because it was close to the modification threshold. For certain experiments, 10 μm dl-threo-β-benzyloxyaspartic acid (TBOA, Tocris Biosciences), a competitive blocker of glutamate transporters, was used to induce spillover of glutamate. In these experiments, CA3 was cut away during dissection, and high divalents were added to the ACSF (4 mm MgCl2 and 4 mm CaCl2) in addition to 100 μm d,l-APV and 2.5 μm gabazine. FP slopes or amplitudes as specified in the graphs were measured, and data are expressed as means ± SEM.
Whole-cell recording of evoked NMDAR-mediated EPSCs.
Slices were visualized using an upright microscope (E600 FN; Nikon) with infrared oblique illumination. NMDAR-mediated EPSCs were pharmacologically isolated by adding 20 μm bicuculline and 10 μm NBQX to the ACSF [composed of (in mm) 124 NaCl, 2.5 KCl, 1.25 NaH2PO4, 26 NaHCO3, 5 dextrose, 4 MgCl2, and 4 CaCl2; 30 ± 1°C; saturated with 95% O2 and 5% CO2], which was continually perfused at a rate of 2 ml/min. Target cells in CA1 were identified by the pyramid-shaped soma. These neurons were patched using a whole-cell patch pipette (tip resistance, 3–5 MΩ), which was filled with internal solution [containing (in mm) 120 Cs-methanesulfonate, 5 MgCl2, 8 NaCl, 1 EGTA, 10 HEPES, 2 Mg-ATP, 0.5 Na3GTP, and 1 QX-314, pH 7.3, 280–290 mOsm]. NMDAR-mediated currents were measured at +40 mV. A double-barrel glass stimulating electrode filled with ACSF was placed in the stratum radiatum of CA1 to activate Schaffer collateral inputs. To test the portion of these currents mediated by GluN2B containing NMDARs, 3 μm GluN2B antagonist, ifenprodil, was added to the ACSF. To evaluate the amplitude and decay kinetics of the NMDAR EPSCs in a given condition, 20–40 traces were averaged and normalized. The decay was then fitted with two exponentials, one fast and one slow, using Igor. To measure the decay, a weighted time constant (τw) was calculated according to the following equation as described previously (Rumbaugh and Vicini, 1999): τw = τf [If/(If + Is)] + τs [Is/(If + Is)], where τf and τs are the time constants for the fast and slow components, respectively, and If and Is are their respective amplitudes. Only the cells and recording conditions that met the following criteria were studied: no obvious multiple EPSCs or polysynaptic waveforms, Rinput ≥ 125 MΩ, Rseries ≤ 30 MΩ, and Rinput or Rseries changed <25% during the course of the experiment. Data are the means ± SE. Comparison between the two conditions was done using paired Student's t test.
Whole-cell recording of miniature GABAAR-mediated IPSCs and AMPAR-mediated mEPSCs.
For miniature GABAAR-mediated IPSCs (mIPSCs) from CA1 pyramidal cells, the recording pipette was filled with intracellular solution [containing (in mm) 140 CsCl, 8 KCl, 10 EGTA, 10 HEPES, and 0.01 QX-314, pH 7.3, 275–285 mOsm] in the presence of 1 μm TTX, 100 μm d,l-APV, and 10 μm NBQX in the ACSF to isolate GABAR-mediated currents. For mEPSC recordings, the recording pipette was filled with internal solution [containing (in mm) 130 Cs-gluconate, 8 KCl, 1 EGTA, 10 HEPES, 4 ATP, and 5 QX-314, pH 7.4, 285–295 mOsm], and 1 μm TTX, 100 μm d,l-APV, and 20 μm bicuculline was added to the ACSF to pharmacologically isolate AMPAR mEPSCs. The Axon patch-clamp amplifier 700B (Molecular Devices) was used for voltage-clamp recordings. Cells were held at −70 mV, and the recorded mIPSC and mEPSC data were digitized at 10 kHz with a data acquisition board (National Instruments) and acquired through custom-made programs using the Igor Pro software (WaveMetrics). The MiniAnalysis program (Synaptosoft) was used to analyze the acquired mIPSCs and mEPSCs. The threshold for detecting both mIPSCs and mEPSCs was set at three times the root mean square noise. Recordings were excluded from analysis if the series resistance was >25 MΩ or input resistance was <100 MΩ for mIPSCs and <150 MΩ for mEPSCs. To minimize the impact of dendritic filtering, we adopted the standard approach of excluding mIPSCs with a rise time of >5 ms and mEPSCs with a rise time of >3 ms. Three hundred to 400 consecutive mIPSCs and 80 consecutive mEPSCs that met the rise-time criteria were analyzed from each cell. In some of the mEPSC experiments, 20 μm 1-naphthyl acetyl spermine (naspm) trihydrochloride (Tocris Bioscience) was added to the ACSF for at least 10 min before recording.
Golgi staining and morphological analysis of dendritic spines.
To analyze dendritic spine density in vivo, Golgi staining was performed using the FD Rapid GolgiStain Kit (FD NeuroTechnologies), according to the manufacturer's protocol, as described previously (Megill et al., 2013). Brains from 1-month-old WT and APPswe;PS1ΔE9 Tg mice (n = 3 per group) or from 6-month-old WT and APPswe;PS1ΔE9 Tg mice (n = 3 per group) were immersed in Solutions A and B for 2 weeks and then transferred into Solution C for 24 h. After 24 h of incubation, the solution was replaced with fresh Solution C and kept at 4°C for 3 d. After the 3 d incubation, the brains were sliced using a Vibratome at 150 μm thickness. Images were acquired using an Axioplan 2 microscope (Zeiss) under bright-field illumination. Dendritic spines (0.2 to 2 μm in length) from apical oblique (AO) and basal shaft (BS) dendrites were counted manually in a blinded manner.
Western blot analysis of major AMPAR and NMDAR subunits.
The hippocampi from 1-month-old and 6-month-old WT and APPswe;PS1ΔE9 Tg mice were homogenized in ice-cold 0.2% SDS/1% Triton X-100 immunoprecipitation buffer [containing (in mm) 20 Na3PO4, 150 NaCl, 10 EDTA, 10 EGTA, 10 Na4P2O7, 50 NaF, and 1 Na3VO4, pH 7.4, with 1 μm okadaic acid and 10 kIU/ml aprotinin], sonicated, and centrifuged for 10 min at 13,200 × g at 4°C. The protein concentration of the supernatant was normalized to 0.6–3.0 mg/ml. The total homogenate from WT and Tg mice of the same age was run on one gel and processed for immunoblot analysis using GluA1 (catalog #sc-55509, Santa Cruz Biotechnology), GluN2A (catalog #07-632, Millipore), and GluN2B (catalog #71-8600, Invitrogen) antibodies. GluA1-phosphorylation site-specific antibodies were generated as described previously (Mammen et al., 1997). AMPAR blots were probed simultaneously with GluA1 and either of the phosphoantibodies. GluA1 phosphorylation sites and NMDAR subunit blots were developed using enhanced chemifluorescence substrate (ECF substrate, GE Healthcare), whereas GluA1 was developed with a second antibody linked to Cy5. All blots were scanned using Typhoon 9400 (GE Healthcare) and quantified using Image Quant TL software (GE Healthcare). For each gel, control WT and Tg samples were loaded at three different concentrations to determine the linear range of signal for quantification. Only the samples that produced a signal within the linear range were used for analysis. The signal of each sample on a blot was normalized to the average signal from the WT group to obtain the percentage of average WT values, which were compared across groups using unpaired Student's t test.
Results
Basal synaptic function and dendritic spine density in APPswe;PS1ΔE9 mice
To determine whether FAD-linked mutations alter metaplasticity, we examined frequency-dependent synaptic plasticity in young (1-month-old) and adult (6-month-old) APPswe;PS1ΔE9 Tg mice. This AD mouse model harbors two FAD-linked mutations, a Swedish mutation on the amyloid precursor protein (APP) and a deletion mutation on exon 9 of presenilin-1 (PS1), and displays an accelerated pathogenesis (Jankowsky et al., 2004). The two age groups were chosen to reflect preamyloidogenic and postamyloidogenic time points (Savonenko et al., 2005). To establish a baseline from which we can interpret the results of frequency-dependent synaptic plasticity, we first examined the basal synaptic functions of the CA1 Schaffer collateral synapses in Tg and WT littermates. In young Tg mice, there was a significant increase in the FP slope and fiber volley (FV) amplitude at higher stimulation intensities (Fig. 1A,B). FV amplitude data were fit with sigmoidal curves to determine whether this increase was due to an increase in the maximal number of axon recruitment or a difference in the excitability of each axon (Fig. 1B). There was an increase in the maximum FV amplitude, which reflects the maximum axon number, without a change in the stimulus intensity to reach half-maximum FV amplitude, a measure of fiber excitability. This suggests that there was an increase in the total number of axons or increased axon density in the stratum radiatum of CA1. There was no change in the input–output function when synaptic transmission was normalized to the FV amplitude (Fig. 1C), which suggests that the strength of synaptic transmission per activated axon fiber is normal in young Tg mice. To determine whether the increase in axonal density was associated with an increase in dendritic spine density, we measured spine density in CA1 and cortical layers II/III using Golgi staining (Fig. 1E,F). We found that total spine density in young Tg mice was increased compared to age-matched WT littermates in CA1 and cortical layers II/III. In CA1, the increase in dendritic spine density was not restricted to the AO dendrites, but was also seen in the BS dendrites. This suggests that there is a global increase in excitatory synapse density in the 1-month-old Tg mice across different brain areas. There was no significant difference in the PPF ratio between young WT and Tg mice, which suggests normal presynaptic function (Fig. 1G,H).
Figure 1.

Young APPswe/PS1ΔE9 transgenic mice show an increased number of synapses without changes in input strength or presynaptic function. A, B, FP slope and FV amplitude plotted against stimulation intensity. Note the larger maximum FP slope (A) and FV amplitude (B) in Tg mice. *p < 0.001 (ANOVA). Sigmoidal curve fit was used for individual data sets, which, when compared between genotypes, showed a significant increase in the maximal FV amplitude (WT, 0.23 ± 0.03 mV, n = 15 slices from 6 mice; Tg, 0.44 ± 0.7 mV, n = 15 slices from 5 mice; p < 0.02, t test) without significant changes in the rate of FV amplitude increase, as measured by comparing the stimulation intensity to reach half-maximum FV amplitude (WT, 39 ± 4 μA; Tg, 33 ± 4 μA; t test, p = 0.28). This suggests that the rate of axonal recruitment is not different, but the maximal number of recruited axons is larger in Tg mice. C, No significant difference in input–output function when FP slope changes are normalized to FV amplitudes. This suggests that the input strength per axons recruited is not different between WT and Tg mice. D, Example FP traces recorded with increasing stimulation intensity. E, Increase in dendritic spine density in CA1 of 1-month-old Tg mice. Left, Comparison of average dendritic spine density. Note the statistically significant increases in the dendritic spine density in BS and AO dendrites, which are reflected in the total (BS + AO) density (n = 3 mice). *p < 0.01 (t test). Right, Representative BS and AO dendrites from hippocampal CA1 neurons from WT and Tg mice. F, Increase in dendritic spine density in cortical layer II/III of 1-month-old Tg mice. Left, Comparison of average dendritic spine density. Only BS and total density were significantly increased in Tg mice (n = 3 mice). *p < 0.01 (t test). Right, Representative BS and AO dendrites from hippocampal CA1 neurons from WT and Tg mice. G, No change in PPF ratio across different ISIs. H, Representative FP traces taken at 50 ms ISI.
In contrast to what we observed in young Tg mice, we found no significant difference in the basal synaptic transmission at the Schaffer collateral inputs to CA1 in adult Tg mice (Fig. 2A–D). Consistent with the rather normal basal synaptic transmission at these synapses, the dendritic spine density of apical oblique dendrites of CA1 neurons, which receive Schaffer collateral inputs, was also normal in adult Tg mice (Fig. 2E). Interestingly, there was a selective decrease in dendritic spine density at BS dendrites in CA1 and cortical layers II/III in adult Tg mice (Fig. 2E,F), which suggests that the inputs to BS dendrites may be more vulnerable at this age across different brain areas. Unlike in young Tg mice, the PPF ratio was decreased at shorter ISIs in adult Tg mice (Fig. 2G,H). This suggests an enhancement in presynaptic release probability or altered calcium dynamics could lead to an inability to summate the responses. This is in line with the idea that the increased amyloid burden seen in adult Tg mice (Jankowsky et al., 2004; Savonenko et al., 2005) may lead to oxidative stress and impairment in mitochondrial function to adversely impact Ca2+ homeostasis and impair LTP (for review, seeBezprozvanny and Mattson, 2008).
Figure 2.

Adult Tg mice display normal input–output function, but reduced dendritic spine density and PPF ratio. A–D, Normal input–output function in adult Tg (6-month-old) mice as shown by normal FP slope (A) and FV amplitude (B) plotted against stimulation intensity, as well as normal FP slope plotted against FV amplitude (C). Example FP traces are shown in D. WT, n = 16 slices from 7 mice; Tg, n = 22 slices from 7 mice. E, F, A specific decreased in spine density of BS dendrites (n = 3 mice) in both CA1 (E) and cortical layer II/III (F). There was no significant change in the spine density of AO dendrites (CA1, p = 0.595; cortical layer II/III, p = 0.817). Representative BS and AO dendrites are shown in the right panels. G, H, Reduced PPF ratio at shorter ISIs in Tg mice (G, WT, n = 22 slices from 7 mice; Tg, n = 23 slices from 5 mice). Representative FP traces taken at 50 ms ISI are shown in H. *p < 0.01 (t test).
Defective age-dependent metaplasticity of frequency-dependent synaptic plasticity in APPswe;PS1ΔE9 mice
To determine whether changes in frequency-dependent synaptic plasticity seen in APPswe;PS1ΔE9 Tg mice are due to altered metaplasticity, we measured synaptic plasticity using standard LTP/LTD protocols, as well as an intermediate simulation frequency close to the modification threshold (Fig. 3). In young Tg mice, high-frequency theta burst–induced LTP is increased (Fig. 3C), whereas low-frequency stimulation–induced LTD is decreased (Fig. 3A). An intermediate frequency (10 Hz, 900 pulses) produced reliable LTD in young WT mice, but no long-term change in young Tg mice (Fig. 3B). This is consistent with the modification threshold for inducing plasticity being shifted to the left in favor of LTP. In adult Tg mice, high-frequency theta burst–induced LTP is decreased (Fig. 3F), whereas low-frequency stimulation–induced LTD is increased (Fig. 3D). Although there was a trend toward a decrease in the magnitude of change produced by an intermediate stimulation frequency (10 Hz, 900 pulses), it did not reach statistical significance (Fig. 3E). These changes are consistent with the modification threshold for inducing plasticity being shifted to the right to promote LTD. Together, these data suggest that metaplasticity is altered in both young and adult Tg mice, but in opposite directions.
Figure 3.
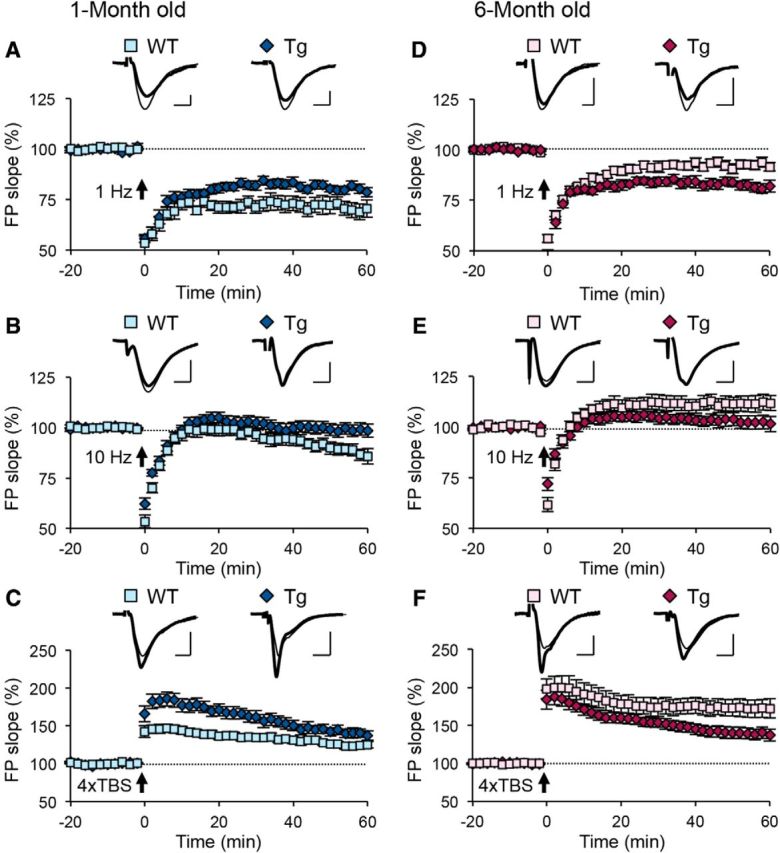
Frequency-dependent synaptic plasticity in young and adult APPswe/PS1ΔE9 mice is altered in opposite directions. A–C, Frequency-dependent synaptic plasticity in young (1-month-old) APPswe/PS1ΔE9 and WT littermates. A, Tg mice show reduced magnitude of LTD induced by 1 Hz, 900 pulse stimulation (WT, 71.11 ± 3.67% of baseline at 1 h after onset of 1 Hz, n = 9 slices, 3 mice; Tg, 80.19 ± 1.91%, n = 15 slices, 5 mice; p < 0.05, t test). B, Significant difference in plasticity following an intermediate 10 Hz, 900 pulse protocol in 1-month-old Tg mice (WT, 87.98 ± 2.98% of baseline at 1 h after onset of 10 Hz, n = 15 slices, 5 mice; Tg, 98.88 ± 2.91%, n = 16 slices, 5 mice; p < 0.05, t test). C, An increase in the magnitude of LTP following a 4×TBS protocol in 1-month-old Tg mice (WT, 124.26 ± 3.75% of baseline at 1 h after 4×TBS, n = 11 slices, 5 mice; Tg, 141.38 ± 5.95%, n = 10 slices, 6 mice; p < 0.05, t test). Insets show representative FP traces (thin line, baseline; thick line, 1 h postinduction stimulation). D–F, Frequency-dependent synaptic plasticity in adult (6-month-old) APPswe/PS1ΔE9 and WT littermates. D, An increase in the magnitude of LTD following a paired-pulse 1 Hz, 900 pulse protocol in 6-month-old Tg mice (WT, 92.20 ± 2.18% of baseline 1 h after onset of paired-pulse 1 Hz, n = 11 slices, 4 mice; Tg, 81.97 ± 2.41%, n = 12 slices, 4 mice; p < 0.01, t test). E, No significant difference in plasticity following an intermediate 10 Hz, 900 pulse protocol in 6-month-old Tg mice (WT, 111.73 ± 3.82% of baseline 1 h after onset of 10 Hz, n = 14 slices, 5 mice; Tg, 102.22 ± 3.26%, n = 15 slices, 5 mice; p = 0.069, t test). F, A decrease in the magnitude of LTP following 4×TBS protocol in 6-month-old Tg mice (WT, 172.31 ± 11.68% of baseline at 1 h after 4×TBS, n = 10 slices, 6 mice; Tg, 139.34 ± 7.24%, n = 12 slices, 5 mice; p < 0.05, t test). Insets show representative FP traces (thin line, baseline; thick line, 1 h postinduction stimulation). Calibrations: 0.5 mV, 5 ms.
We observed an unexpected phenomenon when looking at plasticity across development in WT and Tg mice (Fig. 4). Whereas WT mice show a developmental change to suppress LTD and promote LTP, Tg mice lacked this developmental change (Fig. 4A-C). Therefore, Tg mice produce similar magnitudes of LTP/LTD in both young and adult ages, despite having larger LTP than WT mice at 1 month of age and smaller LTP than WT mice at 6 months of age. In WT mice, the synaptic modification threshold is shifted to the left during development; however, Tg mice do not undergo this developmental shift (Fig. 4D). This suggests that the developmental regulation of metaplasticity is absent in Tg mice, and that they are stuck at an intermediate point of the normal developmental trajectory.
Figure 4.

Defect in developmental regulation of metaplasticity in APPswe/PS1ΔE9 Tg mice. A, WT mice show a reduction in the magnitude of LTD with age. The magnitude of LTD following a 1 Hz protocol does not change over development from 1 month to 6 months in Tg mice (n is the same as in Fig. 3). *p < 0.001 (t test). B, WT mice show a developmental change in the polarity of 10 Hz-induced plasticity. In contrast, the magnitude of plasticity following an intermediate 10 Hz protocol does not change over development from 1 month to 6 months in Tg mice (n is the same as in Fig. 3). *p < 0.001 (t test). C, The magnitude of LTP induced with 4×TBS increased with age in WT mice, and is absent in Tg mice (n is the same as Fig. 3). *p < 0.01 (t test). D, WT mice show a shift in their modification synaptic threshold during development to favor LTP induction. Tg mice start out shifted to favor LTP compared to WT mice. but fail to undergo the developmental metaplasticity.
Altered LTP induction in young APPswe;PS1ΔE9 mice without changes in NMDAR subunit composition or inhibition
We found that the summation of synaptic responses during high-frequency LTP induction was significantly increased in Tg mice compared to those of WT littermates, specifically when they were young (Fig. 5A), but not when they reached adulthood (Fig. 5B). This suggests altered induction mechanisms may underlie enhanced LTP in young Tg mice, but the deficit in LTP seen in adult Tg mice cannot be attributed to alterations in induction mechanisms. Changes in NMDAR subunit composition have been suggested to slide the synaptic modification threshold (Quinlan et al., 1999, 2004; Philpot et al., 2001; Philpot et al., 2003; Cooper and Bear, 2012). Therefore, we compared the expression level of NMDAR subunits GluN2A (NR2A) and GluN2B (NR2B) from hippocampal samples of WT and Tg mice. We found no significant difference in the ratio of GluN2A/GluN2B in either young or adult Tg mice (Fig. 5C). To determine whether the increase in response summation during LTP induction in young Tg mice was due to specific changes in synaptic NMDAR function, we measured pharmacologically isolated NMDAR currents with or without application of the GluN2B antagonist ifenprodil (Fig. 5D). We found that the percentage of NMDAR current amplitude decrease by ifenprodil was similar in CA1 neurons of young WT and Tg mice. In addition, there was no significant difference in the decay kinetics of NMDAR current between the two genotypes under control conditions. Ifenprodil application significantly decreased the decay kinetics, but to similar values between WT and Tg mice. These data suggest that there is no change in the subunit composition of synaptic NMDAR in young Tg mice. Other factors such as inhibitory synaptic transmission also have a large influence on the induction of LTP and LTD (Steele and Mauk, 1999). However, we saw no change in average amplitude, frequency, or charge transfer of mIPSCs (Fig. 5E,F), suggesting that there is no significant change in inhibitory synaptic transmission in young Tg mice. Together, these observations suggest that the resulting changes in synaptic plasticity induction mechanisms in young Tg mice are likely via mechanisms other than regulation of NMDARs or inhibitory function. In adult Tg mice, the lack of high-frequency response summation and NMDAR subunit composition indicate that the induction mechanisms are not altered, and hence it rules out the sliding threshold model of metaplasticity.
Figure 5.
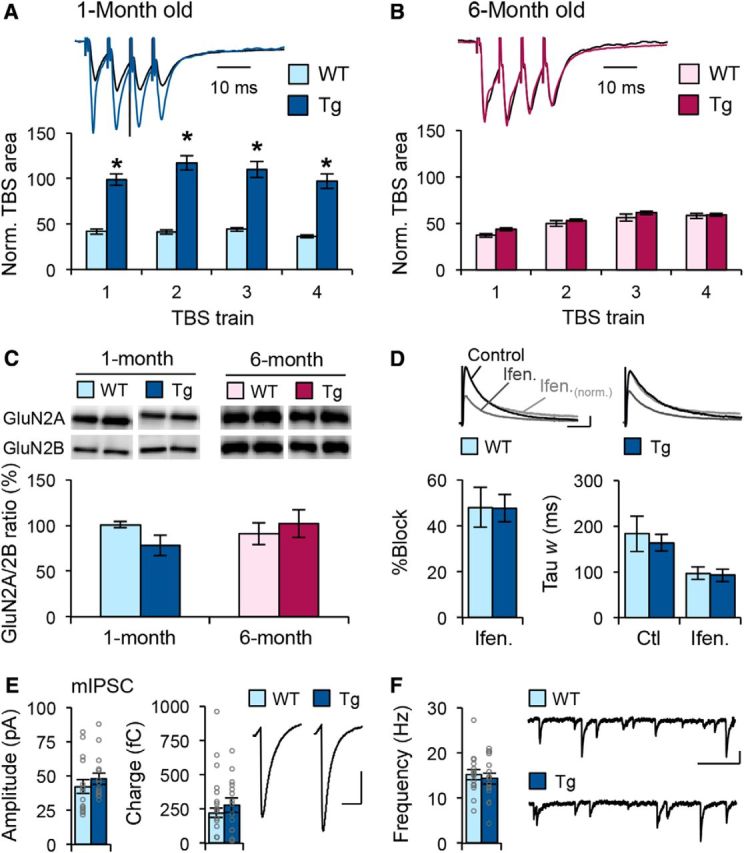
APPswe/PS1ΔE9 Tg mice display enhanced summation of responses during high-frequency stimulation when young, which occurs without changes in NMDA receptor or inhibitory function. A, Increase in the summation of synaptic responses during 4×TBS induction protocol in 1-month-old Tg mice. *p < 0.01 (ANOVA). Top, Representative traces (black line, WT; blue line, Tg). B, No change in the summation of synaptic responses during the 4×TBS induction protocol in 6-month-old Tg mice. Top, Representative traces normalized to baseline FP area (black line, WT; magenta line, Tg). C, No difference in the GluN2A/GluN2B ratio between WT and Tg across ages (1 month, WT, 100.82 ± 3.22% of average WT, n = 10 mice; Tg, 78.05 ± 11.16% of average WT, n = 10 mice; p = 0.077, t test; 6 months, WT, 91.16 ± 12.06%, n = 8 mice; Tg, 102.11 ± 15.18%, n = 8 mice; p = 0.581, t test). Example immunoblot images are shown in the top panels. D, No difference in ifenprodil (Ifen.; 3 μm) sensitivity of NMDAR-mediated responses in 1-month-old Tg mice. Left, Percentage of the response amplitude blocked by ifenprodil (WT, 48.03 ± 8.64%, n = 7 cells, 5 mice; Tg, 47.66 ± 5.95%, n = 10 cells, 5 mice; p = 0.973, t test). Right, Average changes in the weighted decay time constant before and after ifenprodil application (WT, control, 183.23 ± 38.77 ms; ifenprodil, 97.02 ± 13.87 ms; n = 7 cells, 5 mice; Tg, control, 163.41 ± 18.02 ms; ifenprodil, 92.48 ± 13.99 ms; n = 10 cells, 5 mice; t test before, p = 0.654; t test after, p = 0.821). Top, Pharmacologically isolated NMDAR-mediated EPSCs recorded before (black line) and after bath application of ifenprodil (dark gray line). The normalized responses after ifenprodil are also included (light gray line). The traces are normalized to the peak amplitude in control ACSF and represent averages across all cells recorded in each condition (20–40 responses per cell). E, F, Normal inhibitory synaptic transmission in CA1 pyramidal neurons of Tg mice. E, Left, Middle, No difference was found in the average mIPSC amplitude (left, WT, 42.28 ± 5.19 pA, n = 15 cells, 10 mice; Tg, 48.07 ± 4.19 pA, n = 15 cells, 9 mice; p = 0.393, t test; gray circles, individual cell data) or charge transfer (middle, WT, 222.10 ± 33.57 fC, n = 12 slices, 10 mice; Tg, 276.74 ± 52.71 fC, n = 15 slices, 9 mice; p = 0.391, t test; gray circles, individual cell data) between WT and Tg mice. Right, Average mIPSC trace from each group. F, Left, No change was found in average mIPSC frequency (WT, 15.19 ± 1.18 Hz, n = 15 cells, 10 mice; Tg, 14.32 ± 1.24 Hz, n = 15 cells, 9 mice; p = 0.615, t test; gray circles, individual cell data). Right, Representative mIPSC traces taken from cells of each group. Calibrations: D, 20 pA, 100 ms; E, 20 pA, 20 ms; F, 50 pA, 200 ms.
Normal perisynaptic pool of AMPARs, but altered GluA1 phosphorylation, in young APPswe;PS1ΔE9 mice
Although the sliding of the synaptic modification threshold is mainly attributed to changes in the induction mechanisms of LTP/LTD, altered expression mechanisms of synaptic plasticity can also produce similar changes via pull–push metaplasticity (Huang et al., 2012). The pull–push model states that neuromodulators acting on specific G-protein-coupled receptors promote the expression of LTP/LTD by changing phosphorylation states of AMPARs, thereby priming the synapse for LTP or LTD. Therefore, a key feature of the pull–push model is the size of the perisynaptic AMPAR population and the regulation of AMPAR phosphorylation. To determine whether changes in these parameters could attribute to the altered metaplasticity, we compared the level of perisynaptic AMPAR function and phosphorylation of a key AMPAR subunit GluA1. To measure the former, we used TBOA, a glutamate transporter inhibitor, to induce spillover of glutamate that will activate perisynaptic AMPARs (Fig. 6A,B). Although the amplitude of FP recordings increased after TBOA application in WT and Tg mice at both ages, there was no significant difference between genotypes at either age (Fig. 6A,B). This suggests that the size of the functional perisynaptic AMPAR pool is similar between WT and Tg mice.
Figure 6.

APPswe/PS1ΔE9 Tg mice show normal levels of perisynaptic AMPARs, but alterations in GluA1 phosphorylation when young. A, B, Normal perisynaptic AMPAR pool. Amplitudes of FP recordings from CA1 of Tg mice are similar following 10 μm TBOA treatment in young (A; WT, 105.83 ± 3.99% of baseline at 40 min after TBOA, n = 12 slices, 4 mice; Tg, 106.30 ± 2.76%, n = 10 slices, 4 mice; p = 0.922, t test) and adult mice (B; WT, 112.63 ± 2.74% of baseline at 40 min after TBOA, n = 13 slices, 4 mice; Tg, 117.46 ± 4.63%, n = 13 slices, 4 mice; p = 0.380, t test). Top, Representative traces before (thin line) and after (thick line) TBOA. We noted that there might be a developmental increase in the size of the perisynaptic pool as measured as changes in FP after TBOA; however, only the Tg mice showed a significant difference between the two ages (p < 0.05, ANOVA). C, D, Altered GluA1 phosphorylation in CA1 of young, but not adult, Tg mice. Young Tg mice (C) showed no difference in total GluA1 (WT, 97.15 ± 2.88%, n = 7 mice; Tg, 77.83 ± 10.16%, n = 11 mice; p = 0.093, t test), a decrease in the total S845/GluA1 ratio (WT, 103.34 ± 5.31% of average WT, n = 7 mice; Tg, 80.73 ± 6.60% of average WT, n = 10 mice; *p < 0.05, t test), and an increase in the total S831/GluA1 ratio (WT, 102.88 ± 6.30%, n = 8 mice; Tg, 208.39 ± 29.09%, n = 9; *p < 0.01, t test). In contrast, no significant change in either of these measurements was seen in adult Tg mice (D; total GluA1, WT, 101.10 ± 7.86%, n = 10 mice; Tg, 81.93 ± 7.85%, n = 10 mice; p = 0.102, t test; S845/GluA1 ratio, WT, 99.41 ± 4.82%, n = 9 mice; Tg, 133.93 ± 18.54%, n = 10 mice; p = 0.101, t test; S831/GluA1 ratio, WT, 101.28 ± 6.25%, n = 8 mice; Tg, 109.11 ± 5.44%, n = 8 mice; p = 0.362, t test). Top panels show example immunoblots.
Specific phosphorylation sites on AMPAR subunit GluA1, such as GluA1-S845 and GluA1-S831, have been correlated with LTP and LTD (Lee et al., 2000, 2003, 2010). It has also been proposed that soluble Aβ peptides can alter AMPAR endocytosis by modulating downstream kinases and phosphatases, leading to decreased GluA1-S845 phosphorylation and cell-surface AMPARs (Miñano-Molina et al., 2011). Furthermore, changes in GluA1-S845 and S831 phosphorylation sites have been correlated with the pull–push model of metaplasticity (Seol et al., 2007; Huang et al., 2012). In hippocampal samples from young Tg mice, there was no significant difference in the total levels of GluA1, but a decrease in S845/GluA1 ratio and an increase in S831/GluA1 ratio, compared to those from WT littermates (Fig. 6C). This suggests a possible correlation between GluA1-S845 and GluA1-S831 phosphorylation and alterations in LTP/LTD magnitudes seen in young Tg mice. In adult Tg mice, there were no statistically significant changes in total GluA1, S845/GluA1 ratio, or S831/GluA1 ratio (Fig. 6D). Together with normal induction mechanisms in adult Tg (Fig. 5B,C), these data suggest that the expression mechanisms downstream of AMPAR phosphorylation regulation may account for the abnormal LTP/LTD threshold. Collectively, our data support a change in the expression mechanisms of LTP/LTD in the Tg mice, which supports a defect in the pull–push model as a way to explain the observed altered metaplasticity in young and adult Tg mice.
Ca2+-permeable AMPARs at a subset of synapses in young APPswe;PS1ΔE9 mice
The increase in GluA1-S831 phosphorylation in young Tg mice suggests that there may be changes in the function of AMPARs. A previous study showed that GluA1-S831 phosphorylation selectively increases the conductance of GluA1 homomers (Oh and Derkach, 2005), which are Ca2+ permeable (Lee, 2012). To determine whether the increase in GluA1-S831 relates to expression of Ca2+-permeable AMPARs (CP-AMPARs), we compared the sensitivity of AMPAR-mediated mEPSCs to the CP-AMPAR inhibitor naspm. We found that 20 μm naspm significantly decreased the frequency of AMPAR mEPSCs in young Tg mice, but not in WT littermates (Fig. 7A). Naspm did not significantly alter the amplitude of mEPSCs in either genotype (Fig. 7B). Unexpectedly, the frequency of mEPSCs between WT and Tg mice did not differ under control conditions, which apparently contradicts the increased dendritic spine density seen in Tg mice at this age (Fig. 1E). This may be attributable to the fact that mEPSC frequency does not solely reflect the number of synapses, but is also controlled by other factors such as PKA signaling (Carroll et al., 1998) and intracellular Ca2+ stores (Amaral and Pozzo-Miller, 2012). In any case, our main finding that the mEPSC frequency in young Tg mice is decreased by naspm suggests that a subset of synapses express CP-AMPARs, which contrasts WT mice with mainly Ca2+-impermeable AMPARs. CP-AMPARs can summate responses better, because they do not produce outward current when the membrane is depolarized (Bowie and Mayer, 1995). Therefore, our data suggest that the observed offset in the synaptic modification threshold seen in young Tg mice may be due to expression of CP-AMPARs at a subset of synapses.
Figure 7.

Young APPswe/PS1ΔE9 Tg mice display CP-AMPARs at a subset of synapses. A, CP-AMPAR blocker naspm (20 μm) selectively decreased the frequency of AMPAR mEPSCs in young Tg mice, but not in their WT littermates. Left, Comparison of average mEPSC frequency with or without naspm for young WT mice [WT control (CTL), 0.67 ± 0.1 Hz, n = 12 cells; WT naspm, 0.55 ± 0.07 Hz, n = 10 cells; data from 7 mice; p = 0.45, t test] and young Tg littermates (Tg CTL, 0.69 ± 0.1 Hz, n = 10 cells; Tg naspm, 0.39 ± 0.04 Hz, n = 9 cells; data from 5 mice; *p < 0.05, t test). Right, Example traces of mEPSCs from each group. B, Naspm did not alter the amplitude of AMPAR mEPSCs in either genotype. Left, Comparison of average mEPSC amplitude with or without naspm for young WTs (WT CTL, 15.9 ± 1.4 pA, n = 12 cells; WT naspm, 15.5 ± 1.9 pA, n = 10 cells; p = 0.83, t test) and their Tg littermates (Tg CTL, 14.5 ± 1.5 pA, n = 10 cells; Tg naspm, 14.7 ± 0.8 pA, n = 9 cells; p = 0.88, t test). Right, Average mEPSC traces from each group.
Discussion
Here we demonstrate that the observed LTP/LTD deficits seen across age in APPswe;PS1ΔE9 Tg is due to a failure to undergo normal developmental metaplasticity following an abnormal initial set point for the synaptic modification threshold (Fig. 4). In young Tg mice, the synaptic modification threshold was shifted to favor LTP. This was accompanied by greater summation of responses during LTP without changes in the conventional induction mechanisms such as NMDAR or inhibitory function, but we noted CP-AMPAR expression at a subset of synapses. We also observed a change in AMPAR subunit GluA1 phosphorylation levels, which is consistent with a change in synaptic modification threshold according to the pull–push model of metaplasticity (Huang et al., 2012). Whereas WT mice underwent a developmental shift in the synaptic modification threshold from promoting LTD to LTP, Tg mice lacked this change. As a consequence, adult Tg mice displayed LTP and LTD magnitudes similar to when they were young, which, compared to age-matched WT mice, manifested as a faster decay of LTP and enhanced LTD. However, the induction mechanisms and GluA1 phosphorylation were not affected in the adults, suggesting that deficits are likely downstream from these processes. Together, our results argue against changes in NMDAR functionality in the alterations of LTP/LTD in the Tg mice, and underscore the relevance of metaplasticity, operating through yet-to-be-characterized mechanisms, in mediating synaptic dysfunction in AD mouse models.
Differential contribution of FAD-linked mutations across age
Mouse models expressing various FAD-linked mutations in APP, PS1, or PS2 often express different, even opposite, alterations in synaptic function and plasticity (Marchetti and Marie, 2011). The APP and PS1 FAD mutations in our mouse model may contribute differently to synaptic dysfunction due to a difference in their relative contributions to synaptic phenotypes with age. In young (1-month-old) animals, the contribution of Aβ peptides to synaptic phenotypes is expected to be small, and therefore any phenotypes seen in young mice may be due to the FAD-linked mutation in PS1. Indeed, increased basal synaptic function, dendritic spine density, and LTP seen in our Tg mice (Figs. 1A-F, 3C) are phenotypes shared with similar-aged Tg mice harboring only PS1 FAD-linked mutations (Zaman et al., 2000; Dewachter et al., 2002; Jung et al., 2011). In adults (6-month-old), synaptic dysfunctions likely reflect the increased amyloid load (Jankowsky et al., 2004; Savonenko et al., 2005). Consistent with this idea, reduced LTP and decreased dendritic spine density seen in adult APPswe;PS1ΔE9 Tg mice (Figs. 2A-F, 3F) have also been observed in other mouse models expressing mutated APP protein (Chapman et al., 1999; Fitzjohn et al., 2001; Trinchese et al., 2004; Spires et al., 2005; Palop et al., 2007). The observed differences in presynaptic function in adult Tg mice (Fig. 2G,H) are likely due to an altered calcium dynamic caused by the FAD-linked mutation in PS1, which is known to enhance Ca2+ release from the ER (Guo et al., 1997; Stutzmann et al., 2004, 2006; Tu et al., 2006; Cheung et al., 2008; Müller et al., 2011). Mice expressing a single APPswe mutation at this age do not show changes in PPF ratio (Chapman et al., 1999; Palop et al., 2007). We propose that age-dependent changes in the relative contributions of FAD mutations correlate with the opposite synaptic dysfunction phenotypes seen across ages. Age-dependent opposite phenotypes seen in preamyloidogenic and postamyloidogenic mice is reminiscent of a previous study, which showed that mild cognitive impairment and AD patients display opposite gene expression profiles compared to normal aged controls (Berchtold et al., 2014).
Altered induction versus expression mechanisms of LTP/LTD in APPswe;PS1ΔE9 Tg mice
We found that the synaptic modification threshold is shifted to promote LTP at the expense of LTD in young Tg mice, but adult Tg mice show the opposite phenotype of less LTP and larger LTD compared to WT mice (Fig. 3). We attribute these changes in the Tg mice to the initial offset in the synaptic modification threshold and a failure to undergo the normal developmental shift in metaplasticity (Fig. 4). An increased excitatory synapse number and enhancement of synaptic summation during LTP induction stimuli accompanied the synaptic plasticity defects seen in young Tg mice. Whereas these changes indicate alterations in the induction mechanisms of LTP, we did not observe changes in synaptic NMDAR subunit composition (Fig. 5C,D) or changes in inhibitory synaptic transmission (E,F), both of which have been implicated as major mechanisms for mediating the sliding threshold of metaplasticity (Steele and Mauk, 1999; Cooper and Bear, 2012). However, we did observe changes in AMPAR phosphorylation levels (Fig. 6C) and the appearance of CP-AMPARs at synapses (Fig. 7). Importantly, GluA1-S831 phosphorylation selectively increases the conductance of Ca2+-permeable GluA1 homomers (Oh and Derkach, 2005), which also are better at summating responses (Bowie and Mayer, 1995). Thus, the synaptic expression of CP-AMPARs and phosphorylation of GluA1-S831 are likely to promote LTP. In support of this idea, GluA1 phosphorylation at S845 and S831 has been shown to decrease the threshold for producing LTP (Hu et al., 2007; Makino et al., 2011), similar to what we observed in young Tg mice (Figs. 3, 4). The CP-AMPAR phenotype seen in young Tg mice is similar to that reported in knock-in mice carrying a mutation in AKAP150 that abolishes calcineurin binding (Sanderson et al., 2012). In this mouse model, synaptic CP-AMPAR appearance resulted in a loss of LTD and enhancement of LTP, which recovered to normal levels in the presence of a CP-AMPAR inhibitor. These results further support the idea that aberrant synaptic CP-AMPAR expression may be responsible for the altered synaptic modification threshold seen in our study. In addition, or alternatively, the enhanced LTP in young Tg mice could be due to dysregulation of intracellular calcium dynamics due to the FAD-linked mutation in PS1 (Honarnejad and Herms, 2012). It is possible that the increase in GluA1-S831, which is a specific substrate of CaMKII and PKC (Roche et al., 1996; Mammen et al., 1997), is a consequence of the increased intracellular Ca2+ signaling triggered by PS1 mutation. CP-AMPARs in young Tg mice (Fig. 7) are expected to further exacerbate the dysregulation of Ca2+ signaling.
In adult Tg mice, we did not observe changes in the summation of synaptic responses during LTP induction or in NMDAR subunit composition (Fig. 5B,C). Therefore, the synaptic deficits at this age are most likely due to altered expression mechanisms consistent with the pull–push model of metaplasticity (Huang et al., 2012). However, dysregulation of the expression mechanisms is not at the level of changes in basal phosphorylation of AMPARs (Fig. 6D), which suggests that the defect may lie downstream of this process. A proposed key mechanism of LTP expression is synaptic recruitment and stabilization of AMPARs from a perisynaptic pool, but we did not observe a change in the size of the perisynaptic AMPAR pool in adult Tg mice (Fig. 6B). This suggests that the deficit in LTP is not due to insufficient AMPARs available for synaptic insertion. This, together with our observation of a normal initial magnitude of LTP but a faster decay (Fig. 3F), suggests that there may be a failure to stabilize AMPARs at synapses following LTP. Synaptic stabilization of AMPARs is thought to occur via interaction of AMPARs with a hypothetical “slot” protein at the postsynaptic density (Kessels and Malinow, 2009). According to this hypothesis, the ability to generate new “slots” during LTP may be compromised in adult Tg mice.
Defective developmental metaplasticity in APPswe;PS1ΔE9 Tg mice
WT mice undergo a shift in the synaptic modification to favor LTP as they mature (Fig. 4D). In contrast, Tg mice show an initial aberrant offset in the synaptic modification threshold, likely due to the PS1 mutation (as discussed in the previous section), that is not developmentally regulated (Fig. 4). We propose that the main defect that prevents normal developmental metaplasticity in adults is due to the APP mutation that enhances Aβ production. This is based on the fact that reduced LTP magnitude is observed in adult AD mouse models with diverse FAD-linked APP mutations that elevated Aβ (for review, see Marchetti and Marie, 2011). However, LTP defect is not universally observed in all AD mouse models with FAD-linked APP mutations, and the time point at which LTP defect is manifested varies across mouse models (Marchetti and Marie, 2011). We surmise that the diversity seen in LTP phenotypes across AD mouse models is likely a consequence of how the initial offset in synaptic modification threshold is set up by the various FAD-linked mutations. We propose that the common defect across the mouse models is the lack of normal developmental regulation of metaplasticity. Whether this is the case will require further investigation using other AD mouse models. Synaptic dysfunctions observed here precede cognitive deficits seen in the same mouse model (Savonenko et al., 2005), suggesting that recovery of synaptic function may benefit cognitive performance. Our results suggest that normalizing metaplasticity mechanisms, rather than enhancing LTP, may be useful for recovering synaptic function in AD mouse models.
Footnotes
This work was supported by an NIH Grant R01-AG034606 (A.K.).
The authors declare no competing financial interests.
References
- Amaral MD, Pozzo-Miller L. Intracellular Ca2+ stores and Ca2+ influx are both required for BDNF to rapidly increase quantal vesicular transmitter release. Neural Plast. 2012;2012:203536. doi: 10.1155/2012/203536. [DOI] [PMC free article] [PubMed] [Google Scholar]
- Bear MF, Cooper LN, Ebner FF. A physiological basis for a theory of synapse modification. Science. 1987;237:42–48. doi: 10.1126/science.3037696. [DOI] [PubMed] [Google Scholar]
- Berchtold NC, Sabbagh MN, Beach TG, Kim RC, Cribbs DH, Cotman CW. Brain gene expression patterns differentiate mild cognitive impairment from normal aged and Alzheimer's disease. Neurobiol Aging. 2014;35:1961–1972. doi: 10.1016/j.neurobiolaging.2014.03.031. [DOI] [PMC free article] [PubMed] [Google Scholar]
- Bezprozvanny I, Mattson MP. Neuronal calcium mishandling and the pathogenesis of Alzheimer's disease. Trends Neurosci. 2008;31:454–463. doi: 10.1016/j.tins.2008.06.005. [DOI] [PMC free article] [PubMed] [Google Scholar]
- Bienenstock EL, Cooper LN, Munro PW. Theory for the development of neuron selectivity: orientation specificity and binocular interaction in visual cortex. J Neurosci. 1982;2:32–48. doi: 10.1523/JNEUROSCI.02-01-00032.1982. [DOI] [PMC free article] [PubMed] [Google Scholar]
- Bowie D, Mayer ML. Inward rectification of both AMPA and kainate subtype glutamate receptors generated by polyamine-mediated ion channel block. Neuron. 1995;15:453–462. doi: 10.1016/0896-6273(95)90049-7. [DOI] [PubMed] [Google Scholar]
- Carroll RC, Nicoll RA, Malenka RC. Effects of PKA and PKC on miniature excitatory postsynaptic currents in CA1 pyramidal cells. J Neurophysiol. 1998;80:2797–2800. doi: 10.1152/jn.1998.80.5.2797. [DOI] [PubMed] [Google Scholar]
- Chapman PF, White GL, Jones MW, Cooper-Blacketer D, Marshall VJ, Irizarry M, Younkin L, Good MA, Bliss TV, Hyman BT, Younkin SG, Hsiao KK. Impaired synaptic plasticity and learning in aged amyloid precursor protein transgenic mice. Nat Neurosci. 1999;2:271–276. doi: 10.1038/6374. [DOI] [PubMed] [Google Scholar]
- Cheung KH, Shineman D, Müller M, Cárdenas C, Mei L, Yang J, Tomita T, Iwatsubo T, Lee VM, Foskett JK. Mechanism of Ca2+ disruption in Alzheimer's disease by presenilin regulation of InsP3 receptor channel gating. Neuron. 2008;58:871–883. doi: 10.1016/j.neuron.2008.04.015. [DOI] [PMC free article] [PubMed] [Google Scholar]
- Cooper LN, Bear MF. The BCM theory of synapse modification at 30: interaction of theory with experiment. Nature Rev Neurosci. 2012;13:798–810. doi: 10.1038/nrn3353. [DOI] [PubMed] [Google Scholar]
- Dewachter I, Reversé D, Caluwaerts N, Ris L, Kuipéri C, Van den Haute C, Spittaels K, Umans L, Serneels L, Thiry E, Moechars D, Mercken M, Godaux E, Van Leuven F. Neuronal deficiency of presenilin 1 inhibits amyloid plaque formation and corrects hippocampal long-term potentiation but not a cognitive defect of amyloid precursor protein [V717I] transgenic mice. J Neurosci. 2002;22:3445–3453. doi: 10.1523/JNEUROSCI.22-09-03445.2002. [DOI] [PMC free article] [PubMed] [Google Scholar]
- Fitzjohn SM, Morton RA, Kuenzi F, Rosahl TW, Shearman M, Lewis H, Smith D, Reynolds DS, Davies CH, Collingridge GL, Seabrook GR. Age-related impairment of synaptic transmission but normal long-term potentiation in transgenic mice that overexpress the human APP695SWE mutant form of amyloid precursor protein. J Neurosci. 2001;21:4691–4698. doi: 10.1523/JNEUROSCI.21-13-04691.2001. [DOI] [PMC free article] [PubMed] [Google Scholar]
- Guo Q, Sopher BL, Furukawa K, Pham DG, Robinson N, Martin GM, Mattson MP. Alzheimer's presenilin mutation sensitizes neural cells to apoptosis induced by trophic factor withdrawal and amyloid beta-peptide: involvement of calcium and oxyradicals. J Neurosci. 1997;17:4212–4222. doi: 10.1523/JNEUROSCI.17-11-04212.1997. [DOI] [PMC free article] [PubMed] [Google Scholar]
- Honarnejad K, Herms J. Presenilins: role in calcium homeostasis. Int J Biochem Cell Biol. 2012;44:1983–1986. doi: 10.1016/j.biocel.2012.07.019. [DOI] [PubMed] [Google Scholar]
- Hu H, Real E, Takamiya K, Kang MG, Ledoux J, Huganir RL, Malinow R. Emotion enhances learning via norepinephrine regulation of AMPA-receptor trafficking. Cell. 2007;131:160–173. doi: 10.1016/j.cell.2007.09.017. [DOI] [PubMed] [Google Scholar]
- Huang S, Treviño M, He K, Ardiles A, Pasquale R, Guo Y, Palacios A, Huganir R, Kirkwood A. Pull-push neuromodulation of LTP and LTD enables bidirectional experience-induced synaptic scaling in visual cortex. Neuron. 2012;73:497–510. doi: 10.1016/j.neuron.2011.11.023. [DOI] [PMC free article] [PubMed] [Google Scholar]
- Jankowsky JL, Fadale DJ, Anderson J, Xu GM, Gonzales V, Jenkins NA, Copeland NG, Lee MK, Younkin LH, Wagner SL, Younkin SG, Borchelt DR. Mutant presenilins specifically elevate the levels of the 42 residue beta-amyloid peptide in vivo: evidence for augmentation of a 42-specific gamma secretase. Human Mol Gen. 2004;13:159–170. doi: 10.1093/hmg/ddh019. [DOI] [PubMed] [Google Scholar]
- Jung CK, Fuhrmann M, Honarnejad K, Van Leuven F, Herms J. Role of presenilin 1 in structural plasticity of cortical dendritic spines in vivo. J Neurochem. 2011;119:1064–1073. doi: 10.1111/j.1471-4159.2011.07503.x. [DOI] [PubMed] [Google Scholar]
- Kessels HW, Malinow R. Synaptic AMPA receptor plasticity and behavior. Neuron. 2009;61:340–350. doi: 10.1016/j.neuron.2009.01.015. [DOI] [PMC free article] [PubMed] [Google Scholar]
- Lee HK. Ca-permeable AMPA receptors in homeostatic synaptic plasticity. Front Mol Neurosci. 2012;5:17. doi: 10.3389/fnmol.2012.00017. [DOI] [PMC free article] [PubMed] [Google Scholar]
- Lee HK, Barbarosie M, Kameyama K, Bear MF, Huganir RL. Regulation of distinct AMPA receptor phosphorylation sites during bidirectional synaptic plasticity. Nature. 2000;405:955–959. doi: 10.1038/35016089. [DOI] [PubMed] [Google Scholar]
- Lee HK, Takamiya K, Han JS, Man H, Kim CH, Rumbaugh G, Yu S, Ding L, He C, Petralia RS, Wenthold RJ, Gallagher M, Huganir RL. Phosphorylation of the AMPA receptor GluR1 subunit is required for synaptic plasticity and retention of spatial memory. Cell. 2003;112:631–643. doi: 10.1016/S0092-8674(03)00122-3. [DOI] [PubMed] [Google Scholar]
- Lee HK, Takamiya K, He K, Song L, Huganir RL. Specific roles of AMPA receptor subunit GluR1 (GluA1) phosphorylation sites in regulating synaptic plasticity in the CA1 region of hippocampus. J Neurophysiol. 2010;103:479–489. doi: 10.1152/jn.00835.2009. [DOI] [PMC free article] [PubMed] [Google Scholar]
- Makino Y, Johnson RC, Yu Y, Takamiya K, Huganir RL. Enhanced synaptic plasticity in mice with phosphomimetic mutation of the GluA1 AMPA receptor. Proc Natl Acad Sci U S A. 2011;108:8450–8455. doi: 10.1073/pnas.1105261108. [DOI] [PMC free article] [PubMed] [Google Scholar]
- Mammen AL, Kameyama K, Roche KW, Huganir RL. Phosphorylation of the alpha-amino-3-hydroxy-5-methylisoxazole4-propionic acid receptor GluR1 subunit by calcium/calmodulin-dependent kinase II. J Biol Chem. 1997;272:32528–32533. doi: 10.1074/jbc.272.51.32528. [DOI] [PubMed] [Google Scholar]
- Marchetti C, Marie H. Hippocampal synaptic plasticity in Alzheimer's disease: what have we learned so far from transgenic models? Rev Neurosci. 2011;22:373–402. doi: 10.1515/RNS.2011.035. [DOI] [PubMed] [Google Scholar]
- Megill A, Lee T, DiBattista AM, Song JM, Spitzer MH, Rubinshtein M, Habib LK, Capule CC, Mayer M, Turner RS, Kirkwood A, Yang J, Pak DT, Lee HK, Hoe HS. A tetra(ethylene glycol) derivative of benzothiazole aniline enhances Ras-mediated spinogenesis. J Neurosci. 2013;33:9306–9318. doi: 10.1523/JNEUROSCI.1615-12.2013. [DOI] [PMC free article] [PubMed] [Google Scholar]
- Miñano-Molina AJ, España J, Martín E, Barneda-Zahonero B, Fadó R, Solé M, Trullás R, Saura CA, Rodríguez-Alvarez J. Soluble oligomers of amyloid-beta peptide disrupt membrane trafficking of alpha-amino-3-hydroxy-5-methylisoxazole-4-propionic acid receptor contributing to early synapse dysfunction. J Biol Chem. 2011;286:27311–27321. doi: 10.1074/jbc.M111.227504. [DOI] [PMC free article] [PubMed] [Google Scholar]
- Müller M, Cárdenas C, Mei L, Cheung KH, Foskett JK. Constitutive cAMP response element binding protein (CREB) activation by Alzheimer's disease presenilin-driven inositol trisphosphate receptor (InsP3R) Ca2+ signaling. Proc Natl Acad Sci U S A. 2011;108:13293–13298. doi: 10.1073/pnas.1109297108. [DOI] [PMC free article] [PubMed] [Google Scholar]
- Oh MC, Derkach VA. Dominant role of the GluR2 subunit in regulation of AMPA receptors by CaMKII. Nat Neurosci. 2005;8:853–854. doi: 10.1038/nn1476. [DOI] [PubMed] [Google Scholar]
- Palop JJ, Mucke L. Amyloid-beta-induced neuronal dysfunction in Alzheimer's disease: from synapses toward neural networks. Nat Neurosci. 2010;13:812–818. doi: 10.1038/nn.2583. [DOI] [PMC free article] [PubMed] [Google Scholar]
- Palop JJ, Chin J, Roberson ED, Wang J, Thwin MT, Bien-Ly N, Yoo J, Ho KO, Yu GQ, Kreitzer A, Finkbeiner S, Noebels JL, Mucke L. Aberrant excitatory neuronal activity and compensatory remodeling of inhibitory hippocampal circuits in mouse models of Alzheimer's disease. Neuron. 2007;55:697–711. doi: 10.1016/j.neuron.2007.07.025. [DOI] [PMC free article] [PubMed] [Google Scholar]
- Philpot BD, Sekhar AK, Shouval HZ, Bear MF. Visual experience and deprivation bidirectionally modify the composition and function of NMDA receptors in visual cortex. Neuron. 2001;29:157–169. doi: 10.1016/S0896-6273(01)00187-8. [DOI] [PubMed] [Google Scholar]
- Philpot BD, Espinosa JS, Bear MF. Evidence for altered NMDA receptor function as a basis for metaplasticity in visual cortex. J Neurosci. 2003;23:5583–5588. doi: 10.1523/JNEUROSCI.23-13-05583.2003. [DOI] [PMC free article] [PubMed] [Google Scholar]
- Quinlan EM, Olstein DH, Bear MF. Bidirectional, experience-dependent regulation of N-methyl-d-aspartate receptor subunit composition in the rat visual cortex during postnatal development. Proc Natl Acad Sci U S A. 1999;96:12876–12880. doi: 10.1073/pnas.96.22.12876. [DOI] [PMC free article] [PubMed] [Google Scholar]
- Quinlan EM, Lebel D, Brosh I, Barkai E. A molecular mechanism for stabilization of learning-induced synaptic modifications. Neuron. 2004;41:185–192. doi: 10.1016/S0896-6273(03)00874-2. [DOI] [PubMed] [Google Scholar]
- Roche KW, O'Brien RJ, Mammen AL, Bernhardt J, Huganir RL. Characterization of multiple phosphorylation sites on the AMPA receptor GluR1 subunit. Neuron. 1996;16:1179–1188. doi: 10.1016/S0896-6273(00)80144-0. [DOI] [PubMed] [Google Scholar]
- Rumbaugh G, Vicini S. Distinct synaptic and extrasynaptic NMDA receptors in developing cerebellar granule neurons. J Neurosci. 1999;19:10603–10610. doi: 10.1523/JNEUROSCI.19-24-10603.1999. [DOI] [PMC free article] [PubMed] [Google Scholar]
- Sanderson JL, Gorski JA, Gibson ES, Lam P, Freund RK, Chick WS, Dell'Acqua ML. AKAP15-anchored calcineurin regulates synaptic plasticity by limiting synaptic incorportation of Ca2+-permeable AMPA receptors. J Neurosci. 2012;32:15036–15052. doi: 10.1523/JNEUROSCI.3326-12.2012. [DOI] [PMC free article] [PubMed] [Google Scholar]
- Savonenko A, Xu GM, Melnikova T, Morton JL, Gonzales V, Wong MP, Price DL, Tang F, Markowska AL, Borchelt DR. Episodic-like memory deficits in the APPswe/PS1dE9 mouse model of Alzheimer's disease: relationships to beta-amyloid deposition and neurotransmitter abnormalities. Neurobiol Dis. 2005;18:602–617. doi: 10.1016/j.nbd.2004.10.022. [DOI] [PubMed] [Google Scholar]
- Seol GH, Ziburkus J, Huang S, Song L, Kim IT, Takamiya K, Huganir RL, Lee HK, Kirkwood A. Neuromodulators control the polarity of spike-timing-dependent synaptic plasticity. Neuron. 2007;55:919–929. doi: 10.1016/j.neuron.2007.08.013. [DOI] [PMC free article] [PubMed] [Google Scholar]
- Shankar GM, Walsh DM. Alzheimer's disease: synaptic dysfunction and Abeta. Mol Neurodegener. 2009;4:48. doi: 10.1186/1750-1326-4-48. [DOI] [PMC free article] [PubMed] [Google Scholar]
- Sperling RA, Dickerson BC, Pihlajamaki M, Vannini P, LaViolette PS, Vitolo OV, Hedden T, Becker JA, Rentz DM, Selkoe DJ, Johnson KA. Functional alterations in memory networks in early Alzheimer's disease. Neuromolecular Med. 2010;12:27–43. doi: 10.1007/s12017-009-8109-7. [DOI] [PMC free article] [PubMed] [Google Scholar]
- Spires TL, Meyer-Luehmann M, Stern EA, McLean PJ, Skoch J, Nguyen PT, Bacskai BJ, Hyman BT. Dendritic spine abnormalities in amyloid precursor protein transgenic mice demonstrated by gene transfer and intravital multiphoton microscopy. J Neurosci. 2005;25:7278–7287. doi: 10.1523/JNEUROSCI.1879-05.2005. [DOI] [PMC free article] [PubMed] [Google Scholar]
- Steele PM, Mauk MD. Inhibitory control of LTP and LTD: stability of synapse strength. J Neurophysiol. 1999;81:1559–1566. doi: 10.1152/jn.1999.81.4.1559. [DOI] [PubMed] [Google Scholar]
- Stutzmann GE, Caccamo A, LaFerla FM, Parker I. Dysregulated IP3 signaling in cortical neurons of knock-in mice expressing an Alzheimer's-linked mutation in presenilin1 results in exaggerated Ca2+ signals and altered membrane excitability. J Neurosci. 2004;24:508–513. doi: 10.1523/JNEUROSCI.4386-03.2004. [DOI] [PMC free article] [PubMed] [Google Scholar]
- Stutzmann GE, Smith I, Caccamo A, Oddo S, Laferla FM, Parker I. Enhanced ryanodine receptor recruitment contributes to Ca2+ disruptions in young, adult, and aged Alzheimer's disease mice. J Neurosci. 2006;26:5180–5189. doi: 10.1523/JNEUROSCI.0739-06.2006. [DOI] [PMC free article] [PubMed] [Google Scholar]
- Trinchese F, Liu S, Battaglia F, Walter S, Mathews PM, Arancio O. Progressive age-related development of Alzheimer-like pathology in APP/PS1 mice. Ann Neurol. 2004;55:801–814. doi: 10.1002/ana.20101. [DOI] [PubMed] [Google Scholar]
- Tu H, Nelson O, Bezprozvanny A, Wang Z, Lee SF, Hao YH, Serneels L, De Strooper B, Yu G, Bezprozvanny I. Presenilins form ER Ca2+ leak channels, a function disrupted by familial Alzheimer's disease-linked mutations. Cell. 2006;126:981–993. doi: 10.1016/j.cell.2006.06.059. [DOI] [PMC free article] [PubMed] [Google Scholar]
- Zaman SH, Parent A, Laskey A, Lee MK, Borchelt DR, Sisodia SS, Malinow R. Enhanced synaptic potentiation in transgenic mice expressing presenilin 1 familial Alzheimer's disease mutation is normalized with a benzodiazepine. Neurobiol Dis. 2000;7:54–63. doi: 10.1006/nbdi.1999.0271. [DOI] [PubMed] [Google Scholar]