eLife logoLink to eLife
. 2015 Jul 23;4:e06620. doi: 10.7554/eLife.06620

Seasonal shift in timing of vernalization as an adaptation to extreme winter

Susan Duncan 1, Svante Holm 2, Julia Questa 1, Judith Irwin 1, Alastair Grant 3, Caroline Dean 1,*
Editor: Detlef Weigel4
PMCID: PMC4532801  PMID: 26203563

Abstract

The requirement for vernalization, a need for prolonged cold to trigger flowering, aligns reproductive development with favorable spring conditions. In Arabidopsis thaliana vernalization depends on the cold-induced epigenetic silencing of the floral repressor locus FLC. Extensive natural variation in vernalization response is associated with A. thaliana accessions collected from different geographical regions. Here, we analyse natural variation for vernalization temperature requirement in accessions, including those from the northern limit of the A. thaliana range. Vernalization required temperatures above 0°C and was still relatively effective at 14°C in all the accessions. The different accessions had characteristic vernalization temperature profiles. One Northern Swedish accession showed maximum vernalization at 8°C, both at the level of flowering time and FLC chromatin silencing. Historical temperature records predicted all accessions would vernalize in autumn in N. Sweden, a prediction we validated in field transplantation experiments. The vernalization response of the different accessions was monitored over three intervals in the field and found to match that when the average field temperature was given as a constant condition. The vernalization temperature range of 0–14°C meant all accessions fully vernalized before snowfall in N. Sweden. These findings have important implications for understanding the molecular basis of adaptation and for predicting the consequences of climate change on flowering time.

DOI: http://dx.doi.org/10.7554/eLife.06620.001

Research organism: Arabidopsis

eLife digest

Plants are not able to move around and so they need to be able to adapt their growth and development to seasonal changes in their environment. For example, prolonged exposure to cold temperatures during winter can prime some plants to flower when temperatures increase in the spring—a process called vernalization. In these plants, extended periods of cold temperatures lead to lower activity of a gene called FLC, which normally inhibits flowering.

In the plant Arabidopsis thaliana, vernalization requires several months of exposure to temperatures between 0–6°C. Recently, A. thaliana plants from southern Europe were found to vary in the temperature requirements for vernalization, responding to temperatures higher than 6°C. This suggested that plants from northern Europe might vernalize preferentially at lower temperatures. Here, Duncan et al. compared vernalization in a collection of A. thaliana plants (or ‘accessions’) sampled from different regions of Sweden and the UK.

The experiments show that all the accessions needed temperatures above 0°C to vernalize and that vernalization still worked relatively well at temperatures as high as 14°C. The optimal temperature range for vernalization differed between the accessions, but plants from more northern areas did not necessarily vernalize at lower temperatures. For example, for one particular accession from northern Sweden, the temperature that is optimum for vernalization was 8°C, a notably higher temperature than expected.

Historical local climate records suggested that this accession would vernalize before the first snowfall of the winter in North Sweden. Duncan et al. confirmed this proposal with field experiments. Plants were grown in natural field sites in September and then moved into a greenhouse. The experiments show that the plants complete vernalization by November, which strongly suggests that FLC is silenced during autumn rather than during winter, as previously thought. This changed temperature response is due, in part, to a small number of tiny genetic differences in regions of the FLC gene that do not code for protein.

These findings have important implications for future studies of vernalization and flowering time, and for understanding how plants will adapt to on going and future climate change. The next step is to understand what causes these changed temperature responses at a molecular level, which should enable selective breeding for flowering and harvest date in a range of crops.

DOI: http://dx.doi.org/10.7554/eLife.06620.002

Introduction

The sessile nature of plants necessitates that they modulate most aspects of their growth and development in response to external conditions. One aspect of this is the alignment of developmental transitions with seasonal cues. A major seasonal cue is temperature and plants have evolved the ability to integrate daily fluctuations in external temperature in order to monitor long-term trends (Aikawa et al., 2010). Exposure to weeks of cold temperature accelerates the transition to flowering in a process called vernalization. In Arabidopsis thaliana vernalization involves the quantitative epigenetic silencing of FLC (Michaels and Amasino, 1999; Sheldon et al., 1999). Cold exposure promotes a cell-autonomous epigenetic switch at FLC in an increasing proportion of cells (Angel et al., 2011, 2015). This epigenetic switching mechanism requires a Polycomb complex associated with PHD proteins (De Lucia et al., 2008), including the cold-induced VIN3 (Sung and Amasino, 2004). This enables activation of FT, is a potent activator of flowering in A. thaliana (Searle et al., 2006). At a standard vernalization temperature of 5°C, the length of cold required to achieve complete epigenetic silencing varies between A. thaliana accessions and this maps to non-coding cis polymorphisms in FLC (Coustham et al., 2012; Li et al., 2014). Accessions collected from northerly latitudes typically require longer vernalization, for example, the accession Lov-1 originates from near the northerly limit of the Arabidopsis range in Lövvik, North Sweden (62.5°N) and requires three months of vernalization to fully accelerate flowering (Shindo et al., 2006; Coustham et al., 2012).

Effective temperature ranges for vernalization have been determined empirically for different plant species, many of which have been incorporated into chilling unit models that are widely used in agriculture (Byrne and Bacon, 1992). A genetically informed photothermal model for flowering in A. thaliana has assumed that vernalization occurs when daytime hourly temperatures are higher than 0°C and lower than 6°C (Wilczek et al., 2009; Chew et al., 2012, 2014). However, accessions from southern Europe have been found to vernalize at constant temperatures significantly higher than 6°C (Wollenberg and Amasino, 2012), suggesting that accessions from northerly latitudes might vernalize most efficiently at relatively low temperatures. Here, we show this is not the case and find that vernalization in a range of A. thaliana accessions is most effective across a relatively high temperature range with the N. Swedish accession Lov-1, showing maximal vernalization at 8°C. We show that vernalization is complete before snowfall in N. Sweden with the plants flowering immediately upon snowmelt. Vernalization responsiveness in the field matched that when the average monthly temperature was given as constant conditions. Our work has important implications for modeling flowering time and predicting the impact of climate change.

Results and discussion

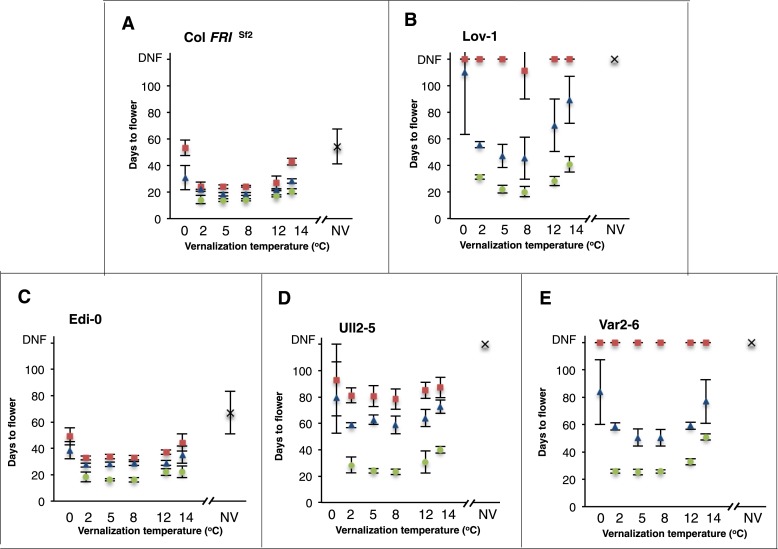
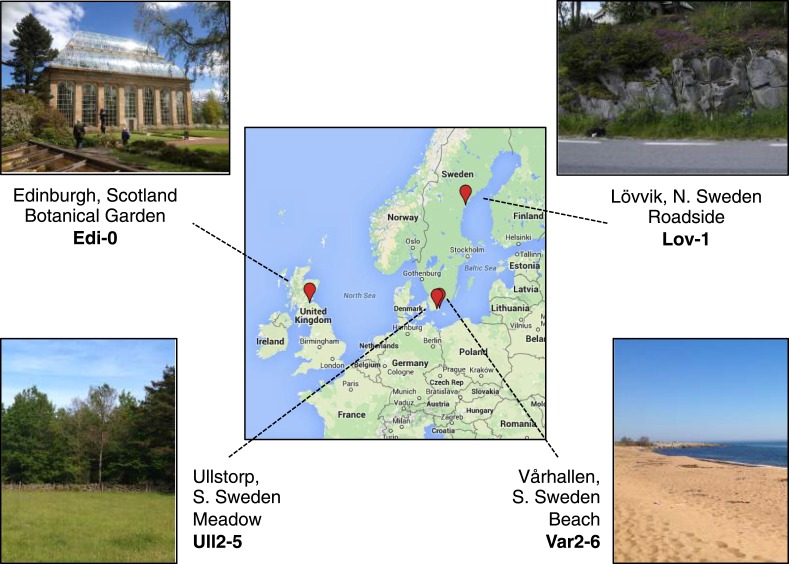
In order to investigate natural variation for vernalization temperature requirement in A. thaliana accessions we selected several genotypes that represent most of the major FLC haplotypes (Li et al., 2014): Lov-1 (Lövvik, N. Sweden—latitude 62.5°N), Var2-6 (Vårhallen, S. Sweden—latitude 55.58°N), Ull2-5 (Ullstorp, S. Sweden—latitude 56.06°N), Edi-0 (Edinburgh, UK—latitude 55.95°N) and the reference Columbia line containing FRIGIDA (Col FRISf2, [Michaels and Amasino, 1999]) (Figure 1—figure supplement 1). All genotypes were vernalized for varying periods at different constant temperatures between 0°C and 14°C and the efficiency of vernalization assayed by determining flowering time (Figure 1A-E). All the genotypes showed limited vernalization after 4 and 6 weeks exposure to 0°C and vernalized more efficiently at all other temperatures. Col FRISf2 and Edi-0 were most effectively vernalized after 4, 6 or 12 weeks at 2°C, 5°C and 8°C and still vernalized relatively efficiently at 12°C and 14°C (Figure 1A and C). Even after 2 weeks of cold at 2°C and 8°C the flowering of Col FRISf2 plants was similar, so lack of any difference was not due to vernalization being close to saturation (Figure 1—figure supplement 2). Ull2-5 showed similar temperature sensitivity to Col FRISf2 and Edi-0, but required 12 weeks for vernalization to be fully effective (Figure 1D). In contrast, Lov-1 and Var2-6 plants showed a differential response to temperature with 2 and 12°C less effective than 5 and 8°C after 6-weeks vernalization (Figure 1B and E). For Lov-1 the only temperature that resulted in flowering after 4 weeks exposure was 8°C and although the enhanced effect of this temperature diminished over time, 8°C consistently resulted in the most effective vernalization (Figure 1B). Thus, the different accessions show distinct temperature profiles for vernalization and all require temperatures higher than 0°C.

Figure 1. Vernalization responses at a range of constant temperatures.

Days to flower were recorded for five genotypes after 0 (crosses), 4 (red squares), 6 (blue triangles) and 12 (green circles) weeks vernalization at a range of temperatures, n ≥ 10. NV = non-vernalized. Error bars = ±S.D.

DOI: http://dx.doi.org/10.7554/eLife.06620.003

Figure 1.

Figure 1—figure supplement 1. Map showing accession collection sites.

Figure 1—figure supplement 1.

Image generated using Google Maps (GeoBasis-DE/BKG 2009).

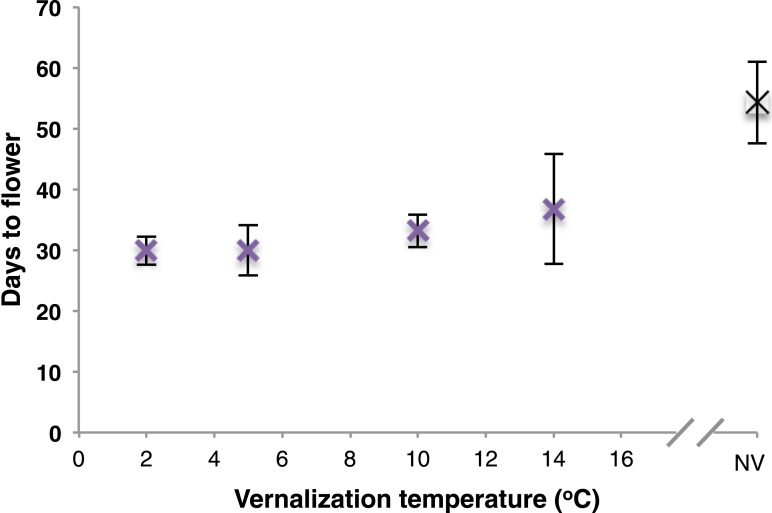
Figure 1—figure supplement 2. 2 week vernalization of Col FRISf2 does not reveal differential response to 2 and 5°C treatments.

Figure 1—figure supplement 2.

Days to flowering recorded after 2 weeks vernalization at a range of temperatures. n = 12. NV = nonvernalized. Error bars = ±S.D.

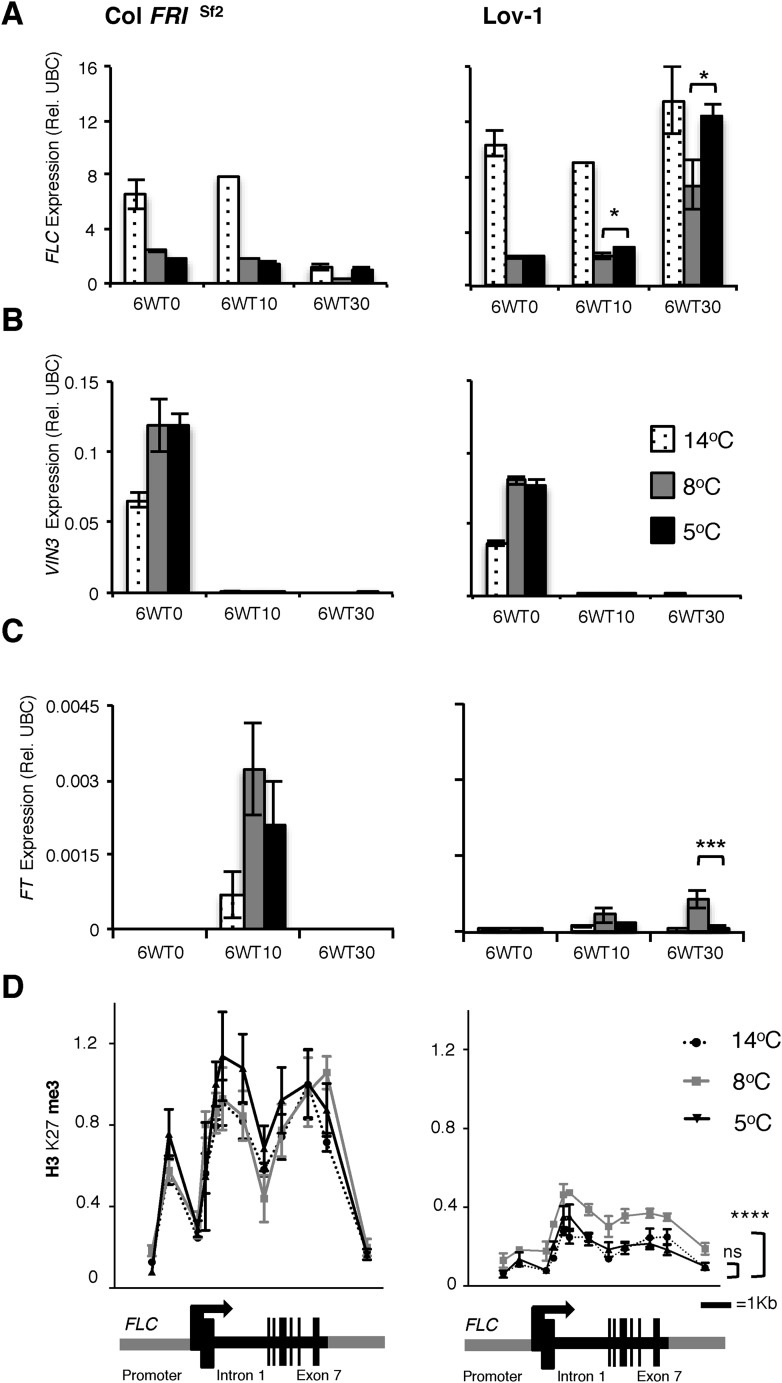
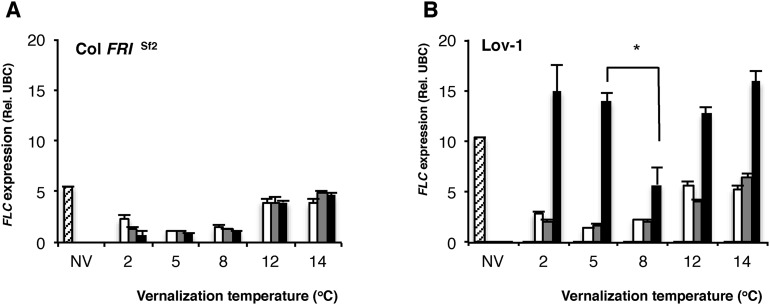
The requirement for longer cold for effective vernalization in the Lov-1 accession has previously been shown to involve quantitative variation in accumulation of epigenetic silencing of FLC (Shindo et al., 2006; Coustham et al., 2012). We compared this quantitative variation in the silencing of Col FRISf2 and Lov-1 FLC alleles after 4 weeks cold exposure at 2, 5, 8, 12 and 14°C (Figure 2—figure supplement 1A and B). In contrast to Col FRISf2, the Lov-1 allele re-activated after 30 days in the warm after vernalization at all the tested temperatures. However, the degree of re-activation was lowest after vernalization at 8°C, consistent with vernalization being most effective at this temperature. Similarly, 6 weeks vernalization at 8°C resulted in lower FLC re-activation post-cold and higher levels of FT induction than 5°C, with similar VIN3 expression (Figure 2A–C). Epigenetic silencing of FLC is associated with Polycomb silencing and accumulation of H3K27me3 over the gene body (Angel et al., 2011; Yang et al., 2014). In Lov-1 it takes longer to accumulate the H3K27me3, mainly due to lower starting levels (Coustham et al., 2012). We found similar accumulation of gene body H3K27me3 in the Col FRISf2 FLC allele at 5, 8 or 14°C, but differential H3K27me3 accumulation in the Lov-1 allele (Figure 2D, Figure 2—source data 1). Vernalization at 8°C resulted in higher levels of H3K27me3 compared to 5 or 14°C (Figure 2D), suggesting that the Polycomb silencing is most effective at 8°C for the Lov-1 FLC allele.

Figure 2. Quantitative PCR and ChIP analyses of plants vernalized at 5°C, 8°C and 14°C.

Changes in FLC (A), VIN3 (B) and (C) FT expression were determined directly after 6 weeks of cold exposure (T0) and again after 10 (T10) and 30 (T30) days subsequent growth at 20°C. Two-tailed Student's t-test results: *p < 0.05, ***p < 0.005. n = 3. Error bars = ±S.D. (D) H3K27me3 levels over the FLC locus were higher for Lov-1 after 6 weeks vernalization at 8°C than 14°C or 5°C (samples were harvested 30 days post cold). **** p < 0.0001, Wilcoxon matched-pairs signed rank test on measurements for 12 primer pairs. Error bars = ±S.E.M. NV = nonvernalized, DNF = did not flower and ns = not significant.

DOI: http://dx.doi.org/10.7554/eLife.06620.006

Figure 2—source data 1. Primers used for qPCR ChIP.
elife06620s001.pdf (114.7KB, pdf)
DOI: 10.7554/eLife.06620.007

Figure 2.

Figure 2—figure supplement 1. FLC expression determined after 4 weeks of vernalization at a range of temperatures.

Figure 2—figure supplement 1.

Quantitative PCR (qRT-PCR) analysis showing FLC expression levels before cold (hatched), after 4 weeks vernalization (white) and after 10 days (grey) and 30 days (black) subsequent growth at 20°C. *p = 0.0038 two-tailed Student's t-test. n = 3. NV = non-vernalized.

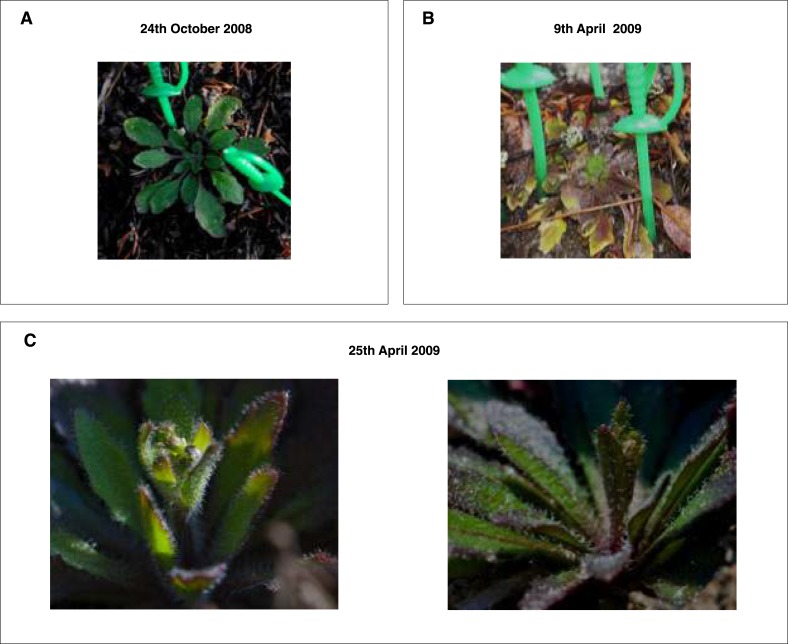
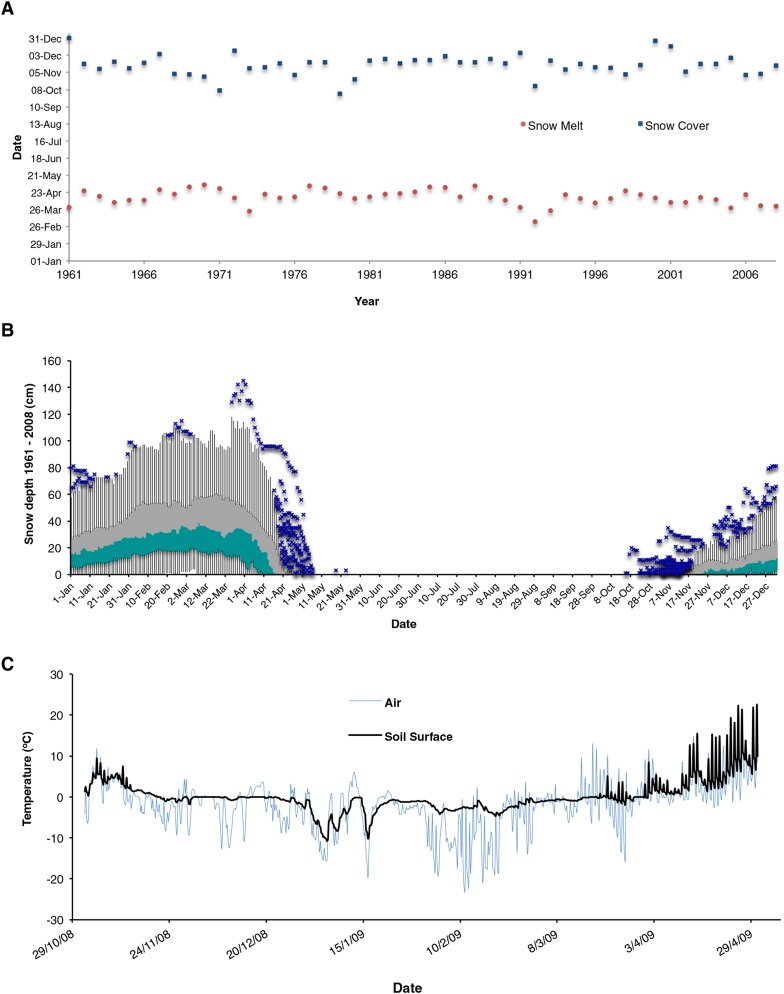
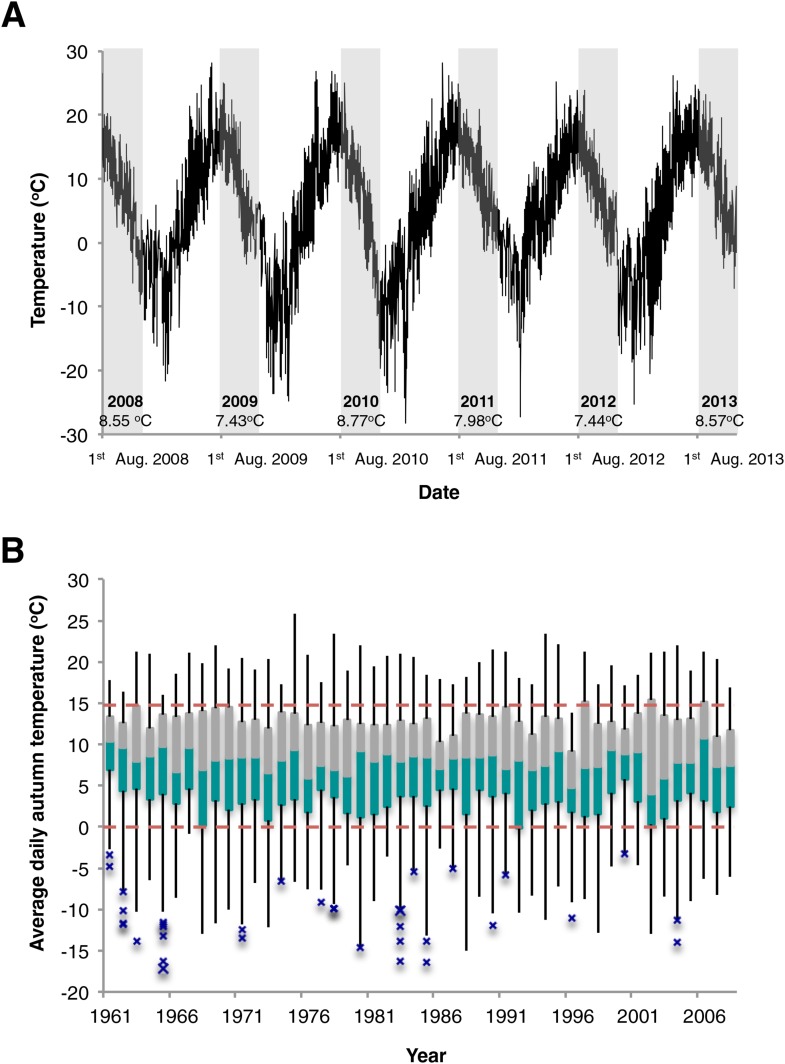
The relatively high temperature range for vernalization of the N. Swedish accession was surprising given that flower buds appeared within 2 weeks of the snowmelt on native Arabidopsis at the N. Swedish Lövvik site (Figure 3—figure supplement 1). This early flowering may limit herbivory and help in the competition for nutrients (Kawagoe and Kudoh, 2010; Akiyama and Agren, 2012). A long-term (>5 year study) of the natural populations at several N. Swedish sites throughout the High Coast region, showed most populations behaved as winter annuals with germination occurring predominantly in August and September with no spring germination (Figure 3—source data 1). The rapid flowering after snowmelt suggests that vernalization must have occurred before the end of November given the recurrent snow cover and low temperatures at the Lövvik site over the winter months (Figure 3—figure supplement 2, Figure 3—figure supplement 3A). Hourly climate data collected near Lövvik between 1st August (the earliest germination date observed for natural populations) until snow cover between 2008 and 2013 show an average air temperature of ~8°C (Figure 3—figure supplement 3A). Analysis of national data (1st August—30th November) also revealed an overall average autumn daily average temperature of 8.86°C between 1961 and 2008 (SD = 0.63) with over 86% of days falling within the range identified as being effective for Lov-1 vernalization, (0°C, 15°C) (Figure 3—figure supplement 3B). The agreement of average autumn temperatures with the effective vernalization temperatures identified for the Lov-1 reinforced the view that epigenetic silencing of FLC would occur before snowfall.

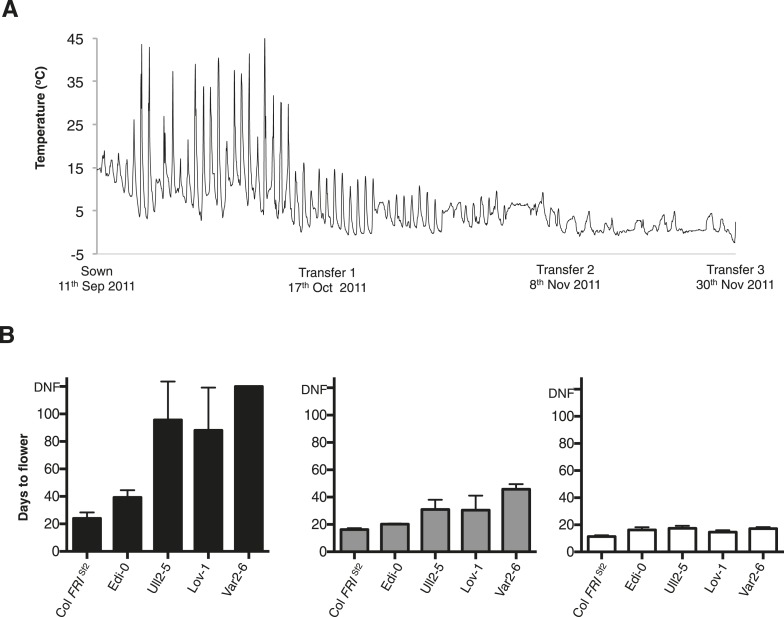
We tested the hypothesis of a seasonal shift in the timing of vernalization in N. Sweden by setting up field experiments close to the Lövvik site in autumn 2011 and 2012 (locations shown in Figure 3—figure supplement 4). Seedlings were transplanted into the field at the beginning of September and then transferred to a warmed greenhouse at three time points during autumn (Figure 3A, Figure 3—figure supplement 5A). This enabled us to explicitly test whether 12 weeks of growth preceding winter would be sufficient to fully vernalize Lov-1. Flowering time of the different cohorts showed that vernalization was complete by the end of November in both 2011 (Figure 3B) and 2012 (Figure 3—figure supplement 5B). Furthermore, plants left to overwinter in the field flowered rapidly at snowmelt, at the same time as the native A. thaliana population (Figure 3—figure supplement 6).

Figure 3. Field experiments reveal vernalization occurs in autumn in northern Sweden.

(A) Date of sowing and plant transfers to the greenhouse are shown with hourly soil surface temperatures recorded during autumn 2011. (B) Days to flower recorded after plants were transferred to a warmed greenhouse at three time points during autumn: Transfer 1 (black), Transfer 2 (grey) and Transfer 3 (white). n ≥ 10. Error bars = ±S.D.

DOI: http://dx.doi.org/10.7554/eLife.06620.009

Figure 3—source data 1. Developmental stage of natural Arabidopsis thaliana populations in spring in the High Coast area of N. Sweden (62.5°N).
elife06620s002.pdf (113.6KB, pdf)
DOI: 10.7554/eLife.06620.010

Figure 3.

Figure 3—figure supplement 1. The Lov-1 natural population flowers rapidly after snowmelt in spring.

Figure 3—figure supplement 1.

Photographs of representative Lov-1 rosettes taken (A) before snow cover and (B) immediately after snowmelt (green markers indicate rosette size). (C) Evidence of stem elongation was apparent 16 days post snowmelt.

Figure 3—figure supplement 2. Snow consistently covers and protects plants from subzero air temperatures during winter.

Figure 3—figure supplement 2.

(A) Snow cover and melt dates recorded over 47 years. (B) Box plots of average snow depth recorded through the year. (C) Air and soil temperatures recorded simultaneously during winter 2008/2009. Green and grey boxes = median to 1st and 3rd quartile, respectively. Upper and lower whiskers represent 1.5* interquartile range (IQR) or highest/lowest values. Blue crosses = outlier values greater than 1.5*IQR. Blue crosses = outlier values.

Figure 3—figure supplement 3. Temperature records from N. Sweden near Lövvik.

Figure 3—figure supplement 3.

(A) Hourly air temperature collected between 2008 and 2013. Grey shading highlights the temperatures used to calculate the mean values shown for five consecutive Lov-1 autumn growing seasons. (B) Box plots of mean average daily temperatures recorded during autumn (1st August—30th November) over 47 years. Dashed red lines indicate 0°C and 15°C—the upper and lower temperature thresholds identified for Lov-1 vernalization. Green and grey boxes = median to 1st and 3rd quartiles, respectively. Upper and lower whiskers represent 1.5* IQR or highest/lowest values. Blue crosses = outlier values greater than 1.5*IQR.

Figure 3—figure supplement 4. Field locations and climate data collection sites in Sweden.

Figure 3—figure supplement 4.

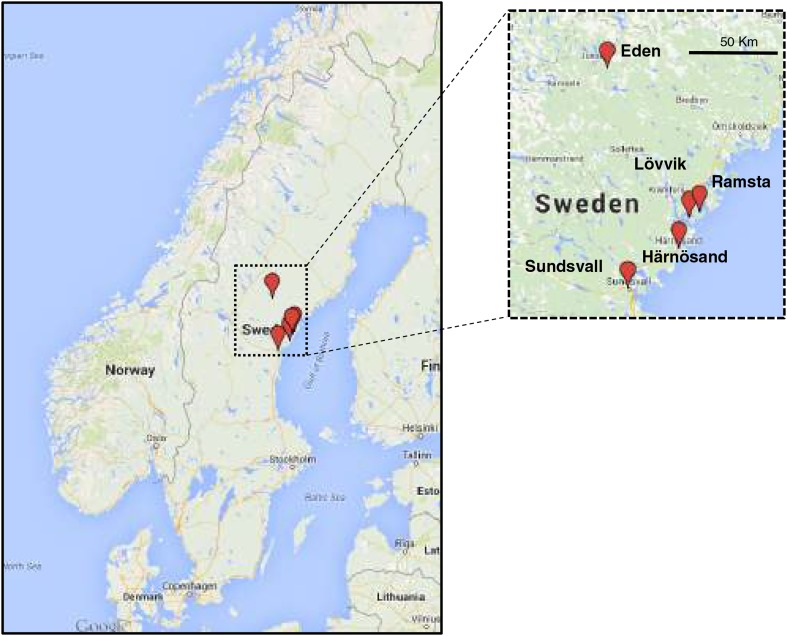
Hourly temperature data were collected in Eden. Swedish climate data were provided by Swedish Hydrological and Meteorological Institute weather stations located in Härnösand. Plants for the 2011 and 2012 field experiments were germinated in Sundsvall and transferred to Ramsta. (Map courtesy of Google, GeoBasics-DE/BKG 2009.)

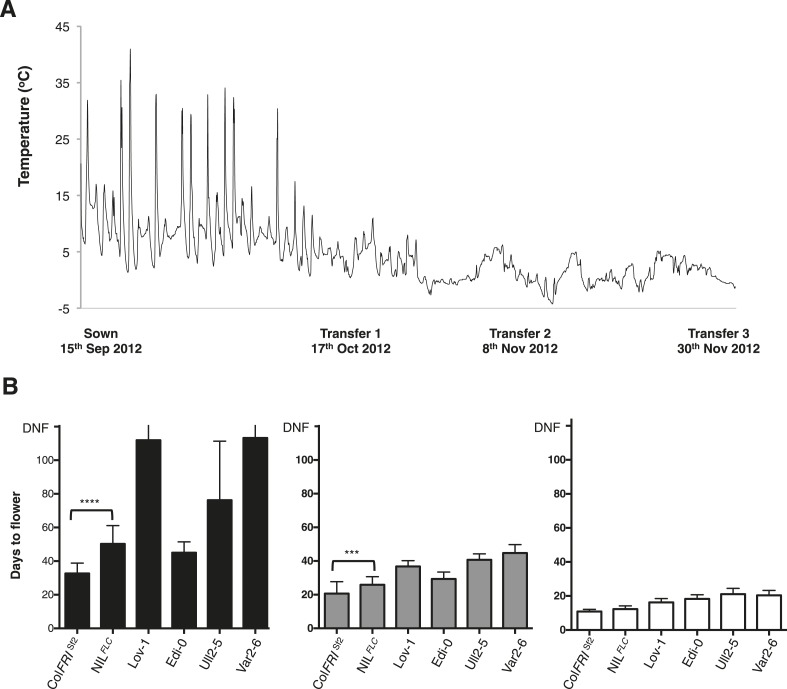
Figure 3—figure supplement 5. Sweden field experiments results 2012.

Figure 3—figure supplement 5.

(A) Date of sowing and plant transfers to the greenhouse are shown with hourly soil surface temperatures recorded during autumn 2012. (B) Days to flower recorded after plants were transferred to a warmed greenhouse at three time points during autumn: Transfer 1 (black), Transfer 2 (grey) and Transfer 3 (white). n ≥ 10. Error bars represent ±S.D. Mann–Whitney U test results: ****p < 0.0001 (U value: 10.50), ***p = 0.0009 (U value: 34). DNF = did not flower.

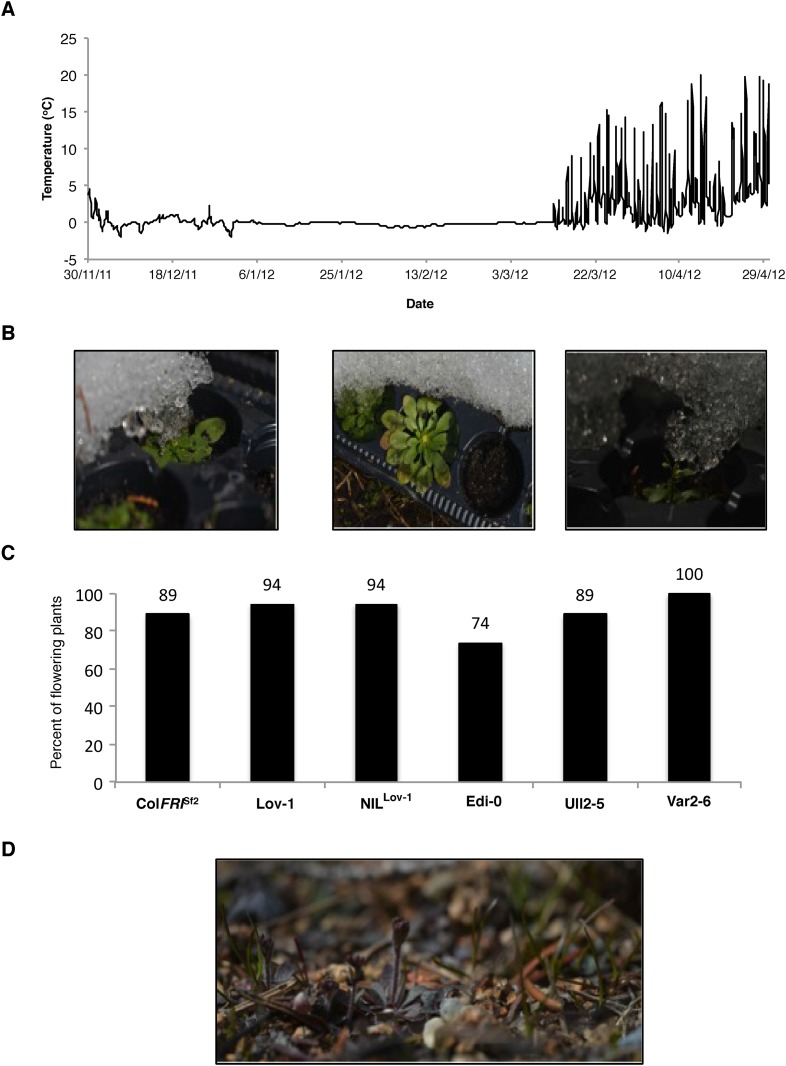
Figure 3—figure supplement 6. Plants flowered synchronously with natural populations after 5 months of continuous snow cover.

Figure 3—figure supplement 6.

(A) Surface temperature recorded at Ramsta indicating that overwintered plants were continuously covered by snow during winter 2012. (B) Representative images of the overwintered cohort with floral buds visible. (C) Percentage plants with visible buds on 26th April 2013, 5 days after snowmelt and (D) Image of natural population taken 26th April 2013.

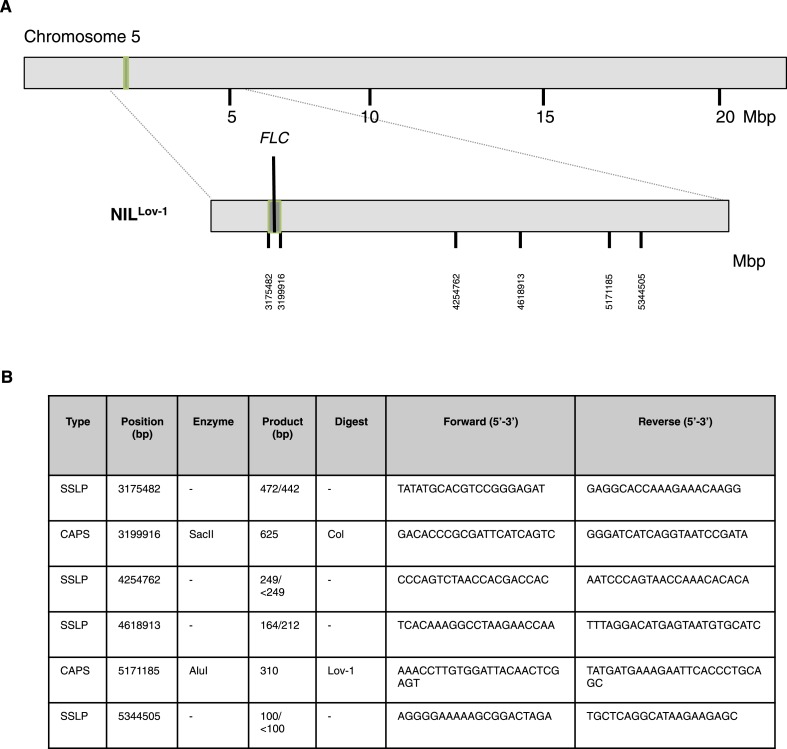
Figure 3—figure supplement 7. Genetic map showing Lov-1 introgressed region on chromosome 5.

Figure 3—figure supplement 7.

(A) Vertical lines indicate PCR-based markers used to distinguish between Col-0 (light grey) and Lov-1 (dark grey) regions. NILLov-1 introgression line contains the Lov-1 FLC locus (region outlined in green). (B) Markers used to map the introgressed regions on Chromosome 5. The positions correspond to AGI coordinates. Where the marker is a simple sequence length polymorphism (SSLP), the product size is shown for Col-0/Lov-1. Where the marker is a Cleaved Amplified Polymorphic sequence (CAPS), the enzyme required to digest the PCR product of the specified accession is given.

In order to link the flowering time changes with the changed epigenetic silencing at FLC we included a near isogenic line carrying the Lov-1 FLC allele (NILLov-1) in the genetic background of Col FRISf2 in the field experiments. This line was generated through six generations of introgression and had been genotyped with markers to define the introgressed region (Figure 3—figure supplement 7). NILLov-1 took longer to flower than Col FRISf2 after the first two transfers in 2012 (Figure 3—figure supplement 5B). This revealed the clear contribution of the Lov-1 FLC allele to differential vernalization response under field conditions, which likely involves the four non-coding polymorphisms in FLC close to the nucleation site of the PHD-PRC2 previously defined as underpinning the molecular variation in FLC epigenetic silencing between Lov-1 and Col FRISf2 (Coustham et al., 2012).

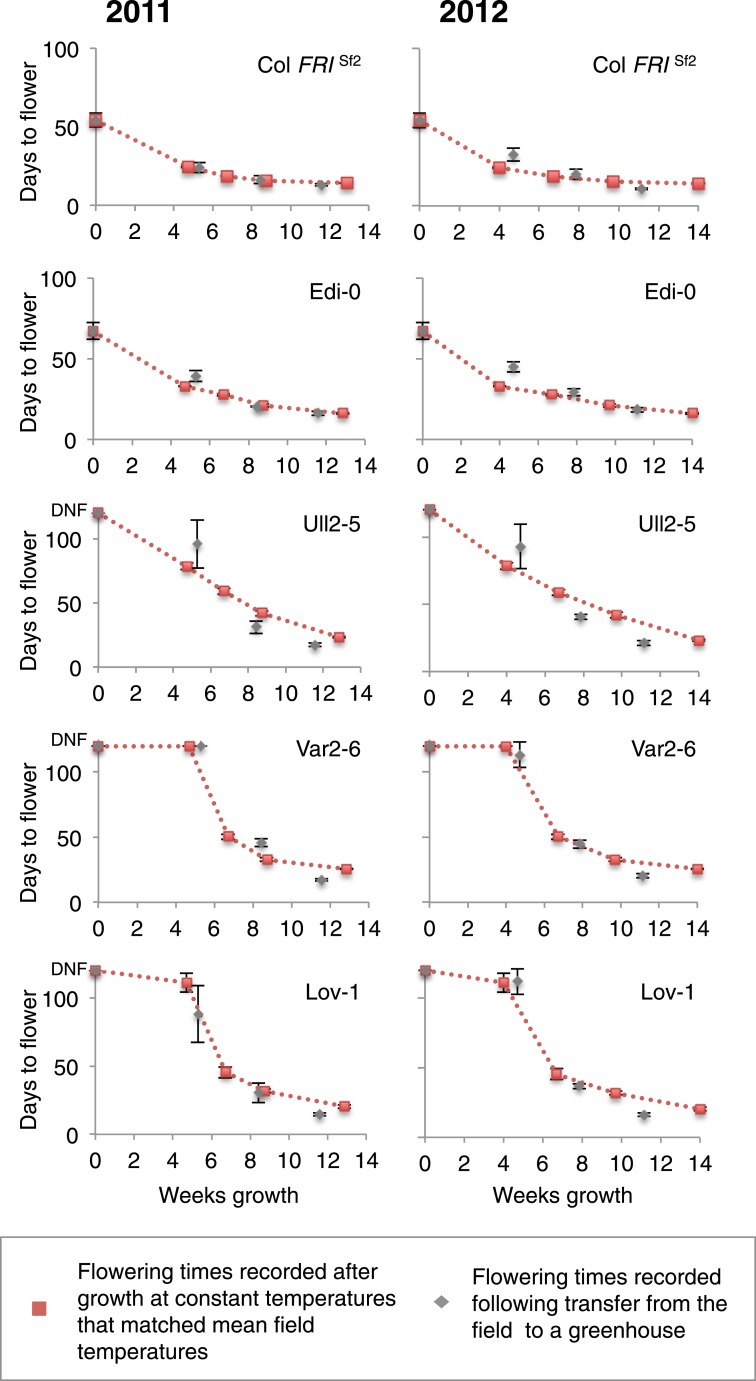
Expression analysis in the perennial species Arabidopsis halleri growing under natural field conditions has shown that plants average temperature over long-term scales (Aikawa et al., 2010). It was therefore interesting that the optimal vernalizing temperature for Lov-1 matched the average temperature over the 3-month season when vernalization occurred (Figure 3B). We therefore compared vernalization response in the different transplant intervals with vernalization in constant temperatures equivalent to the average temperature of the field conditions (Figure 4—source data 1). The different genotypes showed temporal differences in vernalization responsiveness over the three transplant periods in the field. Remarkably, vernalization responsiveness was very similar when the average field temperature was given as a constant temperature, with each genotype showing a different overall profile (Figure 4). Indeed, the match is remarkable given the daily oscillations in temperature especially in the transplant 1 period (Figure 3A, Figure 3—figure supplement 5A). How plants integrate these fluctuating temperatures over such long timescales is an important area for future molecular dissection.

Figure 4. Prediction of vernalization response under field conditions.

Days to flower recorded after the three transplants during field experiments in 2011 and 2012 are shown in grey. Red dashed lines indicate changes in flowering time estimated by flowering time results observed after vernalization at constant temperatures. Error bars represent ±S.D. n ≥ 10, DNF = did not flower.

DOI: http://dx.doi.org/10.7554/eLife.06620.018

Figure 4—source data 1. Cabinet flowering time data were selected where conditions most closely matched mean temperatures recorded during 2011 and 2012 field experiments.
elife06620s003.docx (12.9KB, docx)
DOI: 10.7554/eLife.06620.019

Figure 4.

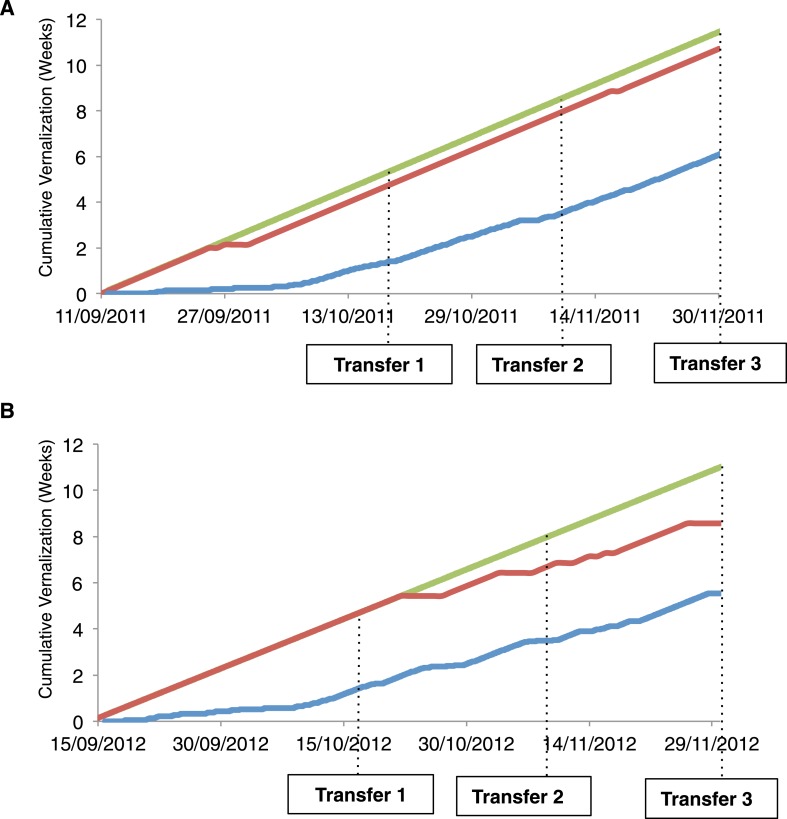
Figure 4—figure supplement 1. Accumulation of temperatures within different effective vernalization ranges.

Figure 4—figure supplement 1.

(A) Predicted accumulation of effective vernalization weeks during 2011 and (B) 2012 field experiments. Red and blue lines indicate accumulated hours(0°C, 6°C) and daily average temperatures 0°C, 15°C) respectively. The green line indicates maximal temperature accumulation under constant 8°C growing conditions.

All the genotypes analysed were found to vernalize effectively during autumn (Figure 3B, Figure 3—figure supplement 5B), however they have been shown to differ in their seed dormancy (Atwell et al., 2010); accessions from N. Sweden generally have much lower seed dormancy requirement than those from further south (Debieu et al., 2013). Thus, the low seed dormancy of Lov-1 would enable germination to occur early enough to exploit the whole of the N. Swedish autumn for vernalization. The increased seed dormancy of S. Swedish accessions (e.g., Ull2-5) is likely to delay germination leading to the necessity for vernalization in some years to extend into winter in S. Sweden. It is interesting to speculate that the reduced effectiveness of temperatures below 5°C for other Swedish accessions Lov-1 and Var2-6 (Figure 1B,E) could prevent premature vernalization occurring during unseasonal cool periods in early autumn. Our data also show that the (0°C, 6°C) temperature range widely used to estimate vernalization in A. thaliana (Wilczek et al., 2009) would only predict partial vernalization of later flowering accessions during our field experiments (Figure 4—figure supplement 1). Our data suggest that raising the upper threshold temperature to 15°C would improve estimates of vernalization progress for later flowering accessions under natural field conditions.

In summary, we have employed a combination of molecular and ecological approaches to connect temperature-induced molecular changes at FLC with ecologically significant effects in the field. We show that growth at the northern limit of the A. thaliana species range has involved a seasonal shift in the timing of vernalization. Perhaps as a response to selection in these extreme conditions one N. Swedish accession, Lov-1, shows a more distinct vernalization temperature optimum that matches the average historical temperature for August-November in that geographical region (Figure 1, Figure 2, Figure 3—figure supplement 3A). Early germination enables vernalization to complete before snowfall and allows flowering to occur directly after snowmelt when the photoperiod and ambient temperatures increase. Rises in global temperature have already reduced vernalization periods to an extent that has impacted the phenology of a range of plant species (Fitter and Fitter, 2002; Cook et al., 2012). Studies such as this are therefore important to understand how rapidly populations might adapt under future climate scenarios.

Materials and methods

Plant material and growth conditions

Genotypes used, standard growth and vernalization conditions have been described previously (Shindo et al., 2006). Briefly, plants were sown in a randomized design and stratified for 3 days at 4°C. Seedlings were grown for 7 days at 22°C and then vernalized in cabinets at 14°C, 12°C, 10°C, 8°C (all in Sanyo (Moriguchi, Japan) MLR-351H cabinets), 5°C (walk-in vernalization room), 2°C (modified Liebherr (Kirchdorf, Germany) KP3120) or 0°C (Johnson Controls, Milwaukee, WI). All temperatures were recorded as ± ≤1.5°C, 70% ± ≤10% RH. An 8hr photoperiod was provided by fluorescent tubes for temperatures ≥8°C and LEDs for temperatures ≤2°C. Plants were transferred to random locations in a controlled environment room (16 hr light, 22°C ± 2°C) and flowering time was scored as the number of days of growth until floral buds became visible.

Expression analysis

Total RNA was extracted as described previously (Box et al., 2011). cDNA was synthesized using Precision nano-script reverse transcription (Primerdesign) with oligo d(T) and analysed by qPCR on a LightCycler 480 II intrument (Roche, Basel, Switzerland), using LightCycler 480 Probes Master mix (Roche). FLC mRNA was assayed using Roche Universal Probe Library (UPL) #65 (5′-ctggagga-3′) with primers sFLC_UPL_F (5′-gtgggatcaaatgtcaaaaatg-3′) and sFLC_UPL_R (5′-ggagagggcagtctcaaggt-3′). VIN3 mRNA was assayed using UPL#67 (5′-tggtggat-3′) with primers VIN3_UPL_F (5′-cgcgtattgcggtaaagataa-3′) and VIN3_UPL_R (5′-tctctttcgccaccttcact-3′). FT mRNA was assayed using UPL#138 (5′-tggtggat-3′) with primers FT_UPL_#138_F (5′-ggtggagaagacctcaggaa-3′) and FT_UPL_#138_R (5′-ggttgctaggacttggaacatc-3′). Expression of each gene was normalized to UBC (At5g25760) with primers UBC_UPL_F (5′-tcctcttaactgcgactcagg-3), UBC_UPL_R (5′-gcgaggcgtgtatacatttg-3) and UPL#9 (5′-tggtgatg-3′). Statistical analyses of logged expression data were performed using GraphPad Prism version 6 software (La Jolla, CA).

ChIP and real-time quantitative PCR analysis

ChIP assays were performed as previously described (Sun et al., 2013) using H3K27me3 and H3 antibodies cited by Angel et al. (2011). Primers used in this analysis are shown in Figure 2—source data 1. SHOOT MERISTEMLESS (STM) was used as the internal control and data are represented as the ratio of (H3K27me3FLC/H3 FLC) to (H3K27me3 STM/H3 STM). Statistical analysis of ChIP data was performed using GraphPad Prism version 5 software for Mac.

Climate analysis

Hourly temperatures were recorded using Tinytag data-loggers (Chichester, UK). Historical climate data were obtained from Swedish Meteorological and Hydrological Institute. Three temperature and snow-depth readings taken at 0600 hr, 1200 hr and 1800 hr were used to calculate daily means. Boxplots graphs were created using QI Macros add-ins for Excel (Denver, CO). Statistical analyses of climate data were performed using GraphPad Prism version 6 software.

Field experiments

Seeds were stratified for 4 days at 5°C, sown into trays using a randomized block design and placed outside (62° 23.463´N, 17° 18.272´E). Seedlings were thinned to one plant per cell after 7 days and then transferred to Ramsta (62° 50.988´N, 18° 11.570´E) 1 week later. At each transfer date, plants were returned to a greenhouse in Mid-Sweden University, Sundsvall (16 hr light, 22°C ± 2°C) where flowering time was determined as the number of days growth until floral buds became visible.

Acknowledgements

The Dean lab is supported by the UK Biotechnology and Biological Sciences Research Council (BBSRC) Institute Strategic Programme grant BB/C517633/1 and a European Research Council Advanced Investigator grant 233039 ENVGENE. SD is supported by a studentship from the Earth and Life Systems Alliance, a joint venture between the John Innes Centre and the University of East Anglia. We thank Arthur Korte at Gregor Mendel Institute, Vienna for assaying the vernalization responses at 0°C, Öhmans farm for field site and all the members of the Dean lab for useful discussions.

Funding Statement

The funders had no role in study design, data collection and interpretation, or the decision to submit the work for publication.

Additional information

Competing interests

The authors declare that no competing interests exist.

Author contributions

SD, Conception and design, Acquisition of data, Analysis and interpretation of data, Drafting or revising the article.

SH, Designed the field experiments, Acquisition of data, Drafting or revising the article.

JQ, Acquisition of data, Drafting or revising the article.

JI, Analysis and interpretation of data, Drafting or revising the article.

AG, Conception and design, Drafting or revising the article.

CD, Conception and design, Analysis and interpretation of data, Drafting or revising the article.

References

  1. Aikawa S, Kobayashi MJ, Satake A, Shimizu KK, Kudoh H. Robust control of the seasonal expression of the Arabidopsis FLC gene in a fluctuating environment. Proceedings of the National Academy of Sciences of USA. 2010;107:11632–11637. doi: 10.1073/pnas.0914293107. [DOI] [PMC free article] [PubMed] [Google Scholar]
  2. Akiyama R, Agren J. Magnitude and timing of leaf damage affect seed production in a natural population of Arabidopsis thaliana (Brassicaceae) PLOS ONE. 2012;7:e30015. doi: 10.1371/journal.pone.0030015. [DOI] [PMC free article] [PubMed] [Google Scholar]
  3. Angel A, Song J, Dean C, Howard M. A Polycomb-based switch underlying quantitative epigenetic memory. Nature. 2011;476:105–108. doi: 10.1038/nature10241. [DOI] [PubMed] [Google Scholar]
  4. Angel A, Song J, Yang H, Questa JI, Dean C, Howard M. Vernalizing cold is registered digitally at FLC. Proceedings of the National Academy of Sciences of USA. 2015;112:4146–4151. doi: 10.1073/pnas.1503100112. [DOI] [PMC free article] [PubMed] [Google Scholar]
  5. Box MS, Coustham V, Dean C, Mylne JS. Protocol: a simple phenol-based method for 96-well extraction of high quality RNA from Arabidopsis. Plant Methods. 2011;7:7. doi: 10.1186/1746-4811-7-7. [DOI] [PMC free article] [PubMed] [Google Scholar]
  6. Byrne D, Bacon T. Chilling estimation: its importance and estimation. The Texas Horticulturist. 1992;18:8–9. [Google Scholar]
  7. Chew YH, Wilczek AM, Williams M, Welch SM, Schmitt J, Halliday KJ. An augmented Arabidopsis phenology model reveals seasonal temperature control of flowering time. New Phytologist. 2012;194:654–665. doi: 10.1111/j.1469-8137.2012.04069.x. [DOI] [PubMed] [Google Scholar]
  8. Chew YH, Wenden B, Flis A, Mengin V, Taylor J, Davey CL, Tindal C, Thomas H, Ougham HJ, de Reffye P, Stitt M, Williams M, Muetzelfeldt R, Halliday KJ, Millar AJ. Multiscale digital Arabidopsis predicts individual organ and whole-organism growth. Proceedings of the National Academy of Sciences of USA. 2014;111:E4127–E4136. doi: 10.1073/pnas.1410238111. [DOI] [PMC free article] [PubMed] [Google Scholar]
  9. Cook BI, Wolkovichc EM, Parmesan C. Divergent responses to spring and winter warming drive community level flowering trends. Proceedings of the National Academy of Sciences USA. 2012;109:9000–9005. doi: 10.1073/pnas.1118364109. [DOI] [PMC free article] [PubMed] [Google Scholar]
  10. Coustham V, Li P, Strange A, Lister C, Song J, Dean C. Quantitative modulation of Polycomb silencing underlies natural variation in vernalization. Science. 2012;337:584–587. doi: 10.1126/science.1221881. [DOI] [PubMed] [Google Scholar]
  11. Debieu M, Tang C, Stich B, Sikosek T, Effgen S, Josephs E, Schmitt J, Nordborg M, Koornneef M, de Meaux J. Co-Variation between Seed Dormancy, Growth Rate and Flowering Time Changes with Latitude in Arabidopsis thaliana. PLoS ONE. 2013;8:e61075. doi: 10.1371/journal.pone.0061075. [DOI] [PMC free article] [PubMed] [Google Scholar]
  12. De Luciaa, Crevillena P, Jonesb AME, Greba T, Deana C. A PHD-polycomb repressive complex 2 triggers the epigenetic silencing of FLC during vernalization. Proceedings of the National Academy of Sciences USA. 2008;105:16831–16836. doi: 10.1073/pnas.0808687105. [DOI] [PMC free article] [PubMed] [Google Scholar]
  13. Fitter AH, Fitter RSR. Rapid changes in flowering time in British plants. Science. 2002;296:1689–1691. doi: 10.1126/science.1071617. [DOI] [PubMed] [Google Scholar]
  14. Kawagoe T, Kudoh H. Escape from floral herbivory by early flowering in Arabidopsis halleri subsp gemmifera. Oecologia. 2010;164:713–720. doi: 10.1007/s00442-010-1709-y. [DOI] [PubMed] [Google Scholar]
  15. Li PJ, Filiault D, Box MS, Kerdaffrec E, Van Oosterhout C, Wilczek AM, Schmitt J, Mcmullan M, Bergelson J, Nordborg M, Dean C. Multiple FLC haplotypes defined by independent cis-regulatory variation underpin life history diversity in Arabidopsis thaliana. Genes & Development. 2014;28:1635–1640. doi: 10.1101/gad.245993.114. [DOI] [PMC free article] [PubMed] [Google Scholar]
  16. Michaels SD, Amasino RM. FLOWERING LOCUS C encodes a novel MADS domain protein that acts as a repressor of flowering. The Plant Cell. 1999;11:949–956. doi: 10.1105/tpc.11.5.949. [DOI] [PMC free article] [PubMed] [Google Scholar]
  17. Searle I, He Y, Turck F, Vincent C, Fornara F, Krober S, Amasino RA, Coupland G. The transcription factor FLC confers a flowering response to vernalization by repressing meristem competence and systemic signaling in Arabidopsis. Genes & Development. 2006;20:898–912. doi: 10.1101/gad.373506. [DOI] [PMC free article] [PubMed] [Google Scholar]
  18. Sheldon CC, Burn JE, Perez PP, Metzger J, Edwards JA, Peacock WJ, Dennis ES. The FLF MADS box gene: a repressor of flowering in Arabidopsis regulated by vernalization and methylation. The Plant Cell. 1999;11:445–458. doi: 10.1105/tpc.11.3.445. [DOI] [PMC free article] [PubMed] [Google Scholar]
  19. Shindo C, Lister C, Crevillen P, Nordborg M, Dean C. Variation in the epigenetic silencing of FLC contributes to natural variation in Arabidopsis vernalization response. Genes & Development. 2006;20:3079–3083. doi: 10.1101/gad.405306. [DOI] [PMC free article] [PubMed] [Google Scholar]
  20. Sun Q, Csorba T, Skourti-Stathaki K, Proudfoot NJ, Dean C. R-loop stabilization represses antisense transcription at the Arabidopsis FLC locus. Science. 2013;340:619–621. doi: 10.1126/science.1234848. [DOI] [PMC free article] [PubMed] [Google Scholar]
  21. Sung S, Amasino RM. Vernalization in Arabidopsis thaliana is mediated by the PHD finger protein VIN3. Nature. 2004;427:159–164. doi: 10.1038/nature02195. [DOI] [PubMed] [Google Scholar]
  22. Wilczek AM, Roe JL, Knapp MC, Cooper MD, Lopez-Gallego C, Martin LJ, Muir CD, Sim S, Walker A, Anderson J, Egan JF, Moyers BT, Petipas R, Giakountis A, Charbit E, Coupland G, Welch SM, Schmitt J. Effects of genetic perturbation on seasonal life history plasticity. Science. 2009;323:930–934. doi: 10.1126/science.1165826. [DOI] [PubMed] [Google Scholar]
  23. Wollenberg AC, Amasino RM. Natural variation in the temperature range permissive for vernalization in accessions of Arabidopsis thaliana. Plant, Cell & Environment. 2012;35:2181–2191. doi: 10.1111/j.1365-3040.2012.02548.x. [DOI] [PubMed] [Google Scholar]
  24. Yang H, Howard M, Dean C. Antagonistic roles for H3K36me3 and H3K27me3 in the cold-induced epigenetic switch at Arabidopsis FLC. Current Biology. 2014;24:1793–1797. doi: 10.1016/j.cub.2014.06.047. [DOI] [PMC free article] [PubMed] [Google Scholar]
eLife. 2015 Jul 23;4:e06620. doi: 10.7554/eLife.06620.021

Decision letter

Editor: Detlef Weigel1

eLife posts the editorial decision letter and author response on a selection of the published articles (subject to the approval of the authors). An edited version of the letter sent to the authors after peer review is shown, indicating the substantive concerns or comments; minor concerns are not usually shown. Reviewers have the opportunity to discuss the decision before the letter is sent (see review process). Similarly, the author response typically shows only responses to the major concerns raised by the reviewers.

Thank you for choosing to send your work entitled “Seasonal shift in timing of vernalization as an adaptation to extreme winter” for consideration at eLife. Your full submission has been evaluated by Detlef Weigel (Senior editor and peer reviewer) and one other peer reviewer, and the decision was reached after discussions between the two reviewers. Based on our discussions, we regret to inform you that your work will not be considered further for publication in eLife.

The manuscript was seen by two reviewers, one of whom had reviewed the previous version. The work addresses the question whether accessions of Arabidopsis thaliana complete vernalization at different times relative to the height of winter, as a consequence of adaptation to geographic differences in winter temperatures and winter duration. A model presented in many reviews is that vernalization equates exposure to winter-like temperature, and thus is completed only in spring. It is, however, unclear how rigorously this has been tested before. A previous paper by Wollenberg and Amasino reported that flowering of some Spanish accessions is accelerated by transient exposure to quite high vernalization temperatures, and Méndez-Vigo et al. have hypothesized that “mild and moderately cold winters activate the vernalization pathway to promote flowering in winter” (of Spanish accessions).

Both reviewers agreed that there are two major conclusions from the present manuscript one can be confident about: (i) Vernalization of Lov-1 is essentially completed in late fall, prior to cover by snow, such that the plants are already competent to flower as soon as snow melts later in the spring, and (ii) the optimal vernalization temperature for Lov-1 seems to be in the 5-8 degree range.

Based on logic alone, it seems likely that this vernalization behavior has to be common in places with regular and consistent snow cover. An interesting question is how vernalization behavior differs in other regions. Knowledge of this is essential in order to support the claim that there is a “seasonal shift in timing of vernalization as an adaptation to extreme winter”. Figure 3 seems to nicely demonstrate that a few other accessions are also vernalized when sown in fall and transferred to a greenhouse in November. To conclusively answer the question that you set out to answer, one would, however, need to conduct similar experiments at other locales, since it is not clear when Arabidopsis is vernalized at more Southern locations.

Both reviewers had also similar general concerns regarding the role of FLC in the observed behavior:

1) The behavior of near isogenic introgression lines indicated that the FLC locus contributes to this flowering behavior, but there are clearly additional factors, as the FLC region even in conjunction with another linked region on chr 5 has a much weaker effect on flowering than what was observed with Lov-1 itself. The conclusion “that the changed vernalization temperature response if Lov-1 involves a complex interaction between FLC and gene products at linked loci” is certainly not incorrect, but it does not provide the whole story.

2) Following on from this line of arguments, why did you use NIL-1, which contains the undesired downstream region, in your field experiments, rather than NIL-2, which apparently only contains FLC from Lov-1? This would seem to complicate the interpretation of the genetic evidence, especially because this downstream region appears to contribute a 13-20 day delay in flowering time. Depending on which NIL is used as the denominator, this is either a 30% or a 60% delay. Your comments on this region in your presentation of the results were not entirely convincing, and the choice of NIL-1 for the field experiment appears somewhat unfortunate.

[Editors’ note: a previous version of this study was rejected after peer review, but the authors submitted for reconsideration. The previous decision letter after peer review is shown below.]

Thank you for choosing to send your work entitled “Seasonal shift in timing of vernalization as an adaptation to extreme winter” for consideration at eLife. Your full submission has been evaluated by Detlef Weigel (Senior editor) and two other peer reviewers, and the decision was reached after discussions between the reviewers. We regret to inform you that your work will not be considered further for publication.

You have studied the potential ecological significance of a northern Swedish allele (Lov-1) of the FLC gene of Arabidopsis thaliana by integrating molecular genetics, field observations, meteorological data and field-greenhouse ecological experiments. A surprising observation is that vernalization is already completed during fall at a rather higher temperature of about 8°C, which enables very rapid flowering opening after snow melt. This is a potentially exciting new insight because vernalization has been typically considered to occur during winter to prevent early flowering. What is lacking, however, is a demonstration that these prior assumptions were justified, and that the Lov-1 allele has indeed a different vernalization temperature optimum in addition to its different vernalization length requirement. What impressed the reviewers most was the very clever idea to take plants grown at natural field sites into the greenhouse, in order to test their vernalization status. This nicely confirms that Lov-1 needs longer vernalization than the reference strain, although this is perhaps difficult to interpret because the reference strain flowers so much more quickly anyway.

From a series of elegant experiments in your lab, it was known that natural lines of Arabidopsis thaliana differ in their requirements for length of vernalization treatment, and that much of that variation maps to the FLC gene itself. In this paper, you have asked whether there are also different temperature optima for vernalization. In Figure 1A, you contrast a line with the FLC standard allele, Col FRI-Sf2, with the Lov-1 line. You find that in both lines 2, 5, or 8°C are more effective for vernalization than temperatures below or above. The critical question is whether there are differences between the two lines at 12 and 14°C. Because the effect of vernalization on flowering of the reference line is much smaller than for Lov-1, the reviewers were unconvinced of this claim. Not only was there no proper statistical treatment, but it is even unclear whether this can be resolved by statistics, because it would be rather arbitrary how one defines vernalization response, i.e., as absolute difference in flowering, relative acceleration of flowering etc. More importantly, the reviewers agreed that these experiments mostly confirmed that Lov-1 needs to be vernalized much longer than Col FRI-Sf2 rather than that the results demonstrated a different temperature optimum. That there is perhaps less of a difference between the different temperature regimens than claimed can also be deduced from Figure 1B. If one of the lines has a temperature optimum at 2-8°C, it would seem to be Col FRI-Sf2, not Lov-1, where 12°C seems to be more effective in reducing FLC expression than in Col FRI-Sf2. The H3K27me3 data in Figure 1C are more in support of differential temperature effects, but the differences between 5 and 8°C for Lov-1 are not reflected in obvious differences in flowering behavior, so the results are equivocal.

In the end, the reviewers remained unconvinced that there is evidence for “a changed temperature integration mechanism involving FLC epigenetic silencing (that) has led to a phenological shift in vernalization timing”. For such a conclusion, one would need to have seen similar experiments at other sites, with lines that supposedly have different temperature optima (and preferentially similar vernalization length requirement, because it seems that length and temperature effects are difficult to disentangle).

Major issues of the manuscript to be addressed include:

1) There are a few issues regarding the paragraph: “Hourly air temperature data collected near Lövvik from 1st August until snow cover in 2008, 2009 and 2013 revealed mean average autumn temperatures close to the 8°C; the optimal Lov-1 constant vernalization temperature (Figure 2B). National climate records showed the longer-term (1961 to 2008) average daily temperature in that seasonal period was 8.86°C (SD = 0.63) with 86% of average daily temperatures shown in Figure 2C within the range identified to be effective for vernalization of Lov-1 seedlings. Together these data raised the possibility that the change in thermal sensitivity of vernalization was an adaptation beneficial for reproductive success in northern Sweden.”

1-1) Why was the average started from 1st August? Depends on the day of start, the average until snow cover can be arbitrary changed. I guess authors could show ecological argument or data, such as the germination timing in the locality.

1-2) Why does mean average temperature matters? While the lab experiment was conducted in constant 8°C, the natural temperature would fluctuate in each day. Rather than daily average, it is possible that the coldest temperature may matter, or hours lower than a certain threshold temperature may matter (model by Aikawa et al. 2010), or whatever. I would propose either (1) defend the usage of daily average temperature (2) show experimental data supporting the significance daily temperature fluctuation, or (3) remove the argument (importantly abstract) of the coincidence between lab experiment and natural condition, although it would weaken the paper.

1-3) Describe the detailed data of the national climate records. Does it provide only average daily temperature? Even if hourly temperature is not available, maximum and minimum temperatures may be relevant.

2) The second last paragraph of Results and Discussion on modeling as well as Figure 4–table supplement 1: Too few details are described about temperature both in experiments and models. After all, in which condition were the plants grown? The “Plant material and growth conditions” section of the Methods does not seem to describe the conditions of the plants described in the table, which were grown in 12, 10, 8, 5°C. Moreover, nothing is written on the model in the Materials and methods. Although there is a short description in the figure legend, it is far from adequate.

3) In the field experiments (Figure 3), the NIL1Lov-1 and Lov-1 behaves similarly, but in the laboratory experiments (Figure 3–figure supplement 5), they seem very different in the days to flowering. Please explain this point.

4) Regarding the second last sentence of the second last paragraph “Rapid flowering in spring may be required to complete reproductive development in the relatively short northern latitude summer”, please discuss the reasoning more. It would depend on the germination timing. Suppose they flower in May, make seeds in June, germinates in August, is rapid flowering really advantageous? Other possibilities may be discussed. The temperature may become unfavorable quickly in spring, or herbivores may favor early flowering (e.g. a study of A. thaliana in Sweden, Akiyama and Agren, Conflicting selection on the timing of germination in a natural population of Arabidopsis thaliana. J Evol Biol. 2013; Akiyama and Agren, Magnitude and timing of leaf damage affect seed production in a natural population of Arabidopsis thaliana (Brassicaceae). PLoS One. 2012;7(1):e30015; a study using A. halleri, Kawagoe and Kudoh, Escape from floral herbivory by early flowering in Arabidopsis halleri subsp. gemmifera. Oecologia. 2010 Nov;164(3):713-20).

eLife. 2015 Jul 23;4:e06620. doi: 10.7554/eLife.06620.022

Author response


[…] Both reviewers had also similar general concerns regarding the role of FLC in the observed behavior:

1) The behavior of near isogenic introgression lines indicated that the FLC locus contributes to this flowering behavior, but there are clearly additional factors, as the FLC region even in conjunction with another linked region on chr 5 has a much weaker effect on flowering than what was observed with Lov-1 itself. The conclusion “that the changed vernalization temperature response if Lov-1 involves a complex interaction between FLC and gene products at linked loci” is certainly not incorrect, but it does not provide the whole story.

2) Following on from this line of arguments, why did you use NIL-1, which contains the undesired downstream region, in your field experiments, rather than NIL-2, which apparently only contains FLC from Lov-1? This would seem to complicate the interpretation of the genetic evidence, especially because this downstream region appears to contribute a 13-20 day delay in flowering time. Depending on which NIL is used as the denominator, this is either a 30% or a 60% delay. Your comments on this region in your presentation of the results were not entirely convincing, and the choice of NIL-1 for the field experiment appears somewhat unfortunate.

In light of the reviewer’s comments we have undertaken field studies to establish a lack spring germination in Northern Sweden, and included data from additional genotypes to show that despite different vernalization temperature profiles, all accessions vernalize during autumn in Northern Sweden.

This reinforces our central conclusion that there is a shift in the timing of vernalization as an adaptation to extreme winters. Our observation of vernalization between 0°C and 14°C challenges current dogma and opens up the opportunity for complete vernalization during autumn.

The specific changes are:

Figure 1: Var2-6 flowering time data has been added. Expression and ChIP analyses have now been moved to Figure 2 and four week FLC expression graphs are now included as Figure 2–figure supplement 1.

Figure 1–figure supplement 1: A new map has been included that shows collection sites of the natural accessions.

Figure 2: Climate data analyses have been moved to Figure 3–figure supplements 2 and 3 and has been replaced by molecular data in Figure 2. For completeness we now include expression data for the 6 week treated samples alongside the ChIP data. This shows significantly lower levels of FLC reactivation and higher FT induction following an 8°C treatment versus a 5°C treatment despite similar levels of VIN3 induction observed for both temperatures.

Figure 3: Var2-6 data has now been added to the 2011 field results.

Figure 3–table supplement 1 has been added. This describes field studies we have undertaken to analyse spring germination in Northern Sweden.

Field experiment results (2011: Figure 3B; 2012: Figure 3–figure supplement 5B) now include Var2-6 flowering data. This demonstrates that autumn vernalization also occurs for a representative accession from the Northern Swedish FLC haplotype group.

2012 field results (Figure 3–figure supplement 5B) now include data for the introgressed line that contains only the Lov-1 FLC region. References to the other NILs (referred to as NIL1Lov-1 and NIL3Lov-1 in our previous submission) have now been removed from the manuscript.

Figure 3–figure supplement 5 now includes Var2-6 flowering time data.

Figure 4 has been reconfigured to include Var2-6 field and constant temperature responses.

[Editors’ note: the author responses to the previous round of peer review follow.]

Thank you for the very constructive comments on our previous submission. We realized that in our attempt to simplify the story we chose not to include results that in hindsight would have helped convince the reviewers of our conclusions. We have therefore rewritten the manuscript including all these additional data.

You have studied the potential ecological significance of a northern Swedish allele (Lov-1) of the FLC gene of Arabidopsis thaliana by integrating molecular genetics, field observations, meteorological data and field-greenhouse ecological experiments. A surprising observation is that vernalization is already completed during fall at a rather higher temperature of about 8°C, which enables very rapid flowering opening after snow melt. This is a potentially exciting new insight because vernalization has been typically considered to occur during winter to prevent early flowering.

We are particularly pleased that the reviewers recognized the importance of this finding. The view that vernalization occurs during winter is engrained in the thinking of the plant community and determines experimental strategy, inputs to modeling phenology and interpretations of field experiments.

What is lacking, however, is a demonstration that these prior assumptions were justified, and that the Lov-1 allele has indeed a different vernalization temperature optimum in addition to its different vernalization length requirement.

In our previous submission we had chosen to present two extreme strategies. We realize now that our attempt to keep things simple had led to confusion. In our new submission we now include other accessions and so can clearly show that length of cold period can be separated from the vernalization temperature optimum. We also demonstrate that our prior assumption of winter vernalization can be justified by showing that current phenological model parameters underestimate vernalization progress in natural field conditions.

What impressed the reviewers most was the very clever idea to take plants grown at natural field sites into the greenhouse, in order to test their vernalization status. This nicely confirms that Lov-1 needs longer vernalization than the reference strain, although this is perhaps difficult to interpret because the reference strain flowers so much more quickly anyway.

The addition of data from other accessions, particularly Ull2-5, will hopefully convince the reviewers that rapid flowering and temperature optimum are separable.

From a series of elegant experiments in your lab, it was known that natural lines of Arabidopsis thaliana differ in their requirements for length of vernalization treatment, and that much of that variation maps to the FLC gene itself. In this paper, you have asked whether there are also different temperature optima for vernalization. In Figure 1A, you contrast a line with the FLC standard allele, Col FRI-Sf2, with the Lov-1 line. You find that in both lines 2, 5, or 8°C are more effective for vernalization than temperatures below or above. The critical question is whether there are differences between the two lines at 12 and 14°C. Because the effect of vernalization on flowering of the reference line is much smaller than for Lov-1, the reviewers were unconvinced of this claim.

Indeed we found both Swedish accessions vernalize slightly better at 12 than 14°C, with Edi-0 and Col FRISf2 vernalizing equally efficiency at both temperatures. However, we do not find a functional significance for this difference in the field experiments, so do not consider it a critical issue. What does appear to influence field behaviour is the differential response between 2 and 5/8oC. We have also included experiments on a short vernalization of Col FRISf2 that demonstrate that partial vernalization of this faster flowering line does not reveal a differential temperature effect between 2 and 8°C.

Not only was there no proper statistical treatment, but it is even unclear whether this can be resolved by statistics, because it would be rather arbitrary how one defines vernalization response, i.e., as absolute difference in flowering, relative acceleration of flowering etc. More importantly, the reviewers agreed that these experiments mostly confirmed that Lov-1 needs to be vernalized much longer than Col FRI-Sf2 rather than that the results demonstrated a different temperature optimum. That there is perhaps less of a difference between the different temperature regimens than claimed can also be deduced from Figure 1B.

We have now used 4 week treated rather than 6 week cold treated plants for the analysis in Figure 1B. These show a significant difference in the temperature-dependent re-activation of FLC transcription 30 days after transfer to warm. This difference in re-activation does translate into flowering time differences.

If one of the lines has a temperature optimum at 2-8°C, it would seem to be Col FRI-Sf2, not Lov-1, where 12°C seems to be more effective in reducing FLC expression than in Col FRI-Sf2.

We have plotted absolute expression values in Figure 1B rather than normalized to NV to demonstrate that 12°C is not more effective in Lov-1 than Col FRISf2.

The H3K27me3 data in Figure 1C are more in support of differential temperature effects, but the differences between 5 and 8°C for Lov-1 are not reflected in obvious differences in flowering behavior, so the results are equivocal.

We hope that the new Figure1B convinces the reviewer that the chromatin differences are reflected in changed expression. We have also added the ChIP data at 14°C and statistical test results that strengthen the view of an 8°C optimum.

In the end, the reviewers remained unconvinced that there is evidence for “a changed temperature integration mechanism involving FLC epigenetic silencing (that) has led to a phenological shift in vernalization timing”. For such a conclusion, one would need to have seen similar experiments at other sites, with lines that supposedly have different temperature optima (and preferentially similar vernalization length requirement, because it seems that length and temperature effects are difficult to disentangle).

We have extensively edited the whole manuscript to more accurately describe our major findings:

- Vernalization in A. thaliana accessions, including one from the northern limit of the range, is inefficient at 0°C but still effective at 14°C;

- Current vernalization threshold parameters in Arabidopsis flowering models only predict a partial response for Lov-1 before winter, but we present field results validating our prediction that vernalization completes during autumn in N. Sweden;

- Lov-1 shows that both the effective range and optimal vernalization response match historical N. Sweden average autumn temperatures. The vernalization optima involves cis polymorphism and altered chromatin silencing.

Major issues of the manuscript to be addressed include:

1) There are a few issues regarding the paragraph: “Hourly air temperature data collected near Lövvik from 1st August until snow cover in 2008, 2009 and 2013 revealed mean average autumn temperatures close to the 8°C; the optimal Lov-1 constant vernalization temperature (Figure 2B). National climate records showed the longer-term (1961 to 2008) average daily temperature in that seasonal period was 8.86°C (SD = 0.63) with 86% of average daily temperatures shown in Figure 2C within the range identified to be effective for vernalization of Lov-1 seedlings. Together these data raised the possibility that the change in thermal sensitivity of vernalization was an adaptation beneficial for reproductive success in northern Sweden.

1-1) Why was the average started from 1st August? Depends on the day of start, the average until snow cover can be arbitrary changed. I guess authors could show ecological argument or data, such as the germination timing in the locality.

The 1st of August was used as the starting date for temperature data as this coincided with the observed germination time.

1-2) Why does mean average temperature matters? While the lab experiment was conducted in constant 8°C, the natural temperature would fluctuate in each day. Rather than daily average, it is possible that the coldest temperature may matter, or hours lower than a certain threshold temperature may matter (model by Aikawa et al. 2010), or whatever. I would propose either (1) defend the usage of daily average temperature (2) show experimental data supporting the significance daily temperature fluctuation, or (3) remove the argument (importantly abstract) of the coincidence between lab experiment and natural condition, although it would weaken the paper.

We looked at average daily temperatures because this is a common method used in agriculture to determine the minimum quantity of cold required by a crop to ensure synchronous flowering and maximum yield. We also considered long-term average temperature because a long 6 week integration period was reported to contribute to the epigenetic repression of A. halleri under field conditions (Aikawa et al. 2010). As with many crops, the observed vernalization response of A. thaliana does not correlate well with daily maximum or minimum temperatures.

1-3) Describe the detailed data of the national climate records. Does it provide only average daily temperature? Even if hourly temperature is not available, maximum and minimum temperatures may be relevant.

Clearer descriptions of the climate data and the analysis have now been included in the Methods section. But briefly, average temperatures were calculated from national records of three daily readings taken at 0600hrs, 1200hrs and 1800hrs.

2) The second last paragraph of Results and Discussion on modeling as well as Figure 4–table supplement 1: Too few details are described about temperature both in experiments and models. After all, in which condition were the plants grown? The “Plant material and growth conditions” section of the Methods does not seem to describe the conditions of the plants described in the table, which were grown in 12, 10, 8, 5°C. Moreover, nothing is written on the model in the Materials and methods. Although there is a short description in the figure legend, it is far from adequate.

We have now included thorough descriptions of growth conditions and altered the layout of Figure 4–table supplement 1 to make the cabinet data selection process clearer.

3) In the field experiments (Figure 3), the NIL1Lov-1 and Lov-1 behaves similarly, but in the laboratory experiments (Figure 3–figure supplement 5), they seem very different in the days to flowering. Please explain this point.

Indeed the NIL1 Lov-1 plants were much later in the field than after the equivalent treatment in the chamber, presumably reflecting important environmental difference still to be fully determined. This observation has now been included in our new submission.

4) Regarding the second last sentence of the second last paragraph “Rapid flowering in spring may be required to complete reproductive development in the relatively short northern latitude summer”, please discuss the reasoning more. It would depend on the germination timing. Suppose they flower in May, make seeds in June, germinates in August, is rapid flowering really advantageous? Other possibilities may be discussed. The temperature may become unfavorable quickly in spring, or herbivores may favor early flowering (e.g. a study of A. thaliana in Sweden, Akiyama and Agren, Conflicting selection on the timing of germination in a natural population of Arabidopsis thaliana. J Evol Biol. 2013; Akiyama and Agren, Magnitude and timing of leaf damage affect seed production in a natural population of Arabidopsis thaliana (Brassicaceae). PLoS One. 2012;7(1):e30015; a study using A. halleri, Kawagoe and Kudoh, Escape from floral herbivory by early flowering in Arabidopsis halleri subsp. gemmifera. Oecologia. 2010 Nov;164(3):713-20).

We have now extended the Discussion to include both observed germination times and experimental evidence for a lack of dormancy in addition to the potential advantages of early flowering for this accession.

Associated Data

    This section collects any data citations, data availability statements, or supplementary materials included in this article.

    Supplementary Materials

    Figure 2—source data 1. Primers used for qPCR ChIP.

    DOI: http://dx.doi.org/10.7554/eLife.06620.007

    elife06620s001.pdf (114.7KB, pdf)
    DOI: 10.7554/eLife.06620.007
    Figure 3—source data 1. Developmental stage of natural Arabidopsis thaliana populations in spring in the High Coast area of N. Sweden (62.5°N).

    DOI: http://dx.doi.org/10.7554/eLife.06620.010

    elife06620s002.pdf (113.6KB, pdf)
    DOI: 10.7554/eLife.06620.010
    Figure 4—source data 1. Cabinet flowering time data were selected where conditions most closely matched mean temperatures recorded during 2011 and 2012 field experiments.

    DOI: http://dx.doi.org/10.7554/eLife.06620.019

    elife06620s003.docx (12.9KB, docx)
    DOI: 10.7554/eLife.06620.019

    Articles from eLife are provided here courtesy of eLife Sciences Publications, Ltd

    RESOURCES