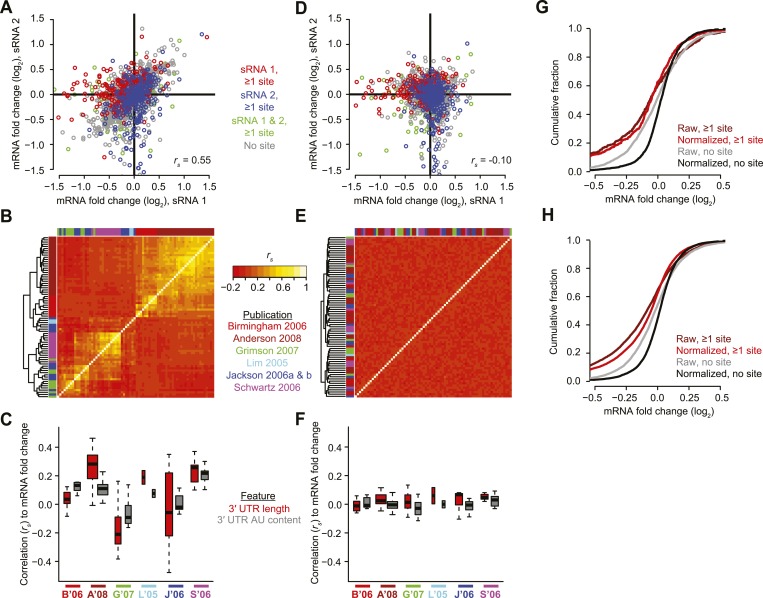
Figure 3. Pre-processing the microarray datasets to minimize nonspecific effects and technical biases.
(A) Example of the correlated response of mRNAs after transfecting two unrelated sRNAs (sRNA 1 and 2, respectively). Results for mRNAs containing at least one canonical 7–8 nt 3′-UTR site for either sRNA 1, sRNA 2, or both sRNAs are highlighted in red, blue, and green, respectively. Values for mRNAs without such sites are in grey. All mRNAs were used to calculate the Spearman correlation (rs). (B) Correlated responses observed in a compendium of 74 transfection experiments from six studies (colored as indicted in the publications list). For each pair of experiments, the rs value was calculated as in panel (A), colored as indicated in the key, and used for hierarchical clustering. (C) Study-dependent relationships between the responses of mRNAs to the transfected sRNA and either 3′-UTR length or 3′-UTR AU content, focusing on mRNAs without a canonical 7–8 nt 3′-UTR site to the sRNA. Boxplots indicate the median rs (bar), 25th and 75th percentiles (box), and the minimum of either 1.5 times the interquartile range or the most extreme data point (whiskers), with the width of the box proportional to the number of datasets used from each study. The studies are colored as in panel (B), abbreviating the first author and year. (D) Reduced correlation between the responses of mRNAs to unrelated sRNAs after applying the PLSR technique. This panel is as in (A) but plots the normalized mRNA fold changes. (E) Reduced correlations in results of the compendium experiments after applying the PLSR technique. This panel is as in (B) but plots the correlations after normalizing the mRNA fold changes. (F) Reduced study-dependent relationships between mRNA responses and either 3′-UTR length or 3′-UTR AU content. This panel is as in (C) but plots the correlations after normalizing the mRNA fold changes. (G and H) Cumulative distributions of fold changes for mRNAs containing at least one canonical 7–8 nt 3′-UTR site or no site either before normalization (raw) or after normalization (normalized). Panel (G) plots the results from experiments shown in (A) and (D), and (H) plots results from all 74 datasets.


