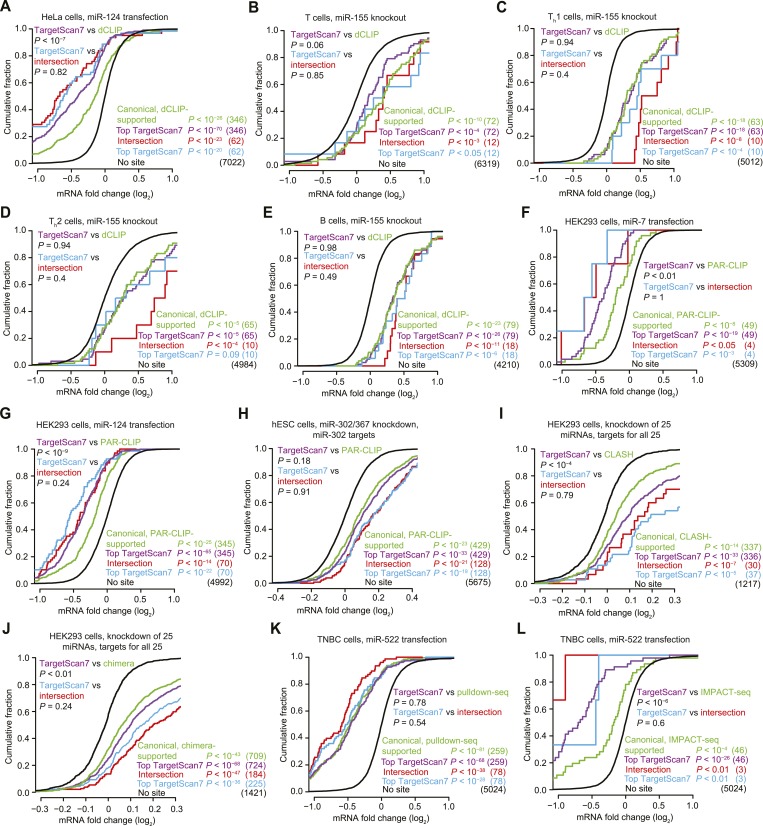
Figure 6. Response of predictions and mRNAs with experimentally supported canonical binding sites.
(A–E) Comparison of the top TargetScan7 predicted targets to mRNAs with canonical sites identified from dCLIP in either HeLa cells with and without transfected miR-124 (Chi et al., 2009) or lymphocytes with and without miR-155 (Loeb et al., 2012). Plotted are cumulative distributions of mRNA fold changes after transfection of miR-124 in HeLa cells (A), or after genetic ablation of miR-155 in either T cells (B), Th1 cells (C), Th2 cells (D), and B cells (E) (one-sided K–S test, P values). For genes with alternative last exons, the analysis considered the score of the most abundant alternative last exon, as assessed by 3P-seq tags (as is the default for TargetScan7 when ranking predictions). Each dCLIP-identified mRNA was required to have a 3′-UTR CLIP cluster with at least one canonical site to the cognate miRNA (including 6mers but not offset 6mers). Each intersection mRNA (red) was found in both the dCLIP set and top TargetScan7 set. Similarity between performance of the TargetScan7 and dCLIP sets (purple and green, respectively) and TargetScan7 and intersection sets (blue and red, respectively) was tested (two-sided K–S test, P values); the number of mRNAs analyzed in each category is in parentheses. TargetScan7 scores for mouse mRNAs were generated using human parameters for all features. (F–H) Comparison of top TargetScan7 predicted targets to mRNAs with canonical binding sites identified using photoactivatable-ribonucleoside-enhanced CLIP (PAR-CLIP) (Hafner et al., 2010; Lipchina et al., 2011). Plotted are cumulative distributions of mRNA fold changes after either transfecting miR-7 (F) or miR-124 (G) into HEK293 cells, or knocking down miR-302/367 in hESCs (H). Otherwise these panels are as in (A–E). (I) Comparison of top TargetScan7 predicted targets to mRNAs with canonical sites identified using CLASH (Helwak et al., 2013). Plotted are cumulative distributions of mRNA fold changes after knockdown of 25 miRNAs from 14 miRNA families in HEK293 cells. For each of these miRNA families, a cohort of top TargetScan7 predictions was chosen to match the number of mRNAs with CLASH-identified canonical sites, and the union of these TargetScan7 cohorts was analyzed. The total number of TargetScan7 predictions did not match the number of CLASH-identified targets due to slightly different overlap between mRNAs targeted by different miRNAs. Otherwise these panels are as in (A–E). (J) Comparison of top TargetScan7 predicted targets to mRNAs with chimera-identified canonical sites (Grosswendt et al., 2014). Otherwise this panel is as in (I). (K) Comparison of top TargetScan7 predicted targets to mRNAs with canonical binding sites within 3′ UTRs of mRNAs identified using pulldown-seq (Tan et al., 2014). Plotted are cumulative distributions of mRNA fold changes after transfecting miR-522 into triple-negative breast cancer (TNBC) cells. Otherwise this panel is as in (A–E). (L) Comparison of top TargetScan7 predicted targets to mRNAs with canonical sites identified using IMPACT-seq (Tan et al., 2014). Otherwise this panel is as in (K).

