Abstract
Direction-selective ganglion cells (DSGCs) respond selectively to motion toward a “preferred” direction, but much less to motion toward the opposite “null” direction. Directional signals in the DSGC depend on GABAergic inhibition and are observed over a wide range of speeds, which precludes motion detection based on a fixed temporal correlation. A voltage-clamp analysis, using narrow bar stimuli similar in width to the receptive field center, demonstrated that inhibition to DSGCs saturates rapidly above a threshold contrast. However, for wide bar stimuli that activate both the center and surround, inhibition depends more linearly on contrast. Excitation for both wide and narrow bars was also more linear. We propose that positive feedback, likely within the starburst amacrine cell or its network, produces steep saturation of inhibition at relatively low contrast. This mechanism renders GABA release essentially contrast and speed invariant, which enhances directional signals for small objects and thereby increases the signal-to-noise ratio for direction-selective signals in the spike train over a wide range of stimulus conditions. The steep saturation of inhibition confers to a neuron immunity to noise in its spike train, because when inhibition is strong no spikes are initiated.
Keywords: neural computation, retinal circuitry, ideal observer, noise immunity, Schmitt trigger
since direction selectivity was described by Barlow and Hill more than 50 years ago (Barlow and Hill 1963), numerous studies have revealed much about the underlying circuitry (Euler et al. 2002; Fried et al. 2002; Gavrikov et al. 2006; Lee et al. 2010; Lee and Zhou 2006; Taylor and Vaney 2002; Trenholm et al. 2011, 2013, 2014), and yet the precise mechanism remains unclear. GABAergic inhibition is known to be essential for generating directional signals (Wyatt and Daw 1976) that are necessary for driving optokinetic reflexes (Amthor et al. 2002; Spoida et al. 2012).
The starburst amacrine cells (SBACs), which tightly cofasciculate with dendrites of the direction-selective ganglion cell (DSGC) (Dong et al. 2004; Famiglietti 1991; Vaney et al. 1989), are currently thought to provide a directional inhibitory signal that activates GABAA receptors on DSGC dendrites (Taylor and Vaney 2002; Zhou and Lee 2008). The directional signal in the SBAC dendrites driving this GABA release is thought to comprise an asymmetry in the responses to centrifugal versus centripetal motion (Enciso et al. 2010; Euler et al. 2002; Gavrikov et al. 2003, 2006; Hausselt et al. 2007; Lee and Zhou 2006; Oesch and Taylor 2010). These directional, centrifugal signals, in the highly symmetric SBACs, are preserved as each SBAC dendritic branch makes selective connections with appropriate DSGCs (Briggman et al. 2011; Wei et al. 2011). However, the directional voltage signals measured from the somas of SBACs strongly attenuate at stimulus frequencies above a few cycles per second (Hausselt et al. 2007), which seems incompatible with the broad speed tuning observed in DSGCs that spans speeds over two orders of magnitude (Grzywacz and Amthor 2007; Wyatt and Daw 1975). Indeed, theoretical models of direction-selective GABA release that depend on fixed temporal correlations display narrow speed tuning (Münch and Werblin 2006; Tukker et al. 2004). Similarly, directional tuning of DSGCs is largely insensitive to contrast (Grzywacz and Amthor 2007), which is another stimulus parameter that varies widely under natural conditions.
The observation that directional signals are independent of speed and contrast suggests the presence of strong nonlinearities within the synaptic circuitry (Hausselt et al. 2007; Reichardt 1969; Tukker et al. 2004). A computational model by Amthor and Grzywacz (1991), based on extracellular responses of the DSGCs, implies that a nonlinearity of the inhibition underlies direction selectivity. Our goal was to test this notion by direct measurements of the contrast dependence of the inhibitory and excitatory inputs.
We recorded responses of DSGCs to moving bars at various velocities, light contrasts, and sizes. We measured the inhibitory input to DSGCs, which is thought to reflect GABA release from SBACs, and the excitatory input, which reflects glutamate release from bipolar cells and acetylcholine release from SBACs.
MATERIALS AND METHODS
Animals.
Dark-adapted pigmented rabbits and albino guinea pigs of either sex, 3–10 wk of age, were used in this study. Procedures involving animals were performed in accordance with National Institutes of Health guidelines and with approval from Institutional Animal Care and Use Committees at the Oregon Health and Science University and the University of Pennsylvania. Rabbits were anesthetized by intramuscular injection of 25 mg/kg ketamine and 4 mg/kg xylazine (originally obtained from The Butler Company, now available from Butler Schein), followed by intravenous injection of 40 mg/kg pentobarbital (Sigma). An eye was removed and dissected, and the retina was detached from the retinal pigment epithelium in bicarbonate-buffered Ames medium (United States Biological) and placed on a glass coverslip in the recording chamber, ganglion cell side up. Guinea pigs were anesthetized by intraperitoneal injection of 150 mg/kg ketamine (JHP Pharmaceuticals) and 15 mg/kg xylazine (VEDCO), followed by intraperitoneal injection of 120 mg/kg pentobarbital (Ovation Pharmaceuticals). An eye was removed and dissected, and the dorsal half of the eyecup was placed in the recording chamber, ganglion cell side up. The recording chamber was continuously perfused (2 ml/min) with Ames medium saturated with 95% O2 and 5% CO2 (Airgas) at 36°C.
Patch recording.
An internal solution based on either cesium or potassium was used for the patch-clamp experiments. A cesium-based solution was used with Ag/AgCl microelectrodes and contained (in mM) 135 CsMeSO3, 5 Na-HEPES, 2 MgCl2, 1 EGTA, 2 Na2-ATP, 1 Na-GTP, and 4 QX314-Cl (Sigma-Aldrich), osmolarity 288 mosM, pH 7.25 at 36°C. A potassium-based solution was used with Ag/AgBr microelectrodes and contained (in mM) 110 potassium gluconate, 10 phosphocreatine di-Tris, 10 ascorbic acid, 1 EGTA, 2 MgCl2, 0.4 Lucifer yellow potassium salt, 2 Na2-ATP, 0.5 Na2-GTP, 2 NaBr, and 2 QX314-Cl, osmolarity 288 mosM, pH 7.22 at 36°C. The resistance of the patch-clamp electrodes (World Precision Instruments) was 2.7–4 MΩ. For extracellular recordings, a patch electrode was filled either with Ames medium (for use with Ag/AgCl electrodes) or with a solution (in mM) of 125 NaCl, 2 MgCl2, 1.15 CaCl2, 3.6 KCl, 2 NaBr, and 10 HEPES, osmolarity 285 mosM, pH 7.4 at 36°C (for use with Ag/AgBr electrodes). To block nicotinic receptors, we used 100 μM hexamethonium chloride (Sigma) and 30 nM methyllycaconitine citrate (Sigma). Data from 24 rabbit DSGCs and 18 guinea pig DSGCs were used in this study.
Light stimuli.
On-Off DSGCs were stimulated with moving light or dark rectangular bars on a gray background. A CRT display (60 Hz) produced a background illuminance (Lbackground) at the photoreceptors of 2,000–10,000 photons·μm−2·s−1 for guinea pig retina and 120-1,200 photons·μm−2·s−1 for rabbit retina. The guinea pig retina was not detached from the pigment epithelium; therefore we used light intensity in the photopic range. The rabbit retina was isolated from the pigment epithelium; therefore we used low intensity to avoid photobleaching. The procedures for light stimulation have been described previously (Buldyrev et al. 2012; Venkataramani and Taylor 2010).
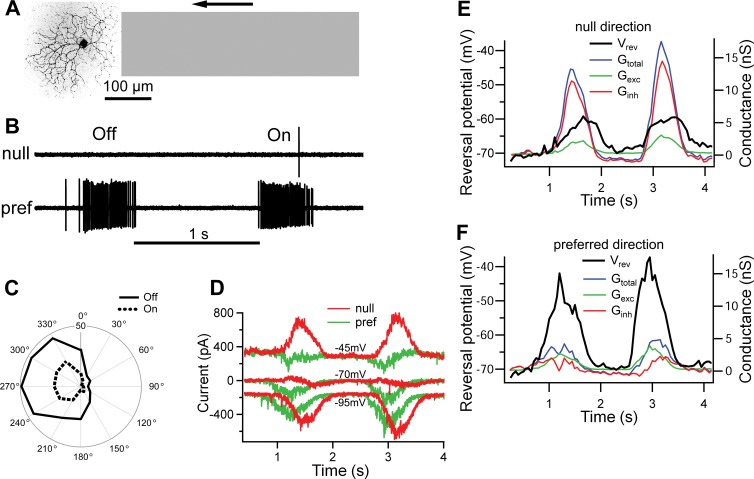
The light contrast, defined as |Lbar − Lbackground|/Lbackground, was set to a range of values between 3% and 100%. The length and width of a stimulus bar refer to its dimensions parallel and perpendicular to the motion axis, respectively. The size of the DSGC's receptive field center is approximately equal to the size of its dendritic arbor (Chiao and Masland 2003), which is typically ∼200 μm (Fig. 1A). Therefore, to separate responses to the leading and trailing edges, the length of the bar was set to 500-3,000 μm, depending on velocity (Fig. 1A). As long as the length of the bar was sufficient to evoke separate On and Off responses, it did not affect their magnitude or shape. Off responses were generated by either the leading edge of a dark bar or the trailing edge of a light bar, and conversely for On responses. Most experiments (∼80%) were performed with dark bars; however, the contrast polarity of the stimulus bar did not produce systematic differences in the Off and On responses.
Fig. 1.
Direction-selective ganglion cell (DSGC) response to a narrow moving bar. A: guinea pig On-Off DSGC visualized by confocal microscope. Off and On dendritic strata were resolved but are shown superimposed. Gray bar illustrates dimensions of the “narrow” stimulus relative to the DSGC dendritic arbor. B: representative extracellular Off and On responses for a narrow bar, 50% contrast, moving at 400 μm/s in null (top) and preferred (bottom) directions. C: representative tuning curves for a DSGC in response to a narrow bar of 50% contrast. The outer circumference corresponds to 50 spikes/stimulus presentation. D: typical currents in the guinea pig DSGC in response to a dark narrow bar moving in null and preferred directions at holding potentials of −45 mV (top), −70 mV (middle), and −95 mV (bottom). E and F: time course of the reversal potential (Vrev) and light-evoked conductances [total (Gtotal), excitatory (Gexc), and inhibitory (Ginh)] calculated from the currents shown in D.
In the following, the width of a “narrow” bar was approximately equal to the width of the receptive field (100–150 μm for guinea pig DSGCs and 150–200 μm for rabbit), whereas a “wide” bar was >850 μm, which is large enough to produce activation of the surround. For whole cell recordings, we used a range of velocities from 100 μm/s to 2,000 μm/s, which covers much of the known dynamic range for direction-selective responses (Grzywacz and Amthor 2007; He and Levick 2000; Wyatt and Daw 1975). For ideal observer analysis of directional discrimination we used a wider range of velocities that varied from 25 μm/s to 6,400 μm/s. At the beginning of the experiment, the preferred direction was calculated from the vector sum of the responses to 50% contrast stimuli in 12 directions, separated by 30° (Fig. 1, B and C).
Data analysis.
Light-evoked excitatory and inhibitory inputs to the DSGCs were either estimated directly as the currents at the appropriate reversal potential or calculated as conductances from responses recorded over a range of holding potentials (Fig. 1, D–F), as described previously (Taylor and Vaney 2002). The magnitudes of the inhibitory and excitatory inputs as a function of contrast were estimated by integrating the On and Off components over time. These integrals reflect the total light-evoked charge transfer into the ganglion cell at a fixed membrane voltage. At positive potentials the leak current generally displayed a slow sag. To obtain a more accurate estimate of the net light-evoked current responses, we compensated for this baseline drift by subtracting a single exponential with time constant ∼1 s.
Normalized intensity-response relations were fit with the Hill equation:
| (1) |
where h is the Hill coefficient, x is a stimulus parameter (contrast), and xhalf is the stimulus parameter at half-maximal response. Nonlinear least-squares fitting was performed in IGOR Pro (WaveMetrics). Voltage-clamp measurements of synaptic inputs within extensive dendritic arbors inevitably produce underestimates of the true conductance in the dendrites. Previously we have estimated that such errors in On-Off DSGCs can be as much as 50% (Schachter et al. 2010). Since voltage-clamp errors become larger as the magnitude of the total membrane conductance increases, the Hill coefficients calculated from contrast-response relations might represent underestimates. In some cases, when h ≈ 1, the contrast-response relations were almost linear and xhalf was predicted to lie outside the range of contrasts presented. For the purposes of comparison, we normalized the contrast-response relations to the predicted magnitude at 100% contrast and defined a half-maximal contrast, C50, as the contrast at which the response reached 50% of its predicted magnitude at 100% contrast, if not stated otherwise. Data for the Hill coefficient and C50 are shown as means ± SD. All other data are shown as means ± SE. A direction-selective index (DSI) was defined as
| (2) |
where P and N are the numbers of spikes in preferred and null directions, respectively. We used ideal observer analysis to predict the velocity range that is discriminable for the direction-selective response (Smith and Dhingra 2009). We set a discrimination threshold of 68% for a single-interval task, which gives a separation between the histograms of 1 SD. This is equivalent to the 75% threshold for a two-interval task widely used in psychophysics (two-alternative forced-choice method).
RESULTS
Response to low-contrast stimulus is not direction selective.
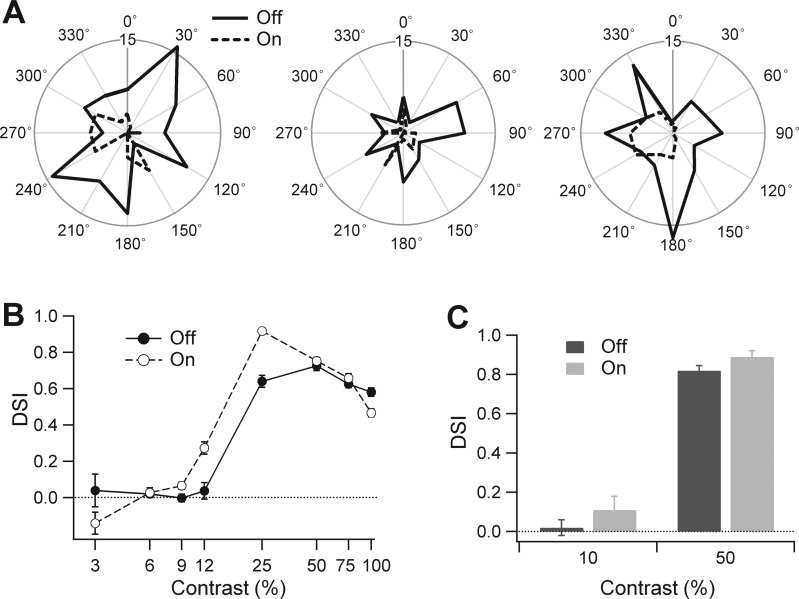
To determine which mechanisms contribute to robust directional selectivity, we studied responses evoked by a variety of stimuli. First, we recorded extracellular spikes from guinea pig DSGCs elicited by low- to high-contrast narrow bars (Fig. 2). At contrast ≤6%, the DSI values were not significantly different from 0 for all cells (e.g., at 6% contrast On-DSI = 0.01 ± 0.07, Off-DSI = 0.02 ± 0.05; n = 9). At 10% contrast, On and Off responses were not directional [On-DSI = 0.11 ± 0.07 (P = 0.1); Off-DSI = 0.02 ± 0.04 (P = 0.62); n = 17, 1-sample t-test]. The direction selectivity was robust for contrasts of 25% or greater (Fig. 2, B and C).
Fig. 2.
At low contrast, the measured direction-selective index (DSI) is small and highly variable. A: directional tuning curves at 10% contrast were obtained in a guinea pig DSGC from 3 sets of responses. The results illustrate the high variability and absence of reliable directional information. In the same cell at 50% contrast the direction selectivity and preferred direction were highly reproducible (not illustrated, same cell as shown in Fig. 1C). Note that the On responses occasionally displayed clear directional tuning that was consistent with responses at higher contrasts (right). Outer circle represents 15 spikes. B: DSI measured for a narrow moving bar in a representative guinea pig DSGC at contrasts 3–100%. Responses were directional at contrasts ≥12% for On responses and ≥25% for Off responses. C: DSI for 17 cells measured at 10% and 50% contrast. For A–C, the stimulus comprised a narrow (100 μm) dark bar moving at 400 μm/s.
Direction detection performance of DSGC is greater for narrow bars.
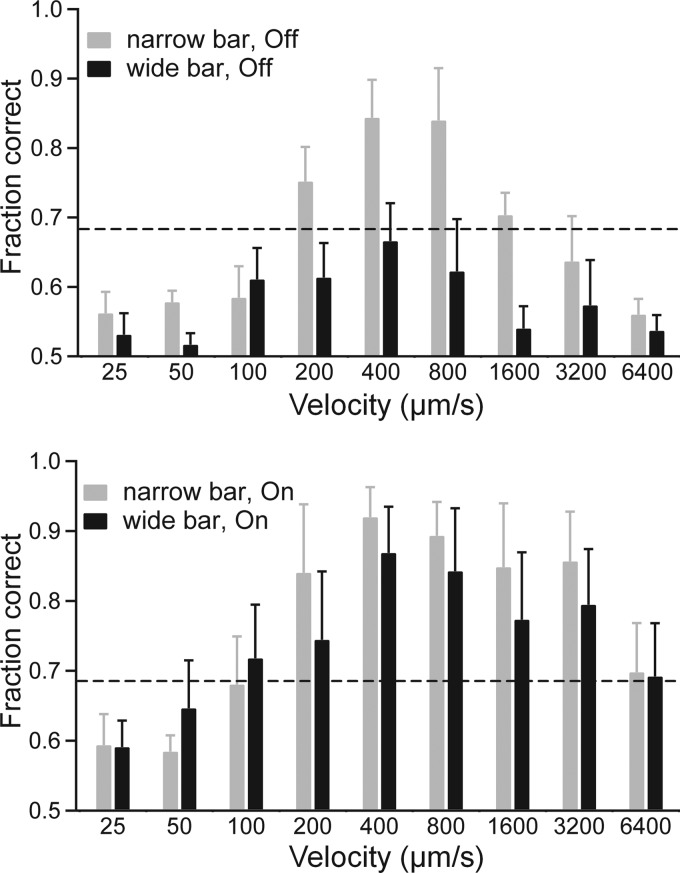
The DSGC's response is inhibited by large-field stimuli, which suggests that it is optimized for detecting local motion (Chiao and Masland 2003; Olveczky et al. 2003). However, one might imagine that the greater spatial integration possible during wide-bar stimulation should improve performance. To test the importance of spatial integration for direction selectivity, we compared the performance of DSGCs in response to narrow and wide moving bars (Fig. 3), using an ideal observer two-alternative forced-choice task (Smith and Dhingra 2009). For simplicity, we took the response as the total number of spikes evoked by the leading or trailing edge of the moving bar. The contrast of the moving bar was set to 20%, which produced moderate DSI of ∼0.5 for Off responses and strong DSI of ∼0.8 for On responses (Fig. 2B).
Fig. 3.
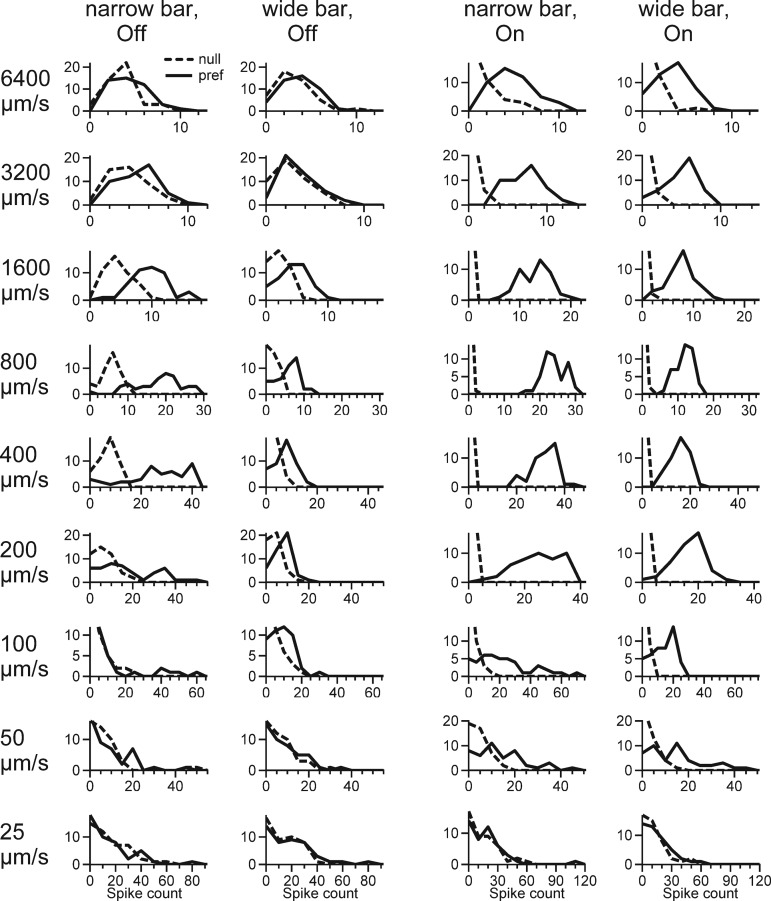
Stimulation of surround reduces direction selectivity: histograms showing stimulus trials binned according to the number of spikes generated in a representative guinea pig On-Off DSGC in response to narrow and wide bars at 20% contrast. x-Axis represents number of spikes per trial, and y-axis represents number of trials. In some panels the zero-spikes bin has been truncated to more clearly show the positive-response trials. The bar was moving in the preferred and null directions at velocities from 25 μm/s to 6,400 μm/s. Responses to null- and preferred-direction motion are better separated for On responses than for Off responses.
For each stimulus, the number of spikes in each trial was tallied in a histogram and normalized. Therefore, the amplitude of the histograms for each spike number reflected the probability that this number was evoked by preferred or null direction. Where the histograms overlapped, the response could be evoked by either stimulus, which implied ambiguity, lowering performance of the DSGC. When the histograms of null- and preferred-direction responses were completely nonoverlapping, there was no ambiguity and the ideal observer gave 100% correct answers, even when the shape of the histograms was not Gaussian. Thus as the area of overlap of the histograms becomes smaller, the performance of the DSGC increases. For example, in the On responses at velocities 200 μm/s, 400 μm/s, and 800 μm/s in Fig. 3 the two histograms were completely nonoverlapping, which gave answers 100% correct. The width of each histogram reflected the variability in the responses. Histograms with large variability and thus large overlap, for example, those for Off responses at 1,600 μm/s in Fig. 3, resulted in reduced performance.
In the preferred direction, the number of spikes for narrow bars was greater than for wide bars (Fig. 3), suggesting suppression of the excitation by the surround. If the surround suppressed the excitation and inhibition proportionally, spiking in the null direction would also be suppressed (Hoggarth et al. 2015). However, in the null direction, the number of spikes for both narrow and wide bars was similar, albeit zero for some of the On responses (Fig. 3). This increased overlap between the histograms was reflected in the reduced performance of the DSGC for wide bars (Fig. 4).
Fig. 4.
The ideal observer discriminates between preferred- and null-direction motion better in response to narrow bar. Narrow and wide bars with 20% contrast were presented at velocities from 25 μm/s to 6,400 μm/s. Responses from On-Off DSGCs (n = 5) were recorded extracellularly. Discrimination between preferred and null direction is shown for Off (top) and On (bottom) responses. Dashed line shows 68% discrimination threshold.
Surround stimulation suppresses inhibitory and excitatory inputs to DSGCs.
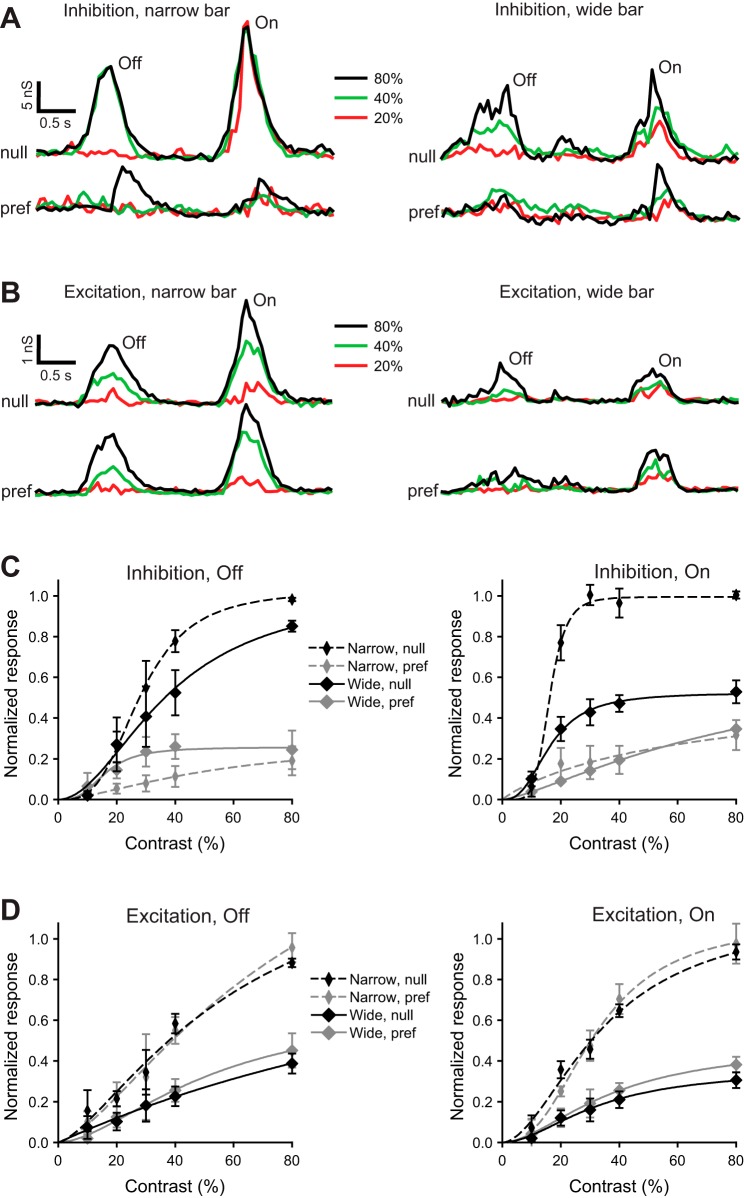
To investigate the synaptic mechanisms responsible for greater performance of DSGCs in response to narrow bars, we recorded light-evoked currents in whole cell mode and extracted underlying inhibitory and excitatory conductances (see materials and methods). In some cells a narrow bar moving in the null direction produced either no inhibition or maximal inhibition regardless of contrast (Fig. 5A, left). However, the excitation in response to a narrow bar moving in the null direction was graded (Fig. 5B, left). Stimulation with a wide bar moving in the null direction, which will activate a larger surrounding region, decreased the magnitude of both inhibition and excitation and produced more graded inhibition as a function of contrast (Fig. 5, A and B, right).
Fig. 5.
Stimulation of the surround suppresses both inhibition and excitation to guinea pig DSGCs. A and B: light-evoked inhibitory (A) and excitatory (B) conductances in a representative guinea pig DSGC in response to narrow (100-μm width, left) and wide (850-μm width, right) bars moving at 400 μm/s in the null (top) and preferred (bottom) directions. Light-evoked conductances are shown for contrasts 20%, 40%, and 80%. C and D: contrast dependence of the integrated inhibitory (C) and excitatory (D) Off (left) and On (right) conductances in response to a narrow (100 μm) and a wide (850 μm) bar moving in the preferred or null direction at 400 μm/s; n = 11. The integrated light-evoked conductances were normalized to the predicted values at 100% contrast, evoked by a narrow bar moving in the null direction, and fit with the Hill equation.
Inhibition evoked by a bar, narrow or wide, moving in the preferred direction was less than that in the null direction (Fig. 5A). However, the excitation during preferred direction motion was similar to excitation in the null direction (Fig. 5B). Notably, with stimulation by a narrow bar, the nonlinearity of the contrast gain of the null-direction inhibition was much higher than that of the excitation, reflected in the Hill coefficients: 3.27 ± 0.14 vs. 1.44 ± 0.56 (Off, P < 0.001) and 5.79 ± 0.71 vs. 1.82 ± 0.38 (On, P < 0.001) (Fig. 5C). The surround stimulation linearized the null-direction inhibition, reflected in the decrease of the Hill coefficient from 3.27 ± 0.14 to 1.97 ± 0.44 (Off, P < 0.001) and from 5.79 ± 0.71 to 2.70 ± 0.27 (On, P < 0.001) (Fig. 5C).
Although the averaged null-direction inhibition in response to narrow and wide bars did not differ at ≤20% contrast, at higher contrast the inhibition for narrow and wide bars differed significantly (Fig. 5C). However, at ≥20% contrast the excitation in response to narrow bars was significantly greater than for wide bars, albeit nondirectional (Fig. 5D). Moreover, the inhibition at ≥20% contrast in preferred and null directions differed dramatically. Therefore, the better performance in response to narrow bar stimulation (Fig. 4) likely resulted from stronger directionality of the inhibition in combination with the greater excitation in response to narrow bars.
The contrast gain of the DSGC's glutamatergic input is more linear than its cholinergic input.
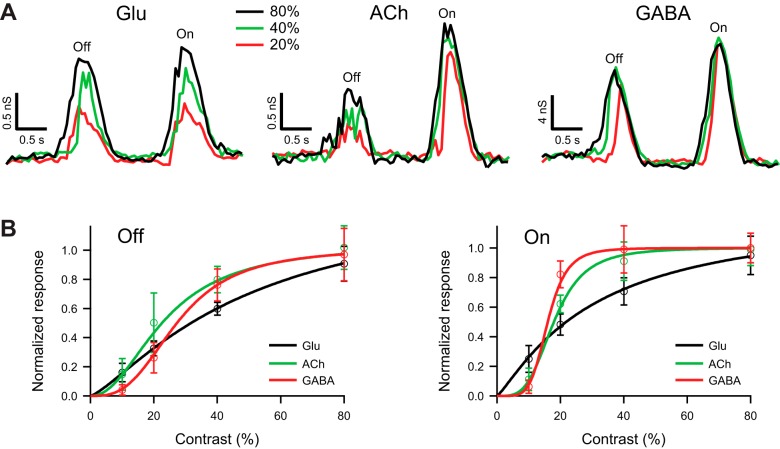
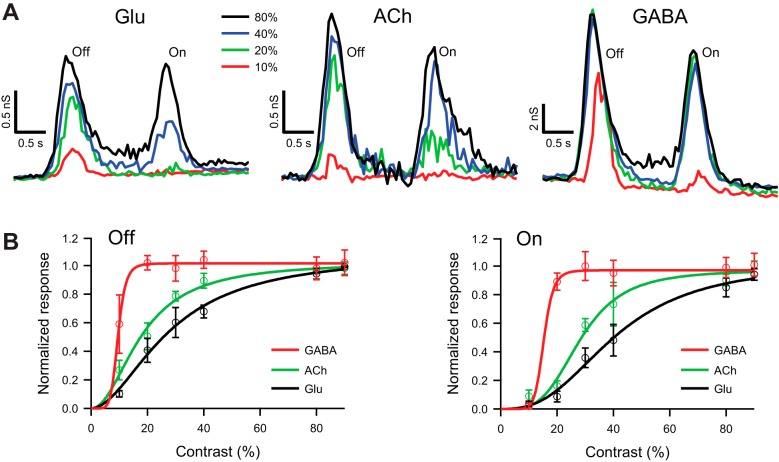
Since the SBACs that provide inhibitory inputs to DSGCs also make excitatory contacts via cholinergic receptors, we next examined the contrast dependence of the cholinergic inputs to the DSGC. The cholinergic input was taken as the difference in excitation between control and block of nicotinic receptors (Kittila and Massey 1997). The isolated glutamatergic input to guinea pig DSGCs depended linearly on contrast, reflected in the values of the Hill coefficients for Off (1.29 ± 0.30) and On (1.18 ± 0.24) responses close to unity (Fig. 6). Unlike glutamatergic input, the cholinergic input increased nonlinearly with contrast, as reflected in the values of the Hill coefficients for Off (2.13 ± 0.90) and On (3.70 ± 1.33) responses (Fig. 6). SBACs express nicotinic receptors in early development but not in the adult (Zheng et al. 2004). It is noteworthy that the Hill coefficients measured for inhibition during cholinergic block were unchanged [Off: 3.34 ± 0.33 vs. 3.27 ± 0.14 (P = 0.9); On: 5.42 ± 0.75 vs. 5.79 ± 0.71 (P = 0.7); n = 6, paired t-test], indicating that cholinergic mechanisms do not play a major role in generating the high-contrast gain for inhibition.
Fig. 6.
Glutamatergic input to guinea pig DSGCs increases gradually with contrast. A: light-evoked glutamatergic (left), cholinergic (center), and GABAergic (right) conductances in a representative DSGC in response to a narrow bar (100 μm), moving in the null direction at 400 μm/s, and contrasts 20%, 40%, and 80%. Glutamatergic and GABAergic conductances were measured under block of nicotinic receptors. The cholinergic conductance was measured as the difference between excitatory inputs in control and under block of nicotinic receptors. B: contrast dependence of the integrated Off (left) and On (right) glutamatergic, cholinergic, and GABAergic conductances in response to a narrow bar (100 μm) moving in the null direction at 200 μm/s; n = 6. For both On and Off responses, the cholinergic excitation had more nonlinear gain than the glutamatergic excitation. The integrated conductances were normalized and fit with the Hill equation (see materials and methods).
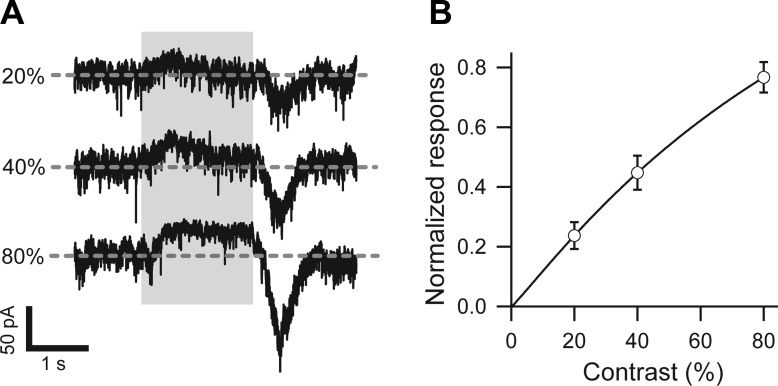
The high inhibitory gain to DSGCs reflects high gain for GABA release from SBACs. The latter may result from high gain for excitatory input to SBACs. A previous study showed that SBACs receive graded excitation for light spots (Taylor and Wässle 1995) but did not measure the contrast dependence of excitation for moving bars. To test whether excitation was also graded for moving stimuli, we recorded light-evoked currents in On SBACs in response to narrow moving bars with negative contrasts of 20%, 40%, and 80%. The dark stimulus bar suppressed a tonic excitatory input to the SBAC, resulting in a net outward current that was particularly evident at the highest contrast (Fig. 7A). The excitatory On response generated at the trailing edge of the dark bar was graded with light contrast (Fig. 7B), similar to the graded dependence for light flashes reported previously (Fig. 5 in Taylor and Wässle 1995).
Fig. 7.
Excitatory input to On starburst amacrine cells (SBACs) is graded with contrast. A: excitatory currents from a representative guinea pig On SBAC recorded while holding close to the resting potential (−62 mV) in response to a narrow dark bar with contrast 20%, 40%, and 80%. Velocity of the bar was 400 μm/s, length 700 μm, width 100 μm, so the soma was covered by the moving bar for 1.75 s (gray). The size of the dendritic tree was ∼220 μm. B: excitation to guinea pig On SBACs (n = 5) depended linearly on contrast. The excitation was integrated during the On response below the baseline (dashed line in A), fit with the Hill equation, and normalized to the extrapolated value at 100% contrast.
Surround stimulation suppresses inhibitory input to rabbit DSGC.
To determine whether the high nonlinear gain found for inhibition evoked by narrow bars in guinea pig is a general phenomenon, we studied DSGCs in another species—rabbit. Previous studies have shown that responses of rabbit DSGCs are inhibited by large-field stimuli (Chiao and Masland 2003). Such surround inhibition is thought to be mediated at least in part by wide-field amacrine cells (Hoggarth et al. 2015). We hypothesized that surround inhibition might modulate the nonlinearity we observed in guinea pig. To test the effect of stimulating the surround, we recorded rabbit DSGC responses to a wide moving bar.
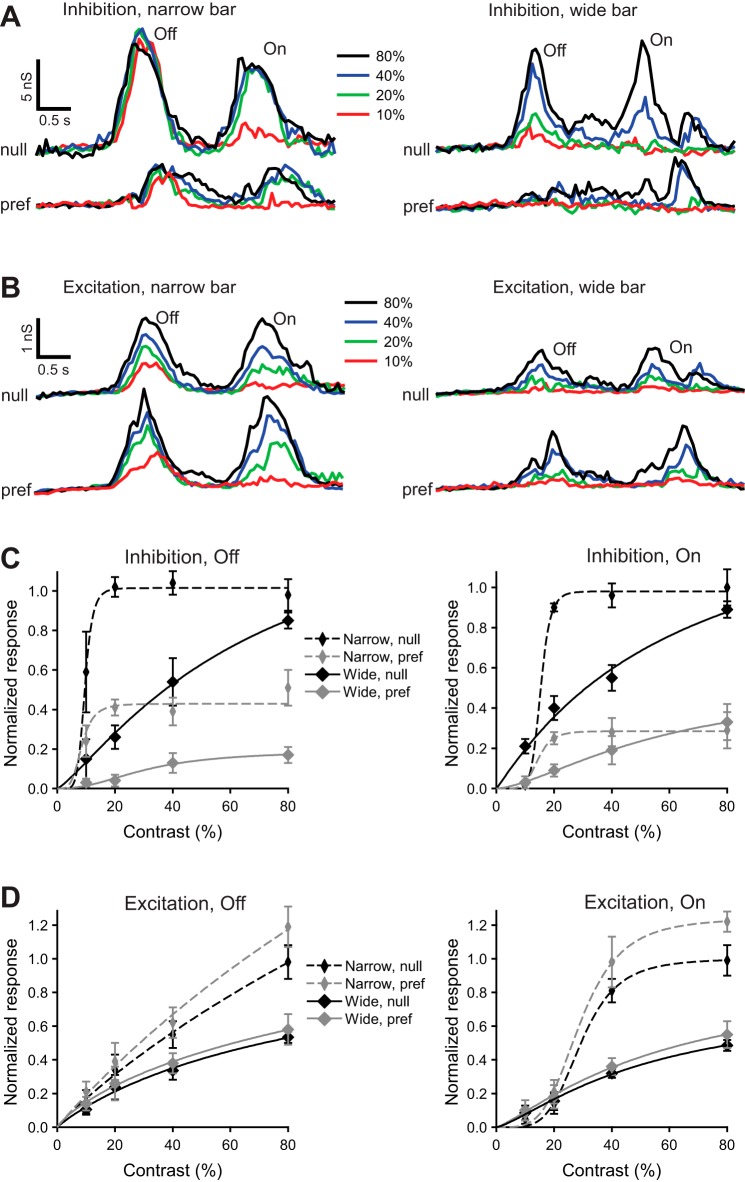
Stimulation of the surround by a wide moving bar not only suppressed the inhibitory input to the rabbit DSGC but reduced the nonlinearity in the contrast gain (Fig. 8), as reflected in a reduction in the Hill coefficient (Off: 5.7 ± 1.2 to 1.2 ± 0.4; On: 5.8 ± 1.0 to 1.1 ± 0.3; P ≪ 0.001; paired t-test, n = 4). Consistent with the extracellular recordings of Chiao and Masland (2003), we found that surround stimulation also suppressed excitation (Fig. 8, B and D) by 60 ± 18% in rabbit DSGCs (summed On and Off responses at contrast 80%).
Fig. 8.
Stimulation of the surround linearizes inhibition to rabbit DSGCs. A and B: light-evoked inhibitory (A) and excitatory (B) conductances in a representative rabbit DSGC in response to narrow (200-μm width, left) and wide (900-μm width, right) bars moving at 400 μm/s in the null (top) and preferred (bottom) directions. Light-evoked conductances are shown for contrasts 10%, 20%, 40%, and 80%. C and D: contrast dependence of the integrated inhibitory (C) and excitatory (D) Off (left) and On (right) conductances in response to narrow (200 μm) and wide (900 μm) bars moving in the preferred or null direction at 400 μm/s; n = 4. The integrated light-evoked conductances were normalized to the predicted values at 100% contrast, evoked by a narrow bar moving in the null direction, and fit with the Hill equation.
We measured the contrast dependence of glutamatergic excitation in the absence of cholinergic transmission by blocking nicotinic receptors (Kittila and Massey 1997). The isolated glutamatergic input to rabbit DSGCs depended linearly on contrast (Fig. 9). The Hill coefficients measured for inhibition during cholinergic block were unchanged [Off: 4.9 ± 0.6 vs. 5.2 ± 0.4 (P = 0.4), On: 5.8 ± 0.5 vs. 6.3 ± 2.2 (P = 0.6); n = 6, paired t-test], indicating that, similar to the guinea pig, cholinergic mechanisms do not play a major role in generating the high-contrast gain for inhibition in the rabbit.
Fig. 9.
Glutamatergic and cholinergic inputs to rabbit DSGCs increase gradually with contrast. A: light-evoked glutamatergic (left), cholinergic (center), and GABAergic (right) conductances in a representative rabbit DSGC in response to a narrow bar (200 μm), moving in the null direction at 400 μm/s, and contrasts 10%, 20%, 40%, and 80%. Glutamatergic and GABAergic conductances were measured under block of nicotinic receptors. The cholinergic conductance was measured as the difference between excitatory inputs in control and under block of nicotinic receptors. B: contrast dependence of the integrated Off (left) and On (right) glutamatergic, cholinergic, and GABAergic conductances in response to a narrow bar (200 μm) moving in the null direction at 400 μm/s; n = 6. For both On and Off responses, the cholinergic excitation had more nonlinear gain than the glutamatergic excitation, but not as high as the inhibition. The integrated conductances were normalized and fit with the Hill equation (see materials and methods).
In response to a narrow moving bar, inhibition in rabbit DSGCs is high-gain saturating but excitation is graded.
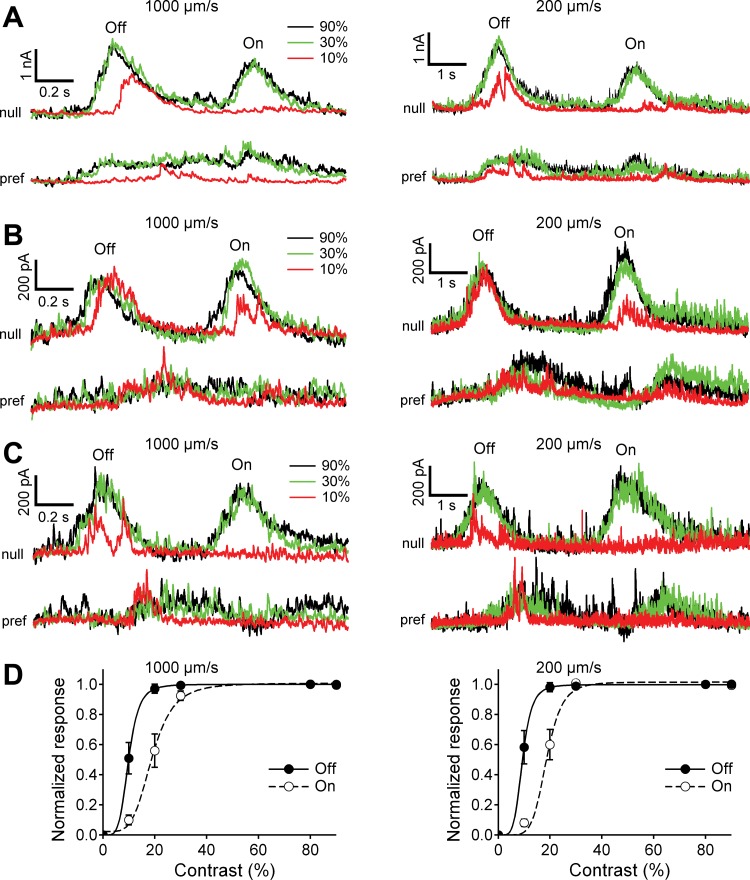
To better determine the mechanism for the very high-contrast gain of the inhibition, we investigated it further on a finer timescale by recording the DSGCs' inhibitory inputs at the reversal potential for the excitation. In response to a narrow bar moving in the null direction, light-evoked inhibitory currents in rabbit DSGCs saturated at contrasts ≥30% (Fig. 10). In this context, the term “saturated” means that the response to a low contrast equaled the response to a higher contrast. Inhibitory currents in response to moving bars with 10% contrast were often erratic from trial to trial; some trials were similar in magnitude to the level evoked by 30% and 90% contrasts, other trials lacked inhibitory responses, or in some cases the inhibition was zero, or noisy. Moreover, in some trials, 10% contrast evoked inhibition with only a noisy baseline at the beginning of stimulation until, with variable latency, it rapidly rose to the saturated envelope (Fig. 10, A, B, and D). In most cases, after the low-contrast inhibition saturated, it followed the envelope of the high-contrast inhibition.
Fig. 10.
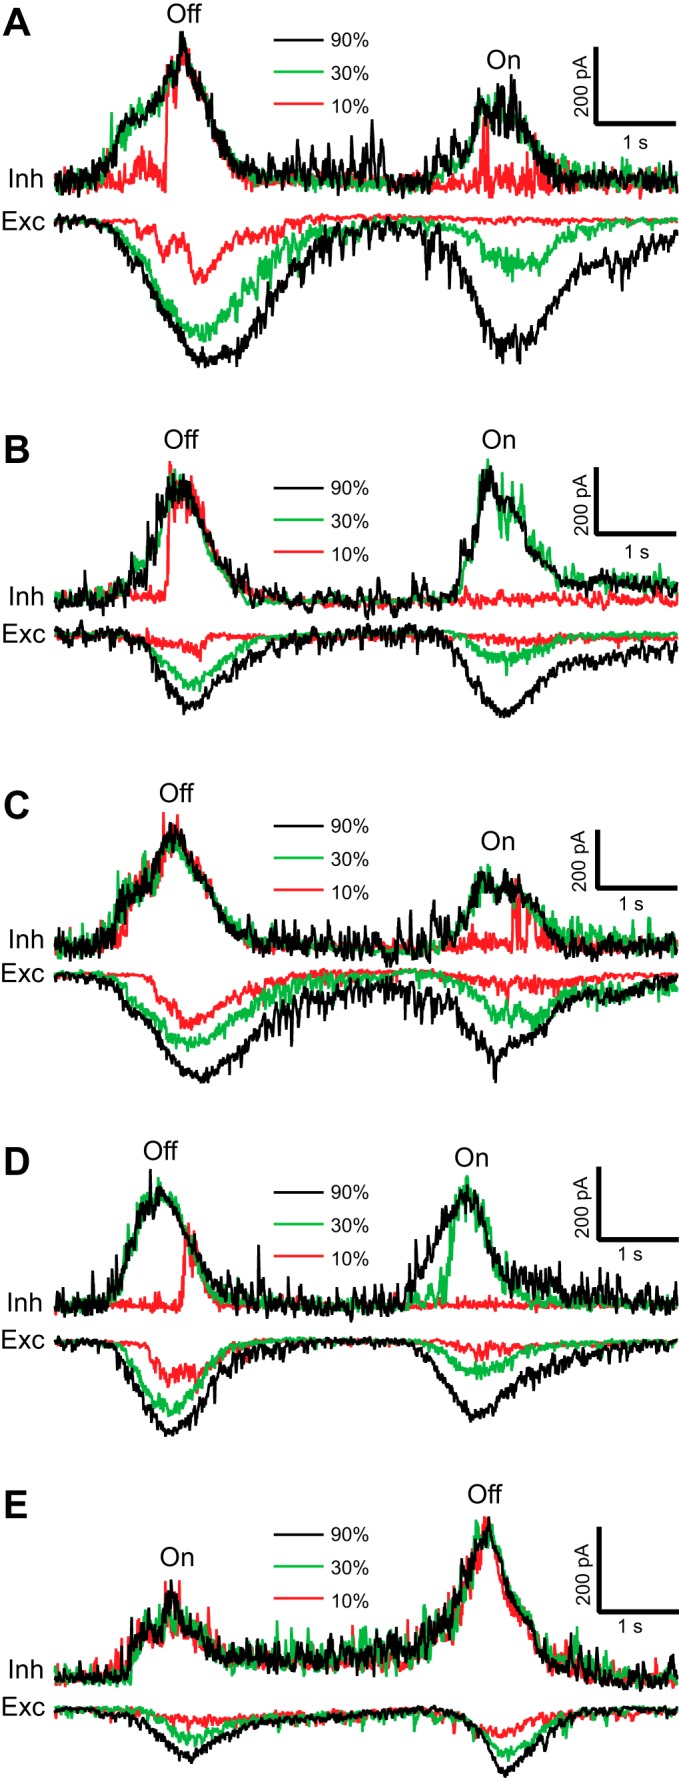
Inhibitory input to the rabbit DSGC is all or none, but excitatory input is graded. A–E: inhibitory (top) and excitatory (bottom) currents in representative DSGCs evoked by dark (A–D) and light (E) narrow bars with contrast 10%, 30%, and 90% moving in the null direction with velocity of 200 μm/s. Note that the inhibition at 10% contrast was either absent or saturated at the envelope of (maximal magnitude for) the highest contrast of 90%, whereas the magnitude of the excitation always increased with contrast. Often the magnitude of the light-evoked inhibition at the lowest contrast of 10% suddenly jumped from zero to its amplitude at the highest contrast of 90%, e.g., Off-inhibitory responses to 10% contrast in A, B, and D.
The intensity-response relations for a group of cells displayed the characteristic contrast sensitivity of inhibition and excitation (Fig. 11). The inhibition changed from zero to its maximal value within one step of the contrast, whereas the excitation increased with each additional step of the contrast. Moreover, at relatively low contrast the inhibition saturated at both high and low stimulus velocities (Fig. 12). The steep dependence of inhibition on stimulus contrast might result from a positive feedback mechanism in the presynaptic inhibitory pathway that increases the gain and causes saturation at relatively low contrast. Consistent with this hypothesis, the onset of inhibition at low contrast was often delayed compared with high contrast (Fig. 10, A, B, and D, and Fig. 12, A and B), which would be expected from a threshold for activation of a positive feedback loop, in which small signals take a longer time to exceed the activation threshold.
Fig. 11.
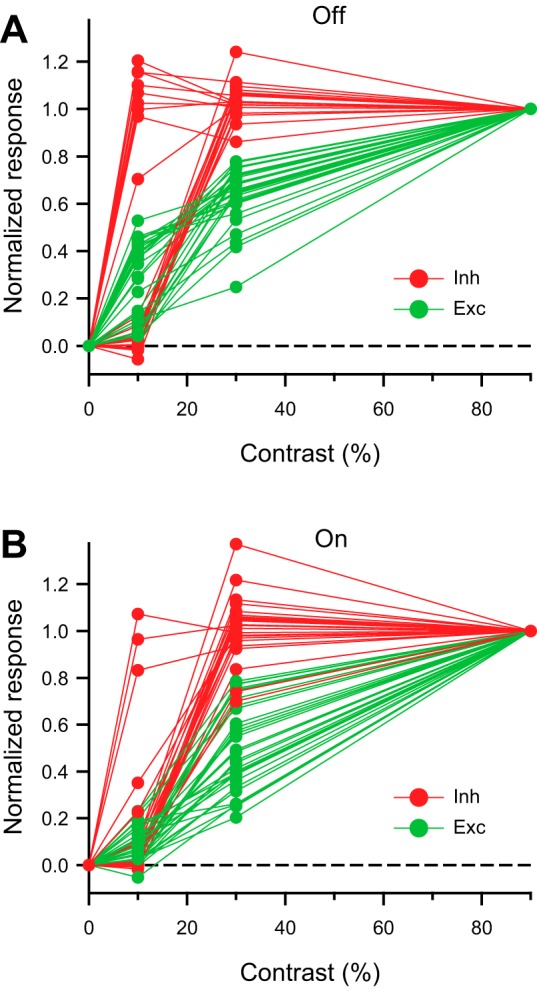
Inhibition in rabbit DSGCs saturates within 1 contrast step. A and B: amplitudes of the light-evoked inhibitory and excitatory Off (A) and On (B) currents in rabbit DSGCs (n = 20) normalized to the maximal amplitudes at the highest contrast of 90%. Dashed lines represent 0 baseline. DSGCs were stimulated with dark or light bars moving in the null direction at a velocity of 200 μm/s. Note that the inhibition jumped from 0 to a maximum within a single step of the contrast, whereas the excitation increased with contrast gradually.
Fig. 12.
Inhibitory input to rabbit DSGCs is strongly nonlinear at high and low velocities. A–C: light-evoked inhibitory currents in 3 representative DSGCs in response to a narrow moving bar, 200 μm wide. For each cell, the inhibition is shown in response to motion in the null and preferred directions at high (1,000 μm/s, left) and low (200 μm/s, right) velocities and contrasts of 10%, 30%, and 90%. Note that the temporal scale on right is 5-fold larger than that on left. Although the integral of the inhibitory currents is larger for slower velocities (right), the peak currents are nearly the same. D: contrast dependence of the integrated On and Off inhibitory currents in response to a narrow bar moving in the null direction at 1,000 μm/s (left) and 200 μm/s (right); n = 24. The integrated currents were normalized and fit with the Hill equation (see materials and methods). Note that the nonlinearity of the integrated currents is underestimated because of the averaging over the duration of the response (e.g., in A, left, Off-inhibitory conductance at 10% contrast is 0 in the beginning and saturated at the end, whereas the integrated current is a time average and represents this as a submaximal inhibition).
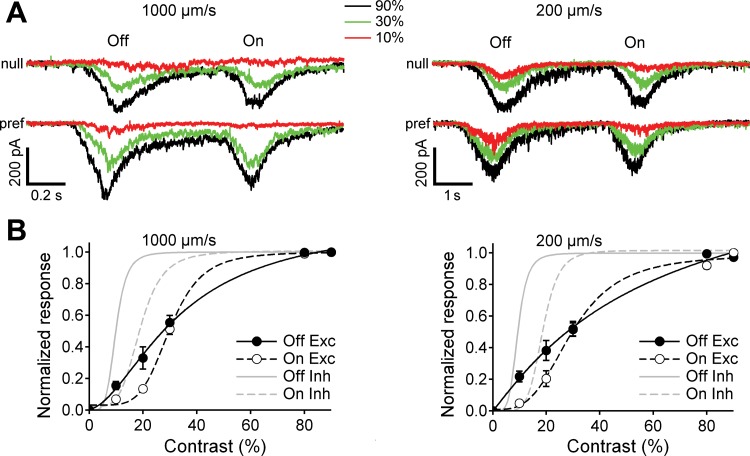
The excitatory inputs invariably showed a graded increase in amplitude as a function of the stimulus contrast. In response to a narrow bar moving in the null direction, the Off excitatory currents in rabbit DSGCs increased more gradually with contrast than did the inhibition (Fig. 10 and Fig. 13). For example, at low contrast, the null-direction Off inhibition shown in Fig. 12B was saturated, whereas Off excitation to the same cell (shown in Fig. 13A) was weak and unsaturated. Overall, we found that at low contrast excitation was weak and uncorrelated with the strength of inhibition (Fig. 13B). These differences were reflected in lower Hill coefficients measured for Off excitation compared with Off inhibition [1.7 ± 0.3 vs. 5.0 ± 0.6 (P ≪ 0.001) at 1,000 μm/s, 1.1 ± 0.4 vs. 5.2 ± 0.4 (P ≪ 0.001) at 200 μm/s; paired t-test], along with higher C50 values for excitation [27.5% ± 4.5% vs. 9.8% ± 2.3% (P ≪ 0.001) at 1,000 μm/s; 27.8% ± 5.4% vs. 9.4% ± 2.5% (P ≪ 0.001) at 200 μm/s]. The difference in the contrast sensitivity for excitation and inhibition for the On responses was less marked. The Hill coefficient for On excitation was lower than for On inhibition at 200 μm/s (3.4 ± 0.8 vs. 6.3 ± 2.2, P ≪ 0.001) but similar at 1,000 μm/s (5.1 ± 1.1 vs. 4.6 ± 0.9, P = 0.1). Similar to the Off response, the C50 values for On responses were higher for excitation than inhibition at both velocities [29.7 ± 4.4% vs. 18.7 ± 1.8% (P ≪ 0.001) at 1,000 μm/s, 29.7 ± 5.2% vs. 18.5 ± 2.6% (P ≪ 0.001) at 200 μm/s]. Overall, excitation increased less steeply with contrast than did inhibition, implying a lower gain for the cholinergic or glutamatergic excitatory inputs compared with inhibition.
Fig. 13.
Excitatory input to rabbit DSGCs increases gradually with contrast at high and low velocities. A: light-evoked excitatory currents in a representative DSGC in response to a narrow moving bar, 200 μm wide. The excitation is shown in response to motion in null and preferred directions at high (1,000 μm/s, left) and low (200 μm/s, right) velocities and contrasts 10%, 30%, and 90%. B: contrast dependence of the integrated On and Off excitatory currents in response to a narrow bar moving in the null direction at 1,000 μm/s (left) and 200 μm/s (right); n = 24. The integrated currents were normalized and fit with the Hill equation (see materials and methods). The curves for the contrast dependence of the inhibition are taken from Fig. 12D.
High and low velocities generated sustained inhibition.
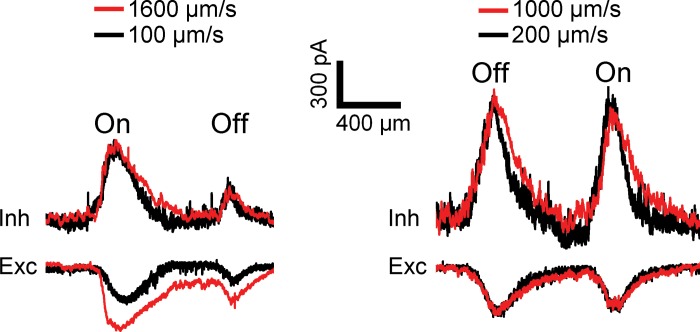
Previous studies showed robust direction selectivity at low stimulus velocity (Grzywacz and Amthor 2007; Wyatt and Daw 1975). This suggests that GABA release from the SBAC must be sustained (Lee and Zhou 2006; Stasheff and Masland 2002). To determine the temporal properties of the excitation and inhibition, we tested the synaptic inputs to the DSGC over a wide range of stimulus velocities, from 100 μm/s to 2,000 μm/s. The inhibition continued as long as the bar edge was moved across the receptive field, consistent with a high-gain saturated mechanism (Fig. 14). We found no difference in the peaks of inhibitory currents evoked by a narrow bar at low and high velocities (6.3% ± 7.1%, P = 0.4, n = 9; paired t-test). Compared with the inhibition, excitation appeared not to be saturated. The peak excitatory current varied with velocity but at high velocity (1,000 μm/s or 2,000 μm/s) was on average 22% ± 9% greater than the peak at low velocity (100 μm/s or 200 μm/s) (P = 0.03, n = 9; paired t-test).
Fig. 14.
Inhibition lasts for the duration of the stimulus edge sweeping across the DSGC: representative inhibitory (top) and excitatory (bottom) currents in 2 rabbit DSGCs in response to either a light (left) or dark (right) narrow bar with contrast 80% moving in the null direction at high and low velocities. The time axis was transformed into spatial location by multiplying by stimulus velocity. The temporal delays for responses to the faster stimulus, 150 ms (left) and 75 ms (right), were compensated by shifting the responses to a higher-velocity stimulus to the left. Longer bars were used for higher velocities to separate On and Off responses (see materials and methods). The peak excitatory currents varied with velocity, so that at higher velocity (left) they were often larger by 20–50%, but in some cases (right) they were similar.
To compare waveshapes at different velocities, we converted the temporal profile of inhibitory responses into spatial profiles by multiplying the timescale by the stimulus velocity. If the inhibitory postsynaptic currents were completely determined by the stimulus location, their spatial profiles and integrals should be similar at high and low velocities. Indeed, we found that the spatial profiles of the inhibition at high and low velocities were similar, although the spatial profiles at high velocity were systematically wider, presumably because of a limiting time constant (Fig. 14). The time constant, calculated as the ratio of the difference in widths of the spatial profiles to the difference in velocities, was 52 ± 9 ms for Off responses and 49 ± 7 ms for On responses (n = 24). Discounting this small temporal decay time constant, the integrals of the inhibitory currents over time were inversely proportional to velocity, and the spatial profiles of the inhibition at high and low velocities were similar. If the individual GABAergic inputs were transient, this would not happen, because the magnitude of the inhibition would be larger for higher velocities. These results suggest that the inhibition saturated to the same spatial response envelope at low and high velocities, and that the temporal waveshapes of individual GABAergic inputs were sustained.
DISCUSSION
Using whole cell recordings from the On-Off DSGC, we found that the gain of null-direction inhibition in the DSGC evoked by narrow bars was very high and exhibited a nonlinear dependence on contrast. At low stimulus contrast the inhibition was hardly evident, but above a threshold of ∼10% the inhibition saturated rapidly to a maximal amplitude. This nonlinearity appeared robust over a wide range of stimulus speeds. Such a mechanism could impart contrast invariance and noise immunity, and thus enable DSGCs to encode direction more robustly and selectively. Similar mechanisms appear to operate in both rabbit and guinea pig retinas.
We also found that the peak amplitude of null-direction inhibition to the DSGC was relatively speed invariant (Figs. 10, 12, and 14). Although the time integral of the inhibition is greater for the lower stimulus velocities, the peak of the inhibition is the same (Fig. 12 and Fig. 14). This differs from the fixed temporal correlation mechanism for direction selectivity hypothesized by Reichardt (1969). If the null-direction inhibition were driven by the Reichardt correlator, its profile should greatly depend on the stimulus velocity. The contrast and speed invariance of the inhibition seem to have a common mechanism—highly nonlinear contrast gain, practically “all or none,” that latches the inhibition to its saturating level as long as the stimulus moves across the DSGC's receptive field. This saturation of the null-direction inhibition above a low contrast threshold stops spiking at all contrasts and speeds, which renders direction selectivity more robust. Because both inhibition and excitation are essential for direction selectivity, their variability at low contrasts should weaken directional signals in the DSGC. Indeed, for stimuli at low contrasts, we found that directional spiking responses are less reliable (Fig. 2A).
Hypothesis for steep saturation of inhibition.
On average, as stimulus contrast increased, the inhibitory contrast-response relations typically displayed high Hill coefficients (Fig. 12D). In some cases, when inhibition was largely absent at low contrast, it jumped abruptly to a maximal amplitude above some threshold (Fig. 10), suggesting the hypothesis that the inhibition was amplified by positive feedback. For positive feedback to occur, a feedback loop must have a gain >1. At rest the gain is <1, and when the activation threshold is exceeded the gain increases and the system becomes regenerative, producing a fast-rising supralinear output. This type of hard saturation above a threshold renders the response invariant to contrast, allowing the DSGC to more specifically code direction.
This proposed combination of positive feedback and a threshold mechanism is similar to a Schmitt trigger, designed originally to mimic the all-or-none spike generation in the squid axon (Schmitt 1938; Schmitt and Schmitt 1940). In this example, the output is GABA release from SBACs and the feedback variable is the SBAC voltage. The threshold provides noise immunity and is sharpened by regeneration from positive feedback. An activation threshold well above baseline is vital; otherwise, the positive feedback could continuously amplify intrinsic noise in SBACs, resulting in random inhibition of the DSGC's responses. However, a consequence of a sharp threshold is that for low-contrast stimuli, which evoke subthreshold or near-threshold responses, inhibition will be erratic and direction selectivity will be compromised. Indeed, direction selectivity was found to be weaker for low-contrast stimuli (Fig. 2). Overall, the high-gain nonlinearity for inhibition confers to the DSGC some immunity to noise, because when inhibition is strong no spikes are initiated and when inhibition is weak it does not affect the spike train.
The positive feedback that drives inhibition into saturation could include both intrinsic and network properties of SBACs. Possible intrinsic mechanisms include calcium-induced calcium release (Warrier et al. 2005) and voltage-gated sodium or calcium channels (Cohen 2001; Oesch and Taylor 2010; Peters and Masland 1996). Voltage-gated sodium and calcium channels have moderately nonlinear activation functions but require a certain depolarization—a threshold above which they can become steeply regenerative. For example, calcium channels at a sufficient density might generate spikes in SBAC dendrites, similar to calcium spikes via calcium channels in the mixed bipolar cell terminals of goldfish (Baden et al. 2011; Lipin and Vigh 2015; Zenisek and Matthews 1998). A similar mechanism is involved in calcium-induced calcium release, generating positive feedback above a certain cytoplasmic concentration of calcium (Hajnóczky et al. 1999).
Network interactions could also produce high-gain nonlinear inhibition due to mutual tonic GABAergic inhibition between pairs of SBACs (Fig. 15; Fried and Masland 2007; Lee and Zhou 2006; Münch and Werblin 2006; Zheng et al. 2004). SBACs express nondesensitizing GABAA receptors (Brown et al. 2002; Greferath et al. 1993) and receive tonic excitation (Taylor and Wässle 1995), both of which are consistent with ongoing mutual inhibition. Positive feedback could arise during on-axis motion when an activated SBAC inhibits the opposing SBAC, which in turn will disinhibit the activated SBAC, thus completing the cycle (Taylor and Smith 2012). Although some recordings from SBACs have shown little effect of blocking GABAergic inhibition on the directionality of SBAC signals (Euler et al. 2002; Hausselt et al. 2007), the circular grating stimuli used in those studies differed from the narrow bars utilized in our experiments, which may have precluded the regenerative effect of reciprocal inhibition between SBACs. These intrinsic and network mechanisms are not mutually exclusive; for example, regenerative sodium or calcium channel activity within the reciprocally connected SBAC synapses could greatly enhance the nonlinear gain to produce steep all-or-none activation. The relative contributions of these different mechanisms remain to be determined.
Fig. 15.
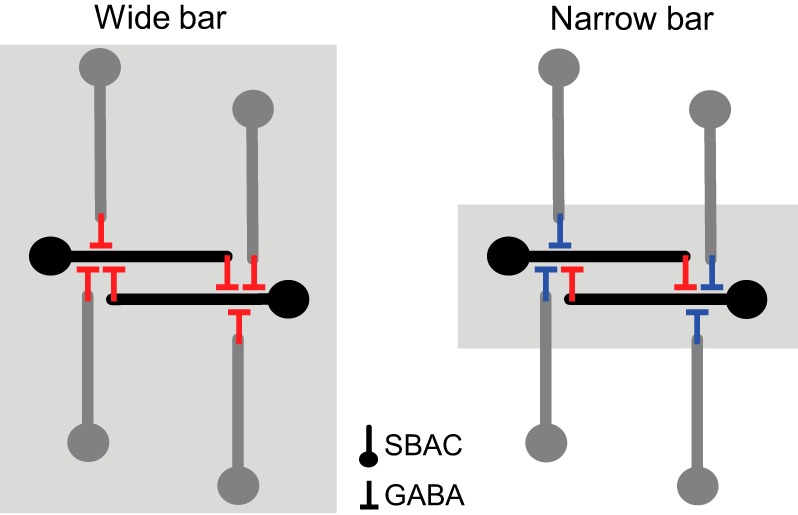
Schematics of the reciprocal inhibition in SBAC network. Left: stimulation with a wide bar excites surrounding SBACs (gray) that suppress GABA release from reciprocally inhibiting SBACs (black) via GABAergic inhibition (red). Right: stimulation with a narrow bar does not excite surrounding SBACs (gray) and therefore does not suppress GABA release from reciprocally inhibiting SBACs (black). In the absence of the surround stimulation, the surround inhibition is inactivated (shown in blue). Compared with the stimulation with a wide bar, stimulation with a narrow bar increases the positive feedback loop gain and GABA release from reciprocally inhibiting SBACs (black). For simplicity, only 1 unbranched dendrite for each SBAC is shown.
Activation of surround reduces the gain of reciprocal inhibition.
If the surround inhibition were only presynaptic, and did not act directly on the high-gain mechanism, for example, if wide-field amacrine cells inhibited the bipolar cells providing excitation to the SBAC (Hoggarth et al. 2015), one would expect the surround inhibition to shift the threshold for the nonlinearity to a higher contrast rather than attenuate the gain of the nonlinearity. Alternatively, the surround may reduce the gain of inhibition in DSGCs by directly inhibiting the SBACs (Fig. 15; Taylor and Smith 2012). For example, during stimulation with a wide bar, surround inhibition of the on-axis SBACs, by wide-field ACs and off-axis SBACs, will reduce the feedback loop gain, thereby reducing or eliminating the positive feedback. This latter mechanism seems more consistent with the data showing lower-contrast gain for wide relative to narrow bars (Figs. 5 and 8).
Recovery from positive feedback.
If the system is to function efficiently at all velocities, the feedback mechanisms that drive inhibitory release must be deactivated rapidly; otherwise the inhibition at low contrast would not follow the envelope at high contrast. Our results show that inhibition lasts as long as the edge of the bar moves across the DSGC's receptive field (Fig. 14). This finding suggests that the depolarization of the SBACs that drives the positive feedback is sustained and controls the envelope of the associated reciprocal inhibition. Thus when the GABA release saturates, it follows the envelope defined by the stimulus (Fig. 10). However, the positive feedback from the GABAergic loop cannot sustain depolarization of the SBAC in the absence of excitation. Therefore, in response to falling glutamatergic input from bipolar cells the depolarized SBAC will hyperpolarize and stop releasing GABA, which resets the all-or-none GABA release. Thus when the edge of the bar departs, the excitatory envelope will decrease and attenuate the reciprocal inhibition. In this view, positive feedback arising from reciprocal inhibition between SBACs could provide the fast recovery needed for direction-selective responses at high velocities, without the latch-up that positive feedback can cause in other systems. Another possibility is that after the positive feedback is activated by excitation of one SBAC dendrite at low velocity, it could be rapidly shut off by the inhibition activated as the stimulus edge moves onto and excites the opposing SBAC dendrite (Taylor and Smith 2012). Such a model does not preclude transient mechanisms, such as voltage-gated calcium or sodium channels, from contributing to the initial phase of the positive feedback.
Mechanisms for GABA and acetylcholine release may differ.
The results showing that excitation was graded with contrast (Figs. 5–13) raise questions related to the mechanisms and prevalence of cholinergic transmission from SBACs to DSGCs. Previous work indicates that GABA and acetylcholine are coreleased by the SBAC (Lee and Zhou 2006; O'Malley et al. 1992; O'Malley and Masland 1989), and therefore one might expect that the cholinergic input will precisely follow the GABAergic inputs to DSGC. However, we found that although they are both nonlinear the cholinergic input is more graded with slightly lower-contrast gain. This result might be explained by the finding that different voltage thresholds and different sets of calcium channels control release of GABA and acetylcholine (Lee et al. 2010).
An alternative explanation is that the tonic nondirectional nature of excitation from the SBAC network limits the excitatory gain. Assuming that a narrow moving bar evokes a regenerative electrogenic reciprocal inhibition mechanism in opposing SBAC dendrites, one might imagine that the cholinergic excitation from these dendrites to the DSGC would also show a high nonlinear gain. However, if the nondirectional cholinergic excitation to the DSGC is active tonically, as evident from the increase in the DSGC's spontaneous activity caused by acetylcholinesterase inhibitor (Ariel and Daw 1982), a fast-rising excitation from one SBAC dendrite will tend to cancel the fast-falling excitation from the opposing dendrite. If both SBAC dendrites provide cholinergic excitation to the DSGC, the sum will appear to have lower gain than the asymmetric inhibition.
Performance is maximal for narrow bars at medium contrast.
We observed that the direction selectivity, reflected in the DSI in response to narrow bars, was maximal at medium contrast (Fig. 2). At high contrast, the number of null direction spikes increased and the DSI declined (Merwine et al. 1998). One possible reason for this is that the excitation continued to increase, while the inhibition saturated with ≥30% contrast (Figs. 10–13). Thus, for null-direction motion of narrow bars, the inhibition at high contrast was insufficient to completely suppress the DSGC's spike response. However, in the preferred direction, the narrow bar evoked more spikes than the wide bar, presumably because of the absence of surround inhibition. Yet, in most DSGCs low-contrast narrow and wide bars moving in the null direction evoked about the same number of spikes. This finding suggests that during narrow-bar stimulation the positive feedback compensates for the increased excitation in the null direction. Thus positive feedback coupled to a threshold mechanism suppresses null-direction responses and reinforces direction selectivity.
GRANTS
This study was supported by National Eye Institute grants EY-022070 (W. R. Taylor and R. G. Smith) and EY-016607 (R. G. Smith).
DISCLOSURES
The authors do not have any potential conflict of interest (e.g., consultancies, stock ownership, equity interests, patent-licensing arrangements, lack of access to data, or lack of control of the decision to publish).
AUTHOR CONTRIBUTIONS
Author contributions: M.Y.L., W.R.T., and R.G.S. conception and design of research; M.Y.L. performed experiments; M.Y.L. analyzed data; M.Y.L., W.R.T., and R.G.S. interpreted results of experiments; M.Y.L. prepared figures; M.Y.L., W.R.T., and R.G.S. drafted manuscript; M.Y.L., W.R.T., and R.G.S. edited and revised manuscript; M.Y.L., W.R.T., and R.G.S. approved final version of manuscript.
REFERENCES
- Ackert JM, Farajian R, Völgyi B, Bloomfield SA. GABA blockade unmasks an OFF response in ON direction selective ganglion cells in the mammalian retina. J Physiol 587: 4481–4495, 2009. [DOI] [PMC free article] [PubMed] [Google Scholar]
- Amthor FR, Grzywacz NM. Nonlinearity of the inhibition underlying retinal directional selectivity. Vis Neurosci 6: 197–206, 1991. [DOI] [PubMed] [Google Scholar]
- Amthor FR, Keyser KT, Dmitrieva NA. Effects of the destruction of starburst-cholinergic amacrine cells by the toxin AF64A on rabbit retinal directional selectivity. Vis Neurosci 19: 495–509, 2002. [DOI] [PubMed] [Google Scholar]
- Ariel M, Daw NW. Pharmacological analysis of directionally sensitive rabbit retinal ganglion cells. J Physiol 324: 161–185, 1982. [DOI] [PMC free article] [PubMed] [Google Scholar]
- Baccus SA, Meister M. Fast and slow contrast adaptation in retinal circuitry. Neuron 36: 909–919, 2002. [DOI] [PubMed] [Google Scholar]
- Baden T, Esposti F, Nikolaev A, Lagnado L. Spikes in retinal bipolar cells phase-lock to visual stimuli with millisecond precision. Curr Biol 21: 1859–1869, 2011. [DOI] [PMC free article] [PubMed] [Google Scholar]
- Barlow HB, Hill RM. Selective sensitivity to direction of movement in ganglion cells of the rabbit retina. Science 139: 412–414, 1963. [DOI] [PubMed] [Google Scholar]
- Briggman KL, Helmstaedter M, Denk W. Wiring specificity in the direction-selectivity circuit of the retina. Nature 471: 183–188, 2011. [DOI] [PubMed] [Google Scholar]
- Brown N, Kerby J, Bonnert TP, Whiting PJ, Wafford KA. Pharmacological characterization of a novel cell line expressing human alpha4beta3delta GABAA receptors. Br J Pharmacol 136: 965–974, 2002. [DOI] [PMC free article] [PubMed] [Google Scholar]
- Buldyrev I, Puthussery T, Taylor WR. Synaptic pathways that shape the excitatory drive in an OFF retinal ganglion cell. J Neurophysiol 107: 1795–1807, 2012. [DOI] [PMC free article] [PubMed] [Google Scholar]
- Chiao CC, Masland RH. Starburst cells nondirectionally facilitate the responses of direction-selective retinal ganglion cells. J Neurosci 22: 10509–10513, 2002. [DOI] [PMC free article] [PubMed] [Google Scholar]
- Chiao CC, Masland RH. Contextual tuning of direction-selective retinal ganglion cells. Nat Neurosci 6: 1251–1252, 2003. [DOI] [PubMed] [Google Scholar]
- Cohen ED. Voltage-gated calcium and sodium currents of starburst amacrine cells in the rabbit retina. Vis Neurosci 18: 799–809, 2001. [DOI] [PubMed] [Google Scholar]
- Cohen ED, Miller RF. Quinoxalines block the mechanism of directional selectivity in ganglion cells of the rabbit retina. Proc Natl Acad Sci USA 92: 1127–1131, 1995. [DOI] [PMC free article] [PubMed] [Google Scholar]
- Dong W, Sun W, Zhang Y, Chen X, He S. Dendritic relationship between starburst amacrine cells and direction-selective ganglion cells in the rabbit retina. J Physiol 556: 11–17, 2004. [DOI] [PMC free article] [PubMed] [Google Scholar]
- Enciso GA, Rempe M, Dmitriev AV, Gavrikov KE, Terman D, Mangel SC. A model of direction selectivity in the starburst amacrine cell network. J Comput Neurosci 28: 567–578, 2010. [DOI] [PMC free article] [PubMed] [Google Scholar]
- Euler T, Detwiler PB, Denk W. Directionally selective calcium signals in dendrites of starburst amacrine cells. Nature 418: 845–852, 2002. [DOI] [PubMed] [Google Scholar]
- Famiglietti EV. Synaptic organization of starburst amacrine cells in rabbit retina: analysis of serial thin sections by electron microscopy and graphic reconstruction. J Comp Neurol 309: 40–70, 1991. [DOI] [PubMed] [Google Scholar]
- Fried SI, Masland RH. Image processing: how the retina detects the direction of image motion. Curr Biol 17: R63–R66, 2007. [DOI] [PubMed] [Google Scholar]
- Fried SI, Münch TA, Werblin FS. Mechanisms and circuitry underlying directional selectivity in the retina. Nature 420: 411–414, 2002. [DOI] [PubMed] [Google Scholar]
- Gavrikov KE, Dmitriev AV, Keyser KT, Mangel SC. Cation-chloride cotransporters mediate neural computation in the retina. Proc Natl Acad Sci USA 100: 16047–16052, 2003. [DOI] [PMC free article] [PubMed] [Google Scholar]
- Gavrikov KE, Nilson JE, Dmitriev AV, Zucker CL, Mangel SC. Dendritic compartmentalization of chloride cotransporters underlies directional responses of starburst amacrine cells in retina. Proc Natl Acad Sci USA 103: 18793–18798, 2006. [DOI] [PMC free article] [PubMed] [Google Scholar]
- Greferath U, Grünert U, Möhler H, Wässle H. Cholinergic amacrine cells of the rat retina express the delta-subunit of the GABAA-receptor. Neurosci Lett 163: 71–73, 1993. [DOI] [PubMed] [Google Scholar]
- Grzywacz NM, Amthor FR. Robust directional computation in on-off directionally selective ganglion cells of rabbit retina. Vis Neurosci 24: 647–661, 2007. [DOI] [PubMed] [Google Scholar]
- Grzywacz NM, Merwine DK, Amthor FR. Complementary roles of two excitatory pathways in retinal directional selectivity. Vis Neurosci 15: 1119–1127, 1998. [DOI] [PubMed] [Google Scholar]
- Hajnóczky G, Hager R, Thomas AP. Mitochondria suppress local feedback activation of inositol 1,4,5-trisphosphate receptors by Ca2+. J Biol Chem 274: 14157–14162, 1999. [DOI] [PubMed] [Google Scholar]
- Hausselt SE, Euler T, Detwiler PB, Denk W. A dendrite-autonomous mechanism for direction selectivity in retinal starburst amacrine cells. PLoS Biol 5: e185, 2007. [DOI] [PMC free article] [PubMed] [Google Scholar]
- He S, Levick WR. Spatial-temporal response characteristics of the ON-OFF direction selective ganglion cells in the rabbit retina. Neurosci Lett 285: 25–28, 2000. [DOI] [PubMed] [Google Scholar]
- Hoggarth A, McLaughlin AJ, Ronellenfitch K, Trenholm S, Vasandani R, Sethuramanujam S, Schwab D, Briggman KL, Awatramani GB. Specific wiring of distinct amacrine cells in the directionally selective retinal circuit permits independent coding of direction and size. Neuron 86: 276–291, 2015. [DOI] [PubMed] [Google Scholar]
- Kittila CA, Massey SC. Pharmacology of directionally selective ganglion cells in the rabbit retina. J Neurophysiol 77: 675–689, 1997. [DOI] [PubMed] [Google Scholar]
- Lee S, Kim K, Zhou ZJ. Role of ACh-GABA cotransmission in detecting image motion and motion direction. Neuron 68: 1159–1172, 2010. [DOI] [PMC free article] [PubMed] [Google Scholar]
- Lee S, Zhou ZJ. The synaptic mechanism of direction selectivity in distal processes of starburst amacrine cells. Neuron 51: 787–799, 2006. [DOI] [PMC free article] [PubMed] [Google Scholar]
- Lipin MY, Vigh J. Calcium spike-mediated digital signaling increases glutamate output at the visual threshold of retinal bipolar cells. J Neurophysiol 113: 550–566, 2015. [DOI] [PMC free article] [PubMed] [Google Scholar]
- Merwine DK, Grzywacz NM, Tjepkes DS, Amthor FR. Non-monotonic contrast behavior in directionally selective ganglion cells and evidence for its dependence on their GABAergic input. Vis Neurosci 15: 1129–1136, 1998. [DOI] [PubMed] [Google Scholar]
- Münch TA, Werblin FS. Symmetric interactions within a homogeneous starburst cell network can lead to robust asymmetries in dendrites of starburst amacrine cells. J Neurophysiol 96: 471–477, 2006. [DOI] [PubMed] [Google Scholar]
- Oesch NW, Taylor WR. Tetrodotoxin-resistant sodium channels contribute to directional responses in starburst amacrine cells. PLoS One 5: e12447, 2010. [DOI] [PMC free article] [PubMed] [Google Scholar]
- Olveczky BP, Baccus SA, Meister M. Segregation of object and background motion in the retina. Nature 423: 401–408, 2003. [DOI] [PubMed] [Google Scholar]
- O'Malley DM, Masland RH. Co-release of acetylcholine and gamma-aminobutyric acid by a retinal neuron. Proc Natl Acad Sci USA 86: 3414–3418, 1989. [DOI] [PMC free article] [PubMed] [Google Scholar]
- O'Malley DM, Sandell JH, Masland RH. Co-release of acetylcholine and GABA by the starburst amacrine cells. J Neurosci 12: 1394–1408, 1992. [DOI] [PMC free article] [PubMed] [Google Scholar]
- Oyster CW, Barlow HB. Direction-selective units in rabbit retina: distribution of preferred directions. Science 155: 841–842, 1967. [DOI] [PubMed] [Google Scholar]
- Pan ZH, Hu HJ. Voltage-dependent Na+ currents in mammalian retinal cone bipolar cells. J Neurophysiol 84: 2564–2571, 2000. [DOI] [PubMed] [Google Scholar]
- Peters BN, Masland RH. Responses to light of starburst amacrine cells. J Neurophysiol 75: 469–480, 1996. [DOI] [PubMed] [Google Scholar]
- Poleg-Polsky A, Diamond JS. Imperfect space clamp permits electrotonic interactions between inhibitory and excitatory synaptic conductances, distorting voltage clamp recordings. PLoS One 6: e19463, 2011. [DOI] [PMC free article] [PubMed] [Google Scholar]
- Reed BT, Amthor FR, Keyser KT. Rabbit retinal ganglion cell responses mediated by alpha-bungarotoxin-sensitive nicotinic ACh receptors. Vis Neurosci 19: 427–438, 2002. [DOI] [PubMed] [Google Scholar]
- Reichardt W. Movement perception in insects. In: Processing of Optical Data by Organisms and by Machines, edited by Reichardt W. New York: Academic, 1969. [Google Scholar]
- Schachter MJ, Oesch N, Smith RG, Taylor WR. Dendritic spikes amplify the synaptic signal to enhance detection of motion in a simulation of the direction-selective ganglion cell. PLoS Comput Biol 6: e1000899, 2010. [DOI] [PMC free article] [PubMed] [Google Scholar]
- Schmitt FO, Schmitt OH. Partial excitation and variable conduction in the squid giant axon. J Physiol 98: 26–46, 1940. [DOI] [PMC free article] [PubMed] [Google Scholar]
- Schmitt OH. A thermionic trigger. J Sci Instrum 15: 24–26, 1938. [Google Scholar]
- Smith RG, Dhingra NK. Ideal observer analysis of signal quality in retinal circuits. Prog Retin Eye Res 28: 263–288, 2009. [DOI] [PMC free article] [PubMed] [Google Scholar]
- Spoida K, Distler C, Trampe AK, Hoffmann KP. Blocking retinal chloride co-transporters KCC2 and NKCC: impact on direction selective ON and OFF responses in the rat's nucleus of the optic tract. PLoS One 7: e44724, 2012. [DOI] [PMC free article] [PubMed] [Google Scholar]
- Stasheff SF, Masland RH. Functional inhibition in direction-selective retinal ganglion cells: spatiotemporal extent and intralaminar interactions. J Neurophysiol 88: 1026–1039, 2002. [DOI] [PubMed] [Google Scholar]
- Taylor WR, Smith RG. The role of starburst amacrine cells in visual signal processing. Vis Neurosci 29: 73–81, 2012. [DOI] [PMC free article] [PubMed] [Google Scholar]
- Taylor WR, Vaney DI. Diverse synaptic mechanisms generate direction selectivity in the rabbit retina. J Neurosci 22: 7712–7720, 2002. [DOI] [PMC free article] [PubMed] [Google Scholar]
- Taylor WR, Wässle H. Receptive field properties of starburst cholinergic amacrine cells in the rabbit retina. Eur J Neurosci 7: 2308–2321, 1995. [DOI] [PubMed] [Google Scholar]
- Trenholm S, Johnson K, Li X, Smith RG, Awatramani GB. Parallel mechanisms encode direction in the retina. Neuron 71: 683–694, 2011. [DOI] [PMC free article] [PubMed] [Google Scholar]
- Trenholm S, McLaughlin AJ, Schwab DJ, Turner MH, Smith RG, Rieke F, Awatramani GB. Nonlinear dendritic integration of electrical and chemical synaptic inputs drives fine-scale correlations. Nat Neurosci 17: 1759–1766, 2014. [DOI] [PMC free article] [PubMed] [Google Scholar]
- Trenholm S, Schwab DJ, Balasubramanian V, Awatramani GB. Lag normalization in an electrically coupled neural network. Nat Neurosci 16: 154–156, 2013. [DOI] [PubMed] [Google Scholar]
- Tukker JJ, Taylor WR, Smith RG. Direction selectivity in a model of the starburst amacrine cell. Vis Neurosci 21: 611–625, 2004. [DOI] [PubMed] [Google Scholar]
- Vaney DI, Collin SP, Young HM. Dendritic relationships between cholinergic amacrine cells and direction selective ganglion cells. In: Neurobiology of the Inner Retina, edited by Weiler R, Osborne NN. Berlin: Springer, 1989, p. 157–168. [Google Scholar]
- Venkataramani S, Taylor WR. Orientation selectivity in rabbit retinal ganglion cells is mediated by presynaptic inhibition. J Neurosci 30: 15664–15676, 2010. [DOI] [PMC free article] [PubMed] [Google Scholar]
- Warrier A, Borges S, Dalcino D, Walters C, Wilson M. Calcium from internal stores triggers GABA release from retinal amacrine cells. J Neurophysiol 94: 4196–4208, 2005. [DOI] [PubMed] [Google Scholar]
- Wei W, Hamby AM, Zhou K, Feller MB. Development of asymmetric inhibition underlying direction selectivity in the retina. Nature 469: 402–406, 2011. [DOI] [PMC free article] [PubMed] [Google Scholar]
- Wyatt HJ, Daw NW. Directionally sensitive ganglion cells in the rabbit retina: specificity for stimulus direction, size and speed. J Neurophysiol 38: 613–626, 1975. [DOI] [PubMed] [Google Scholar]
- Wyatt HJ, Daw NW. Specific effects of neurotransmitter antagonists on ganglion cells in rabbit retina. Science 191: 204–205, 1976. [DOI] [PubMed] [Google Scholar]
- Yarbus AL. Eye Movements and Vision. New York: Plenum, 1967. [Google Scholar]
- Yin L, Smith RG, Sterling P, Brainard D. Chromatic properties of horizontal and ganglion cell responses follow a dual gradient in cone opsin expression. J Neurosci 26: 12351–12361, 2006. [DOI] [PMC free article] [PubMed] [Google Scholar]
- Zenisek D, Matthews G. Calcium action potentials in retinal bipolar neurons. Vis Neurosci 15: 69–75, 1998. [DOI] [PubMed] [Google Scholar]
- Zheng JJ, Lee S, Zhou ZJ. A developmental switch in the excitability and function of the starburst network in the mammalian retina. Neuron 44: 851–864, 2004. [DOI] [PubMed] [Google Scholar]
- Zhou ZJ, Lee S. Synaptic physiology of direction selectivity in the retina. J Physiol 586: 4371–4376, 2008. [DOI] [PMC free article] [PubMed] [Google Scholar]
- Zucker CL, Nilson JE, Ehinger B, Grzywacz NM. Compartmental localization of gamma-aminobutyric acid type B receptors in the cholinergic circuitry of the rabbit retina. J Comp Neurol 493: 448–459, 2005. [DOI] [PMC free article] [PubMed] [Google Scholar]


