

Abstract
Celiac disease (CD) is an immune mediated disorder in which mucosal autoantibodies to the enzyme transglutaminase 2 (TG2)1 are generated in response to the exogenous antigen gluten2 in individuals who are HLA-DQ2 or HLA-DQ83. We assessed in a comprehensive and non-biased manner the IgA anti-TG2 response by expression cloning of the antibody repertoire on ex vivo isolated intestinal antibody-secreting cells (ASCs). We found that TG2-specific plasma cells are hugely expanded in patients with active CD, representing on average 10% of ASCs within the duodenal mucosa. Surprisingly, anti-TG2 antibodies were of high affinity and yet showed little adaptation by somatic mutations. Unlike infection-induced peripheral blood plasmablasts4, the TG2-specific ASCs had neither recently proliferated nor were they short-lived ex vivo. Altogether these observations demonstrate that there is a germline repertoire with high affinity for TG2 that may favour massive generation of autoreactive B cells. Anti-TG2 antibodies did not block enzymatic activity and served as substrates for TG2-mediated crosslinking when expressed as IgD or IgM, but not as IgA1 or IgG1. This could result in preferential recruitment of plasma cells from naïve IgD/IgM-expressing B cells, thus possibly explaining why the anti-TG2 response bears signs of a primary immune response despite the disease chronicity.
CD, affecting about 1% of the populations of Europe and the United States, is a disorder with autoimmune features that is caused by intolerance to gluten proteins of wheat, barley and rye5. The disease lesion in the upper small bowel is characterized by villous blunting, epithelial crypt cell hyperplasia and leukocyte infiltration including plasmacytosis in the lamina propria. CD4+ T cells recognizing deamidated gluten peptides in the context of the disease-associated HLA-DQ molecules control the immune reaction that causes the lesion5. The gluten peptide deamidation is mediated by TG26,7, but how autoantibodies are generated against the enzyme that is essential for T-cell epitope formation is not known. TG2 also catalyzes a transamidation reaction, by which covalent protein-protein crosslinks can be formed. It has been hypothesized that complexes of TG2 and gluten can act as a hapten-carrier, allowing gluten reactive T cells to provide help to TG2-specific B cells8. Anti-TG2 antibodies are a key feature of CD. Although other autoantigens like collagen9 are also targeted, it is the anti-TG2 IgA that are primarily harnessed for diagnostic purposes, with sensitivity and specificity close to 100%10. Even in rare cases of seronegativity, it appears that anti-TG2 antibodies are produced, as proven by the presence of deposits in the intestine11. Given their increasing significance in clinical practice, it is important to establish how they are generated. Intestinal TG2-specific antibodies have been isolated by phage display12, but these antibodies have non-authentic VH and VL pairing. Here, by combining staining and isolation of TG2-specific plasma cells with expression cloning of antibody genes from single cells, we fully dissect the anti-TG2 antibody response in lesions of patients with active CD.
We used biotinylated TG2 to visualize TG2-specific ASCs by immunofluorescence in duodenal biopsy cryosections. In active CD, but not in healthy controls, we observed TG2-positive cells at high abundance, which predominantly expressed the plasma cell marker CD138 (Fig.1a-g and Supplementary Fig.1a-c). A biotinylated control protein (BSA) gave no staining (Fig.1h). IgA dominated the response over IgM (Fig.1f and Supplementary Fig.1d), while the IgG anti-TG2 response was very limited (Supplementary Figs.1-2).
Figure 1.

TG2-specific ASCs are localized in the duodenal mucosa of CD patients. (a) TG2-specific and total IgA secretion by CD138+ ASCs as compared to CD138neg cells (plated at 5-fold higher amount) sorted from an untreated CD patient. To exclude the possibility that detected antibodies were released from deposits, neoproduction of IgA was demonstrated by freeze-thaw treatment of ASCs. Data are representative of two independent experiments. Bars represent standard error. (b-h) Immunofluorescence staining of cryosections from biopsy specimens of CD patients and controls. (b) Section from an untreated CD patient stained with soluble biotinylated TG2 (green) and anti-CD138 (red); detail in panel c. (d) Exceptionally high frequency of TG2-specific ASCs in the lesion of another patient; detail in panel e. (f) Section from a CD patient stained with anti-IgA (green) and soluble biotinylated TG2 (red). (g) TG2 and anti-CD138 staining of a section from a healthy control. (h) Section from an untreated CD patient stained with a control biotinylated protein (BSA). Nuclei were counterstained with DAPI (blue). Data in b-h are representative of experiments performed on samples from several patients and controls. Scale bars, 50 μm.
IgA and IgM plasma cells of the small intestine express surface immunoglobulins13,14, thus allowing detection of antigen-specific cells with labeled TG2 multimers using flow cytometry (Fig.2a). The analysis of patients with untreated CD (n=13) revealed a high abundance of TG2-specific ASCs (mean 10%, range 4.5–23.8%; Fig.2b), consistent with the tissue staining experiments and further confirmed by ELISpot (Supplementary Fig.2). Patients on a gluten-free diet (GFD) (n=12, duration 12-156 months) showed reduced numbers of TG2-specific ASCs, whereas in control subjects the corresponding numbers were not above background. Patient data are provided in Supplementary Table 1 and Supplementary Fig.3. The intestinal ASCs were Ki-67neg,HLA-DRlow/neg,CD20neg,CD19low/+ (Fig.2c and Supplementary Fig.4) thus resembling terminally differentiated bone marrow plasma cells rather than circulating plasmablasts4,15. The gut-homing marker β7-integrin was mainly expressed on CD19+ cells (Supplementary Fig.4). Based on these findings we conclude that the duodenal plasma cell compartment in CD is heavily skewed towards the production of TG2-specific IgA, and that this contributes to the local plasmacytosis.
Figure 2.

TG2-specific ASCs are identified and sorted by flow cytometry for quantification and cloning of antibody variable genes. (a) Representative plots of ASCs stained with TG2 multimers from samples of patients with untreated or GFD-treated CD and non-CD controls. (b) Frequency of TG2+ ASCs in 33 analyzed samples. Each white dot represents a different donor. Antibodies were cloned from patients represented by black dots. Red dots represent two patients at early GFD timepoint with slow recovery and clinical observations still compatible with active disease. The blue dot represents a patient on 12 months of GFD, seronegative but with poor diet compliance and poor mucosal recovery. (c) Expression of intracellular Ki-67 and HLA-DR in ASCs (gate on large cells; ASCs defined as CD138+ cells). A proliferating Epstein-Barr Virus (EBV) immortalized B cell line was included as positive control for the intracellular Ki-67 staining. (d) Reactivity to recombinant human TG2 measured by ELISA of 63 hmAbs cloned from single TG2+ plasma cells of four patients with active CD, 15 hmAbs cloned from single TG2neg plasma cells from patient 3, and 50 hmAbs cloned from naïve cells from five non CD subjects41,42. For panel b: red bars indicate means and P values indicated were generated by Student’s t test. *, P < 0.05. ***, P < 0.001.
We then sorted single TG2+ plasma cells, cloned and expressed 63 recombinant human monoclonal antibodies (hmAbs) (16, 3, 38 and 6 from four subjects). We observed reactivity to TG2 by ELISA for 49/63 hmAbs (Fig.2d), with the best binders showing high avidity estimated at 10−11M. Typically, CD autoantibodies show a specific pattern of recognition of TG2 in the endomysium, the layer of connective tissue surrounding muscle fibers. We confirmed endomysial antibody (EMA) reactivity for 47/49 cloned hmAbs (Supplementary Fig.5); furthermore, 8 of the 14 low-affinity antibodies with only slight reactivity by ELISA scored positive in the EMA assay, giving a final count of 57/63 TG2-specific hmAbs (90% selection efficiency). Of 15 hmAbs cloned from TG2neg ASCs of one of the patients, some showed weak reactivity to TG2 in ELISA, but only one was specific as assessed by EMA and polyreactivity analysis (Supplementary Fig.6). Epitopes recognized on TG2 were conformational and none of the hmAbs were cross-reactive to gliadin. Supplementary Table 2 reports the characteristics of the hmAbs. Based on this we conclude that the hmAbs generated were truly representative of CD autoantibodies.
The anti-TG2 repertoire was dominated by usage of few antibody variable genes. Based on analysis of 60 TG2-specific antibody sequences (57 from TG2+ cells and one from TG2neg cells, plus two identical clonal sequences), the VH5-51 gene segment dominated the VH repertoire (45%, Fig.3a), consistently for all four subjects (Fig.3b) and with phage display data12. Also, based on single-cell PCR amplification frequencies, 95% of the anti-TG2 antibodies were encoded by kappa light chains (vs 55–60% normally), in particular of the VK1 family (79%, Supplementary Table 2). Strikingly, the anti-TG2 antibodies had only limited accumulation of somatic mutations (Fig.3c), but nevertheless they displayed high avidity even when entirely encoded by germline sequences (4/60, avidity up to 3×10⁻¹⁰). Thus, TG2 autoreactivity does not represent a by-product of affinity maturation for binding to foreign antigens16,17 nor is it formed by unmutated natural antibodies with broad non-specific binding18, as shown by the EMA assay and by normal frequencies of anti-DNA and anti-nuclear-antigen polyreactivity (Supplementary Fig.7). The extent of clonal relatedness, a measure of clonal expansion, was also limited with only four pairs of clonally related hmAbs. Anti-TG2 antibodies appear as intestinal deposits19 in CD in the absence of symptoms, suggesting that the response is initiated months or years before the establishment of the diagnosis20. Long-term presence of anti-TG2 antibodies is very likely in the 4 adult patients analyzed, who reported long-lasting abdominal discomfort. One would therefore predict persistent hypermutation and clonal expansion within this timeframe, considering the chronic exposure to the etiologic agent (gluten) and the autoantigen (TG2). Our findings are unexpected and represent key features to understand this autoantibody response.
Figure 3.

The highly restricted repertoire of TG2-specific ASCs suggests a unique origin for this autoantibody response. (a) Analysis of the heavy chain variable regions used comparing TG2-specific mucosal ASCs (by subject: n = 15, 3, 36, and 6) to the TG2-negative fraction (n = 30, and 38) and to ASCs from healthy mucosa of one subject (n = 69) or compared to our historical data on the repertoires of the intestinal anti-rotavirus plasma cells13 from 3 subjects, peripheral blood anti-influenza ASCs4 from 20 subjects and naïve cells41,42 from 5 subjects. Numbers of sequences in each pool are indicated in the pie charts. (b) Frequency of VH5-51 gene usage by subject. (c) Frequencies of VH region somatic mutations per sequence within the populations indicated. (d) Comparison of hmAb avidities as measured by the area-under-the-curve (AUC) of ELISA plots (original plots are in Fig. 2d). For panels a-d: red bars indicate means and P values indicated were generated by Student’s t test. *, P < 0.05. **, P < 0.01. ***, P < 0.001.
Finding optimal models for comparison is not simple as few human autoantibody gene sequences related to a mucosal autoimmune response are reported. At the intestinal level, recent work by our group on rotavirus-specific plasma cells13 (Fig.3c) and others14 provide the only available examples where the target antigens of the cloned human intestinal antibodies are known. In both cases, the antibody genes were highly mutated, also when the cloned antibodies recognized self antigens14. Also other viral diseases, which share similarities to CD in terms of repetitive or chronic exposure to the antigen, are characterized by a high degree of SHM4,21. Generation of the anti-TG2 response outside of GCs at extrafollicular sites where only limited SHM occurs22 could possibly explain the observed scarce mutations. In murine models it has been demonstrated that high affinity drives the expansion of such a plasmablast population23, and this could explain the near-germline VH5-51-encoded hmAbs binding with high affinity. However, the VH5-51-encoded hmAbs had significantly fewer mutations (p=0.005) and on average a 2-fold lower affinity for TG2 than those encoded by other genes (Fig.3c-d), suggesting some contribution of somatic mutations to binding strength. The exceptionally low mutation rate in VH5-51 may be a particular feature of this VH gene24. The mutations preferentially targeted AID hotspots (Supplementary Fig.8). To address whether TG2-specific cells had undergone affinity-driven maturation, we reverted a selected panel of hmAbs to their germline counterpart. All of the reverted anti-TG2 hmAbs retained binding, and 8 of them with decreased yet still relatively high affinity (Supplementary Fig.8). This suggests that TG2-specific B cells have undergone affinity-driven maturation in the GC, but to a very limited extent despite the chronic exposure to the triggering agents. Absence of TG2-specific IgA memory B cells in the peripheral blood of patients with active CD, as assessed by flow cytometry (not shown) and ELISpot on stimulated cells (0 TG2+ out of 7,54×10³±3,55×10³ IgA+ cells, 5 subjects tested), may also indicate limited GC activity, or alternatively drainage of TG2-specific memory B cells from blood. Class switching efficiently occurred, as the great majority of TG2-specific plasma cells expressed IgA. Finally, undetectable levels of AID transcripts (Supplementary Fig.9) suggest that switching happened outside the mucosa, rather than within it in a fashion similar to what has been described for B cells in the colon25.
A scenario thus takes shape where a vigorous primary response is maintained, further GC activity is limited or suppressed, and there is continuous triggering of TG2-specific naïve rather than memory B cells. This may result from the autoreactive nature of these cells, which seem to be recruited into GCs at a lesser extent26 or rapidly exit and undergo apoptosis27 because of peripheral immune tolerance mechanisms. Our data indicate generation of an early and massive burst of plasmablasts with relatively high affinity, and we suggest that the intrinsic yet specific autoreactivity to TG2 may allow naïve B cells to exceed the affinity threshold to proliferate and give rise to such abundant progeny28. Further supporting this view, we propose a mechanistic model for enhanced activation of naïve B cells involving crosslinking of the B-cell receptor (BCR) by TG2. We engineered a recombinant hmAb in order to express heavy chain of different isotypes, and have found that anti-TG2 hmAb as IgD and to a small extent IgM, but not as IgA1 or IgG1, are a substrate for TG2 and become covalently crosslinked (Fig.4a and Supplementary Fig.10). Crosslinking of BCRs or covalent linkage of antigen to BCR decreases the threshold for B-cell activation29,30. These factors taken together would increase the likelihood for activation of naïve TG2-specific B cells compared to isotype switched IgA-or IgG-expressing memory B cells. As this model builds on the assumption that TG2 be enzymatically active while bound to the BCR, we tested whether the hmAbs affected TG2 enzymatic activity (Fig.4b-c and Supplementary Fig.11). Only one of 47 assayed hmAbs had substantial inhibitory effect, and interference with conformational activation of TG2 appeared to be the mechanism of inhibition. In vivo, antibodies will bind TG2 in extracellular regions that have high Ca2+ concentrations, and in this setting none of the tested hmAbs would be inhibitory. Thus the antibodies, in contrast to what has been suggested31, do not exert a pathogenic role by inhibition of TG2 enzymatic activity.
Figure 4.
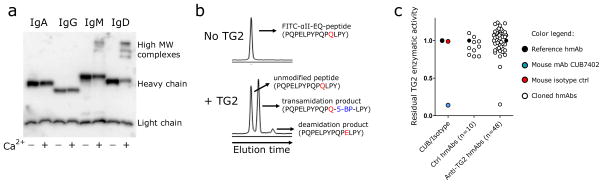
TG2 covalently crosslinks antibodies of the IgD isotype and its enzymatic activity is not inhibited by anti-TG2 hmAbs. (a) Western blot showing the effect of enzymatically active TG2 on a hmAb (679-14-E06) engineered with IgA1, IgG1, IgM or IgD constant regions. (b) Incubation of enzymatically active TG2 with a FITC-labeled gliadin peptide (DQ2.5-glia-α2(EQ) peptide, PQPELPYPQPQLPY) in the presence of the amine donor 5-BP generates transamidation and deamidation products, which are detected in a capillary electrophoresis assay. Details about the experimental aspects of the assay are reported in Supplementary Fig.11. (c) Effect of the mouse anti-TG2 murine mAb CUB7402 (positive control), mouse IgG1 isotype control, control hmAbs not reactive to TG2 (n=10) and anti-TG2 hmAbs (n=47) on the enzymatic activity of TG2. Residual activity on the Y axis is defined as the relative activity of each hmAb as compared with a non TG2-reactive isotype control hmAb, the activity of which is set to 1.
Another key question is whether anti-TG2 antibody formation results from a T-cell dependent or independent B cell response, the latter suggested by scarce SHM32. In mice, many intestinal IgA plasma cells derive from peritoneal B1 cells in a T-cell independent fashion33,34. However, the clinical observation of strict gluten- and HLA-dependent appearance of anti-TG2 antibodies2,3 strongly suggests that T cells are implicated. Because the selection of high affinity B cells during affinity maturation is primarily dependent on the presentation of peptides to T cells35, evidence for T-cell help is further supported by the observed loss of affinity when mutations were removed (Supplementary Fig.8). In addition, we show here that B cells engineered to express an anti-TG2 BCR are able to process and present TG2-gliadin complexes resulting in activation of gluten-specific T cells derived from CD patients (Supplementary Fig.12). Based on these observations and findings, we favor a T-cell dependent model in the generation of the antibodies8.
Evidence suggests that TG2-specific ASCs in the intestinal mucosa are not renewed at a high rate. The cells are Ki-67neg, and the TG2-specific compartment is not replenished by circulating ASCs (0 out of 1,93×10³±2,25×10³ IgA+ cells as assayed by ELISpot, 3 subjects tested). Long life span of TG2-specific ASCs appears to contribute more to the sustenance of this large cell population. Mucosal ASCs can be long-lived36,37, especially in the niche provided by the inflamed mucosa of CD patients38. Consistent with this, cultured duodenal biopsies secreted anti-TG2 IgA antibodies for several weeks (Supplementary Fig.13).
The presence of TG2-specific IgM plasma cells (Fig.1 and Supplementary Fig.1) suggests one possible pathogenic role for anti-TG2 antibodies. Unlike IgA, IgM can activate complement via the classical pathway and may thus contribute to CD inflammation39, especially in IgA-deficient patients40. TG2-specific B cells may further play an essential role in the pathogenesis of CD by acting as APCs for the anti-gluten T cell response. Curtailing of this amplification loop could represent a novel strategy for treatment of CD.
In conclusion, this study provides the first comprehensive dissection of a mucosal antibody response directly from the effector compartment. It reveals several previously unrecognized aspects of the anti-TG2 autoantibody response in CD, primarily the abundance and mutation profile of TG2-specific plasma cells, and the limited inhibitory activity of the antibodies. In a broader context, this study presents novel methodologies to study autoimmune responses, especially those where plasma cell activity in the affected organ is thought to be relevant such as rheumatoid arthritis and multiple sclerosis.
ONLINE METHODS
Patient material
Subjects with untreated or treated (on a gluten-free diet) CD and controls participated by donating blood or small intestinal biopsies. CD diagnosis was established according to the American Gastroenterology Association guidelines including clinical history, anti-TG2 serological testing, HLA typing and histological analysis of small intestinal biopsy. Small intestinal biopsy specimens were obtained by esophagogastroduodenoscopy and forceps sampling from the duodenum. All subjects gave written informed consent. Ethical approval was obtained from the Regional Ethics Committee in South-Eastern Norway (application S-97201).
Preparation of intestinal single cell suspensions
Single cell suspensions from small intestine biopsy specimens were prepared as previously reported37.
Antigens
His-tagged recombinant human TG2 was either expressed in E.coli as previously reported43 or in Sf9 insect cells by Phadia GmbH. Gliadin and BSA were obtained from Sigma and Pierce, respectively. Biotin conjugation was performed with Sulfo-NHS-LC-biotin (Pierce) as per the manufacturer’s protocol.
Immunofluorescence on intestinal biopsy cryosections
Biopsy specimens were embedded in OCT and snap-frozen in liquid nitrogen upon collection. 4 μm thick biopsy cryosections were cut and stored at −70°C. Sections were thawed for 15 min at RT, rinsed in PBS, incubated with primary reagents in PBS-1.2%BSA for 45 min at RT, extensively rinsed, incubated with secondary labeled reagents in PBS-12%BSA for 30 min at RT, and finally rinsed and mounted. Primary reagents were: mouse anti-CD138 (1:25, AbD Serotec), recombinant human biotinylated TG2 or biotinylated BSA (5 μg/ml), mouse anti-Ki-67 (1:10, MIB-1 clone, BD). Labeled reagents were: streptavidin-cy2 and -cy3 (Amersham Biosciences), anti-mouse-cy3 (Southern Biotech), anti-IgA-FITC (Dako), anti-IgM-FITC (Southern Biotech). DAPI was used to counterstain nuclei.
Single cell PCR, production and characterization of recombinant hmAbs
PCR amplification of antibody genes from single cells, cloning into expression vector, production and purification of IgG recombinant hmAbs in 293 cells was performed as described before44 and as reported in Supplementary Methods. In order to exclude the possibility that hmAbs were isolated which were reactive to bacterial contaminants present in the E.coli-derived TG2 preparation, ELISA assays with hmAbs were performed with a highly pure recombinant antigen expressed in Sf9 insect cells. Characterization of antibody reactivity and specificity was performed as reported in Supplementary Methods.
TG2-mediated crosslinking of antibodies
The hmAb 679-14-E06 was engineered and expressed as IgG1, IgD, IgM and IgA1. The different isotypes were produced by exchanging the gene encoding the γ1 chain with those encoding the δ, μ and α1 chains, respectively. The latter genes were obtained either by PCR from human PBMCs or as synthetic genes (Genscript). In the tailpiece of the μ chain, the mutation C575S was introduced to allow expression of monomeric IgM45. The hmAbs 693-1-F06 (TG2-specific) and 693N-2-F02 (TG2-negative) were also engineered as IgD. Engineered hmAbs were expressed and purified by either protein A, G or L, and their reactivity to TG2 confirmed by ELISA. For the crosslinking experiments, the hmAb 679-14-E06 expressed as human IgA1, IgG1, IgM or IgD was incubated with TG2 at 37 °C in 50 mM Tris-HCl, pH 7.4, and after 30 min buffer supplemented either with or without CaCl2 was added. The reaction was allowed to proceed for 30 min at 37 °C before quenching with SDS-PAGE loading buffer. The samples were analysed by SDS-PAGE and western blotting using a mix of antibodies specific for the different heavy/light chain isotypes. In a set of experiments, after detection the membrane was stripped and re-probed with CUB7402 to reveal TG2.
Transglutaminase 2 enzymatic activity in vitro
TG2 produced in E.coli (0.15μg) was preincubated with each hmAb or CUB7402 (1.35μg) and PBS in a final volume of 6.8μl, for 10min at RT. Transglutaminase substrates and Ca2+-containing reaction buffer was then added to give final concentrations of 0.015μg/μl TG2, 0.135μg/ul hmAb, 15μM FITC-DQ2,5-glia-α2EQ (FITC-Ahx-PQPELPYPQPQLPY) and 150μM 5-BP (5-biotinamido-pentylamine) in 100mM TrisHCl pH 7.2, 5mM CaCl2. In one set of experiments, the hmAb was not preincubated with TG2 and mixed to the enzyme directly in Ca2+-containing reaction buffer. After incubation at 37°C, the unmodified peptide and deamidated and transamidated products were quantified by capillary electrophoresis (Agilent) using laser induced fluorescence detection (Picometrics) as previously described43 with the following modifications: the reaction products were baseline separated by micellar electrokinetic chromatography capillary electrophoresis using 64mM borate pH 9.3, 20mM SDS as running buffer. Samples were diluted in running buffer, injected by pressure and run from the anode to the cathode (20kV, positive mode).
In vitro T/B-cell cooperation assay
Generation of TCR and DQ2.5-IgD transfectants, production of TG2-gluten peptide complexes and T-cell activation assays are described in detail in Supplementary Methods. Briefly, we engineered a T-cell line to express human CD4 and the TCR derived from a DQ2.5-glia-α2-reactive T-cell as previously described46. We engineered the A20 murine B-cell line to express the HLA-DQ2.5 as well as an IgD B-cell receptor based on the sequence of the TG2-specific hmAb 679-14-E06.
We prepared complexes between TG2 and either 33mer peptide containing the DQ2.5-glia-α2 epitope (LQLQPFPQPQLPYPQPQLPYPQPQLPYPQPQPF) or the γI control peptide harbouring the DQ2.5-glia-γ1 epitope (pyroglu-PQQPQQSFPQQQRP), and in vitro T/B-cell cooperation assays were performed by culturing A20 B-cells with TCR transfectants in presence of different complexes and conditions, and measuring murine IL-2 secretion by ELISA as readout.
Supplementary Material
Acknowledgments
We thank Eckart Mummert (Phadia GmbH) for providing recombinant human TG2 produced in Sf9 insect cells, Chaitan Khosla and Laszlo Fesus for providing plasmids encoding His-tagged recombinant TG2 for expression in E.coli, Melinda Ráki for help in sample collection and immunofluorescence analysis, Jørgen Jahnsen for providing biopsy samples from two subjects, and staffs at the LIIPAT laboratory and the flow cytometry core facility (both at Oslo University Hospital - Rikshospitalet) for technical assistance. This work was supported by the Marie Curie Research and Training Network (European Commission) contract MRTN-CT-2006-036032, the European Research Council and grants from the Research Council of Norway to L.M.S., and grants NIH/NIAID U19 AI082724-01, NIH/NIAID R01 AI76585-03 and NIH/NIAID HHSN266200500026C to P.C.W. We thank M. Shlomchik and B. Jabri for discussion and critical reading of the manuscript.
Abbreviations
- CD
celiac disease
- TG2
transglutaminase 2
- ASC
antibody-secreting cell
- GFD
gluten-free diet
- hmAb
human monoclonal antibody
- EMA
endomysial antibody
- BCR
B-cell receptor
- SHM
somatic hypermutation
- GC
germinal center
- APC
antigen-presenting cell
Footnotes
Authors’ contribution
R.D. conceived the study, performed experiments, analyzed data, and wrote the manuscript. L.M., N-Y.Z., J.S., M.M., J-H.L., M.H., R.I., M.F.d.P and S-W.Q. performed experiments. K.E.A.L. recruited study subjects and provided materials. P.C.W. supervised the study, analyzed data and revised the manuscript. L.M.S. conceived and supervised the study and wrote the manuscript.
Additional methods
Detailed methods are reported in the Supplementary Information.
References
- 1.Dieterich W, et al. Identification of tissue transglutaminase as the autoantigen of celiac disease. Nat Med. 1997;3:797–801. doi: 10.1038/nm0797-797. [DOI] [PubMed] [Google Scholar]
- 2.Sulkanen S, et al. Tissue transglutaminase autoantibody enzyme-linked immunosorbent assay in detecting celiac disease. Gastroenterology. 1998;115:1322–1328. doi: 10.1016/s0016-5085(98)70008-3. [DOI] [PubMed] [Google Scholar]
- 3.Bjorck S, Brundin C, Lorinc E, Lynch KF, Agardh D. Screening detects a high proportion of celiac disease in young HLA-genotyped children. J Pediatr Gastroenterol Nutr. 2010;50:49–53. doi: 10.1097/MPG.0b013e3181b477a6. [DOI] [PubMed] [Google Scholar]
- 4.Wrammert J, et al. Rapid cloning of high-affinity human monoclonal antibodies against influenza virus. Nature. 2008;453:667–671. doi: 10.1038/nature06890. [DOI] [PMC free article] [PubMed] [Google Scholar]
- 5.Sollid LM. Coeliac disease: dissecting a complex inflammatory disorder. Nat Rev Immunol. 2002;2:647–655. doi: 10.1038/nri885. [DOI] [PubMed] [Google Scholar]
- 6.Molberg O, et al. Tissue transglutaminase selectively modifies gliadin peptides that are recognized by gut-derived T cells in celiac disease. Nat Med. 1998;4:713–717. doi: 10.1038/nm0698-713. [DOI] [PubMed] [Google Scholar]
- 7.van de Wal Y, et al. Selective deamidation by tissue transglutaminase strongly enhances gliadin-specific T cell reactivity. J Immunol. 1998;161:1585–1588. [PubMed] [Google Scholar]
- 8.Sollid LM, Molberg O, McAdam S, Lundin KE. Autoantibodies in coeliac disease: tissue transglutaminase--guilt by association? Gut. 1997;41:851–852. doi: 10.1136/gut.41.6.851. [DOI] [PMC free article] [PubMed] [Google Scholar]
- 9.Dieterich W, et al. Cross linking to tissue transglutaminase and collagen favours gliadin toxicity in coeliac disease. Gut. 2006;55:478–484. doi: 10.1136/gut.2005.069385. [DOI] [PMC free article] [PubMed] [Google Scholar]
- 10.Rostom A, et al. The diagnostic accuracy of serologic tests for celiac disease: a systematic review. Gastroenterology. 2005;128:S38–46. doi: 10.1053/j.gastro.2005.02.028. [DOI] [PubMed] [Google Scholar]
- 11.Salmi TT, et al. Endomysial antibody-negative coeliac disease: clinical characteristics and intestinal autoantibody deposits. Gut. 2006;55:1746–1753. doi: 10.1136/gut.2005.071514. [DOI] [PMC free article] [PubMed] [Google Scholar]
- 12.Marzari R, et al. Molecular dissection of the tissue transglutaminase autoantibody response in celiac disease. J Immunol. 2001;166:4170–4176. doi: 10.4049/jimmunol.166.6.4170. [DOI] [PubMed] [Google Scholar]
- 13.Di Niro R, et al. Rapid generation of rotavirus-specific human monoclonal antibodies from small-intestinal mucosa. J Immunol. 2010;185:5377–5383. doi: 10.4049/jimmunol.1001587. [DOI] [PubMed] [Google Scholar]
- 14.Benckert J, et al. The majority of intestinal IgA+ and IgG+ plasmablasts in the human gut are antigen-specific. J Clin Invest. 2011;121:1946–1955. doi: 10.1172/JCI44447. [DOI] [PMC free article] [PubMed] [Google Scholar]
- 15.Mei HE, et al. Blood-borne human plasma cells in steady state are derived from mucosal immune responses. Blood. 2009;113:2461–2469. doi: 10.1182/blood-2008-04-153544. [DOI] [PubMed] [Google Scholar]
- 16.Meffre E, Wardemann H. B-cell tolerance checkpoints in health and autoimmunity. Curr Opin Immunol. 2008;20:632–638. doi: 10.1016/j.coi.2008.09.001. [DOI] [PubMed] [Google Scholar]
- 17.Tiller T, et al. Autoreactivity in human IgG+ memory B cells. Immunity. 2007;26:205–213. doi: 10.1016/j.immuni.2007.01.009. [DOI] [PMC free article] [PubMed] [Google Scholar]
- 18.Elkon K, Casali P. Nature and functions of autoantibodies. Nat Clin Pract Rheumatol. 2008;4:491–498. doi: 10.1038/ncprheum0895. [DOI] [PMC free article] [PubMed] [Google Scholar]
- 19.Kurppa K, et al. Celiac disease without villous atrophy in children: a prospective study. J Pediatr. 2010;157:373–380. doi: 10.1016/j.jpeds.2010.02.070. [DOI] [PubMed] [Google Scholar]
- 20.Green PH. The many faces of celiac disease: clinical presentation of celiac disease in the adult population. Gastroenterology. 2005;128:S74–78. doi: 10.1053/j.gastro.2005.02.016. [DOI] [PubMed] [Google Scholar]
- 21.Scheid JF, et al. Broad diversity of neutralizing antibodies isolated from memory B cells in HIV-infected individuals. Nature. 2009;458:636–640. doi: 10.1038/nature07930. [DOI] [PubMed] [Google Scholar]
- 22.MacLennan IC, et al. Extrafollicular antibody responses. Immunol Rev. 2003;194:8–18. doi: 10.1034/j.1600-065x.2003.00058.x. [DOI] [PubMed] [Google Scholar]
- 23.Chan TD, et al. Antigen affinity controls rapid T-dependent antibody production by driving the expansion rather than the differentiation or extrafollicular migration of early plasmablasts. J Immunol. 2009;183:3139–3149. doi: 10.4049/jimmunol.0901690. [DOI] [PubMed] [Google Scholar]
- 24.Boursier L, Dunn-Walters DK, Spencer J. Characteristics of IgVH genes used by human intestinal plasma cells from childhood. Immunology. 1999;97:558–564. doi: 10.1046/j.1365-2567.1999.00843.x. [DOI] [PMC free article] [PubMed] [Google Scholar]
- 25.He B, et al. Intestinal bacteria trigger T cell-independent immunoglobulin A(2) class switching by inducing epithelial-cell secretion of the cytokine APRIL. Immunity. 2007;26:812–826. doi: 10.1016/j.immuni.2007.04.014. [DOI] [PubMed] [Google Scholar]
- 26.Goodnow CC, Vinuesa CG, Randall KL, Mackay F, Brink R. Control systems and decision making for antibody production. Nat Immunol. 2010;11:681–688. doi: 10.1038/ni.1900. [DOI] [PubMed] [Google Scholar]
- 27.Shokat KM, Goodnow CC. Antigen-induced B-cell death and elimination during germinal-centre immune responses. Nature. 1995;375:334–338. doi: 10.1038/375334a0. [DOI] [PubMed] [Google Scholar]
- 28.Anderson SM, et al. Taking advantage: high-affinity B cells in the germinal center have lower death rates, but similar rates of division, compared to low-affinity cells. J Immunol. 2009;183:7314–7325. doi: 10.4049/jimmunol.0902452. [DOI] [PMC free article] [PubMed] [Google Scholar]
- 29.Parker DC. Stimulation of mouse lymphocytes by insoluble anti-mouse immunoglobulins. Nature. 1975;258:361–363. doi: 10.1038/258361a0. [DOI] [PubMed] [Google Scholar]
- 30.Batista FD, Neuberger MS. Affinity dependence of the B cell response to antigen: a threshold, a ceiling, and the importance of off-rate. Immunity. 1998;8:751–759. doi: 10.1016/s1074-7613(00)80580-4. [DOI] [PubMed] [Google Scholar]
- 31.Esposito C, et al. Anti-tissue transglutaminase antibodies from coeliac patients inhibit transglutaminase activity both in vitro and in situ. Gut. 2002;51:177–181. doi: 10.1136/gut.51.2.177. [DOI] [PMC free article] [PubMed] [Google Scholar]
- 32.Toellner KM, et al. Low-level hypermutation in T cell-independent germinal centers compared with high mutation rates associated with T cell-dependent germinal centers. J Exp Med. 2002;195:383–389. doi: 10.1084/jem.20011112. [DOI] [PMC free article] [PubMed] [Google Scholar]
- 33.Kroese FG, Butcher EC, Stall AM, Herzenberg LA. A major peritoneal reservoir of precursors for intestinal IgA plasma cells. Immunol Invest. 1989;18:47–58. doi: 10.3109/08820138909112226. [DOI] [PubMed] [Google Scholar]
- 34.Macpherson AJ, et al. A primitive T cell-independent mechanism of intestinal mucosal IgA responses to commensal bacteria. Science. 2000;288:2222–2226. doi: 10.1126/science.288.5474.2222. [DOI] [PubMed] [Google Scholar]
- 35.Victora GD, et al. Germinal center dynamics revealed by multiphoton microscopy with a photoactivatable fluorescent reporter. Cell. 2010;143:592–605. doi: 10.1016/j.cell.2010.10.032. [DOI] [PMC free article] [PubMed] [Google Scholar]
- 36.Hapfelmeier S, et al. Reversible microbial colonization of germ-free mice reveals the dynamics of IgA immune responses. Science. 2010;328:1705–1709. doi: 10.1126/science.1188454. [DOI] [PMC free article] [PubMed] [Google Scholar]
- 37.Mesin L, Di Niro R, Thompson KM, Lundin KE, Sollid LM. Long-lived plasma cells from human small intestine biopsies secrete immunoglobulins for many weeks in vitro. J Immunol. 2011;187:2867–2874. doi: 10.4049/jimmunol.1003181. [DOI] [PubMed] [Google Scholar]
- 38.Radbruch A, et al. Competence and competition: the challenge of becoming a long-lived plasma cell. Nat Rev Immunol. 2006;6:741–750. doi: 10.1038/nri1886. [DOI] [PubMed] [Google Scholar]
- 39.Halstensen T, Hvatum M, Scott H, Fausa O, Brandtzaeg P. Association of subepithelial deposition of activated complement and immunoglobulin G and M response to gluten in celiac disease. Gastroenterology. 1992;102:751–759. doi: 10.1016/0016-5085(92)90155-r. [DOI] [PubMed] [Google Scholar]
- 40.Borrelli M, et al. High density of intraepithelial gammadelta lymphocytes and deposits of immunoglobulin (Ig)M anti-tissue transglutaminase antibodies in the jejunum of coeliac patients with IgA deficiency. Clin Exp Immunol. 2010;160:199–206. doi: 10.1111/j.1365-2249.2009.04077.x. [DOI] [PMC free article] [PubMed] [Google Scholar]
- 41.Duty JA, et al. Functional anergy in a subpopulation of naive B cells from healthy humans that express autoreactive immunoglobulin receptors. J Exp Med. 2009;206:139–151. doi: 10.1084/jem.20080611. [DOI] [PMC free article] [PubMed] [Google Scholar]
- 42.Koelsch K, et al. Mature B cells class switched to IgD are autoreactive in healthy individuals. J Clin Invest. 2007;117:1558–1565. doi: 10.1172/JCI27628. [DOI] [PMC free article] [PubMed] [Google Scholar]
- 43.Stamnaes J, Fleckenstein B, Sollid LM. The propensity for deamidation and transamidation of peptides by transglutaminase 2 is dependent on substrate affinity and reaction conditions. Biochim Biophys Acta. 2008;1784:1804–1811. doi: 10.1016/j.bbapap.2008.08.011. [DOI] [PMC free article] [PubMed] [Google Scholar]
- 44.Smith K, et al. Rapid generation of fully human monoclonal antibodies specific to a vaccinating antigen. Nat Protoc. 2009;4:372–384. doi: 10.1038/nprot.2009.3. [DOI] [PMC free article] [PubMed] [Google Scholar]
- 45.Sitia R, et al. Developmental regulation of IgM secretion: the role of the carboxy-terminal cysteine. Cell. 1990;60:781–790. doi: 10.1016/0092-8674(90)90092-s. [DOI] [PubMed] [Google Scholar]
- 46.Qiao SW, et al. Posttranslational modification of gluten shapes TCR usage in celiac disease. J Immunol. 2011;187:3064–3071. doi: 10.4049/jimmunol.1101526. [DOI] [PubMed] [Google Scholar]
Associated Data
This section collects any data citations, data availability statements, or supplementary materials included in this article.