

Synopsis
In 2005, 1.6 million people were estimated to be living with limb loss and by 2050, the rate is expected to double to 3.6 million in the United States. (1) Past data has shown the rates of dysvascular amputations were on the rise. However, recent studies looking at single diseases of Peripheral Arterial Disease (PAD) and Diabetes Mellitus commonly associated with dysvascular related amputations show that these conditions are now on the decline. We believe that it may not be a single disease process but rather the cumulative illness burden that is leading to amputations. In addition to etiology, age, gender, and race continue to play a role in limb loss. Limb loss is more common among older individuals, men, and non-whites. Trauma and cancer related amputations are on the decline and congenital amputations are unchanged in rates.
Keywords: Amputation, limb loss, dysvascular, trans-femoral, trans-tibial
Despite advancements in medicine and emphasis on disease prevention, limb loss continues to be prevalent in our society. In 2005, 1.6 million people were estimated to be living with limb loss and by 2050, the rate is expected to double to 3.6 million in the United States. (1) Limb loss can be sub-divided into two types, major and minor limb loss. Major limb loss is a trans-humeral, trans-radial, trans-femoral, or trans-tibial amputation. Minor limb loss is defined as an amputation of the hand, digits, toes or at the mid-foot level. (2) The incidence of amputations most commonly relates to vascular conditions, trauma, malignancy, and congenital deficiency. (3). Between the 1980's and 1990's the amputation rates increased among dysvascular patients and declined in trauma and cancer (Table 1). Contemporary studies have shown a reduction of rates in subsets of those with diabetes and peripheral arterial disesase (PAD). The purpose of this review is to highlight epidemiology of limb loss and current trends.
Table 1. Change in Rates of Amputations 1988 – 1997 HCUP.
| Year | Dysvascular | Trauma | Cancer |
|---|---|---|---|
| 1988 | 38.3 | 11.37 | 0.62 |
| 1996 | 46.19 | 5.86 | 0.35 |
| Yearly Change | +3% | -5.6% | -4.7% |
| Overall Change | +27% | -50% | -43% |
Rates: Per 100,000 live births
Source: Adjusted Annual Rates of Limb Loss and Limb Deficiency Per 100,000 US population 1988-1996 (Dillingham TR, Pezzin L. MacKenzie E. Limb Amputation and Limb Deficiency: Epidemiology and Recent Trends in the United States. South Med J. 2002; 95(8): 875-883)
Dysvascular
Nationally representative hospital discharge data from 1988 to 1996 from the Healthcare Cost and Utilization project (HCUP) showed that overall, dysvascular related amputations were on the rise as reported by Dillingham, Pezzin, and MacKenzie in 2002. (3). Increased rates were evident in levels associated with considerable functional impairments such as the foot, transtibial, and transfemoral levels. Incidence rates of dysvascular amputations increased with age in both sexes and racial groups when comparing African Americans to non-African Americans. Males underwent amputations at a higher rate compared to females. African Americans underwent amputations at higher rates than non-African Americans (Figure 1). The pattern was noted to be markedly higher among African Americans and women over the age of 85 years. African Americans over the age of 85 were 11.7 times more likely than their middle aged counterparts to undergo an amputation due to a dysvascular etiology. African Americans were also more likely to have amputations at higher levels than whites (3). A similar effect was noted among women undergoing dysvascular amputations over the age of 85, with a relative risk ratio of 12 compared to middle- age women (3).
Figure 1. Age- and Gender- Standardized Rates of Dysvascular Amputations, by Race.
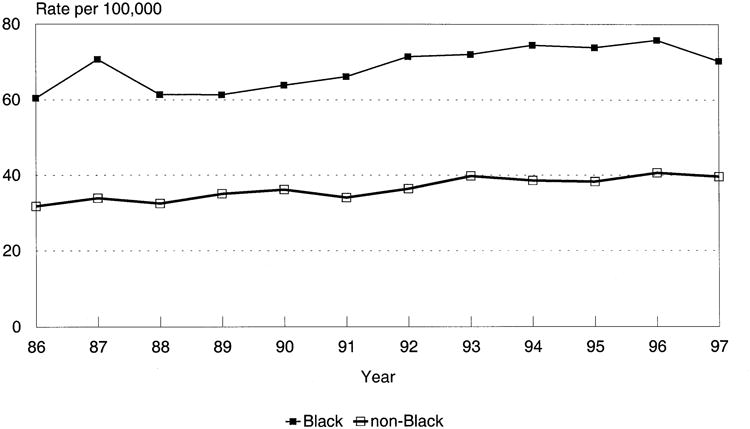
Source: Dillingham TR, Pezzin LE. MacKenzie E. Racial Differences in the Incidence of Limb Loss Secondary to Peripheral Vascular Disease: A Population-Based study. Arch Phys Med Rehabil. 2002; 83: 1252-1257
Diabetes
Diabetes, a common co-morbidity associated with dsyvascular disease, affects 25.8 million people (5). Those with diabetes mellitus have a 10 times higher risk of amputation compared to those without diabetes (6). Racial disparities continue to play a role in the course of diabetes. In general, the risk of diagnosed diabetes was 18% higher among Asian Americans, 66% higher among Hispanics, and 77% higher among non-Hispanic blacks compared to non-Hispanic whites. (5). A review by Dillingham, Pezzin and MacKenzie revealed that research has shown that among those with diabetes, African Americans, Hispanics, and Native Americans are at a considerably higher risk for lower limb loss than white persons. (4)
One objective of Healthy People 2010 was to decrease the rate of lower extremity amputations among those with diabetes (7). In 2000, Healthy People 2010's goal was to decrease incidence of amputation among diabetics from 4.1/1,000 (2000) to 1.8/1000 (2010). (7,8) A summary of Healthy People 2010 revealed the rate of lower extremity amputations in persons with diabetes did in fact decline by 47% from 1997-1999 to 2005-2007. This was reflected in an incidence rate reduction from 6.6 per 1,000 in 1997 to 3.5 per 1,000 population in 2005 [age adjusted]. (7) Additionally, Females had a lower rate (2.2 per 1,000 population [age adjusted]) of lower extremity amputations than males (4.8 per 1,000) in 2005-2007. (7) Due to the decline in rate of amputations among diabetics and it's positive implications on health policy, this objective is maintained as a goal for Healthy People 2020. (7)
Goldberg et. al (2012) evaluated the effect of the Healthy People 2010 initiative in an enhanced sample of all diabetic patients from the Medicare 5% sample during 1999-2006. They found that the amputation rate declined among diabetics. However, the incidence of amputations among diabetics with greater than three co-morbidities and end stage renal disease increased from 1999-2006 (figure 2). (8) This offers perspective that perhaps it is not just single co-morbid conditions but rather the combined illness burden from multiple conditions that leads to amputation. Interestingly, Eggers et al. (1999) reported from Medicare data that patients with Diabetes and ESRD had a 10-fold greater risk of amputation than those with DM without ESRD. (9) This suggests that greater illness burden has serious implications to health care policy beyond prevention of single diseases.
Figure 2. Temporal Trends of amputations in diabetic individuals by race and co-morbidity status.

Temporal trends of amputations in diabetic individuals (above-knee, below-knee, and minor),by race and comorbidity status. ESRD, End-stage renal disease.
Source: Goldberg et al. The effect of risk and race on lower extremity amputations among Medicare diabetic patients. Society for Vascular Surgery. May 29, 2012.
Within the veteran population, Tseng et al (2011) found that improvements in the early detection and diagnosis of diabetes increased the overall diabetic population that was identified during a time period. This increased denominator serves to lower the rate of lower extremity amputations. However, Tseng and colleagues further demonstrated with their study conducted within VHA system in New Jersey (2000-2004) that after adjusting for population characteristics and risk factors associated with amputations, there was a persistent decrease in the amputation rates from 7/1,000 to 4.6/1,000 (reflecting a 34% decrease) among diabetics. Of these amputations, the rates of transfemoral decreased more (49% reduction) than transtibial (19% reduction). One potential contributor to these decreasing rates could be the implementation of a universal program for foot screening within the VHA. (10) In contrast to this study at the VHA, Healthy People 2010 did not note any changes in the percentage of persons with diabetes who received annual foot examinations. (7)
In 2009, hospital costs associated with amputation totaled more than $8.3 billion in the United States. (26) Kurichi, Vogel, Kwong et al. conducted a study in the VHA to evaluate the factors associated with these costs. Amputations that were associated with systemic sepsis, co-morbidities of arrhythmia, chronic blood loss anemia, fluid and electrolyte disorders, and weight loss were associated with both higher total inpatient costs and longer lengths of stay. Amputations due to certain chronic conditions (osteomyelitis and hypertension) were associated with both lower inpatient costs and shorter lengths of stay. (27) These associations are logical since amputations related to osteomyelitis are often trauma related occurring in younger patients, and hypertension is highly prevalent and typically benign when compared to the conditions associated with higher costs and longer hospitalizations.
Peripheral Arterial Disease
Peripheral Arterial Disease (PAD) when in its end stage can lead to lower extremity amputations. (11). PAD and lower extremity amputation rates were evaluated among elderly using Medicare part A beneficiary data from 2000-2008 by Jones, Patel, Dai et al. (2012). They found a decline in the overall annual rate of amputations in patients with PAD from 7,258/100,000 to 5,790/100,000 among patients with PAD over that 8 year period. (12) Male sex, black race, diabetes mellitus, and renal disease were all independent predictors of lower extremity amputation in this PAD population. (12) Geographical variation was also found to play a role in the number of amputations, as lower extremity amputations were more often performed in East South Central and West South Central regions and less in the Mid-Atlantic when compared to South Atlantic. (12)
Limitations remain in the research on peripheral vascular disease and limb loss. Ephraim, Dillingham, Sector et al. attribute some of these limitations to difficulties identifying persons with dysvacular disease by using ICD-9 codes. Due to variations in interpreting these codes, the sample selections vary across studies making comparisons across them difficult. (13)
Re-amputation Rates
Re-amputation and mortality rates are important to evaluate when considering rates of amputations. In 1980, Ebskov and Josephsen reported from the 1972 Danish Amputation Register (DAR) that the incidence of ipsilateral re-amputation is high in the immediate postoperative period with 10.4% after one month, 16.5% after three months, and 18.8% after six months. After four years, the incidence was 23.1%. However, the contra-lateral limb's risk of amputation is constantly present, with an incidence of 11.9% within one year, 17.8% after two years, 27.2% after three years, and 44.3% after four years. (14) Similarly, Dillingham, Pezzin and Shore evaluated Medicare beneficiaries data from Centers for Medicare and Medicaid Services in 1996 that underwent lower limb amputations and evaluated the rates of re-amputation, mortality and health care costs within a 12 month period after initial amputation. They found that 26% required a subsequent amputation procedure. Re-amputations were commonly seen among diabetics and progression occurred most frequently (34.5%) among persons with an initial foot or ankle amputations. Those with index amputations at transtibial and transfemoral levels experienced significantly lower rates of re-amputations, suggesting that higher levels may provide the highest probability of successful wound healing when compared with either foot or ankle amputations. (15)
Trauma
Trauma is the second most common etiology of amputations yet occurs at about one eighth the frequency as dysvascular amputations overall. Dillingham, Pezzin, MacKenzie examined population based hospital discharge data for Maryland from 1979 through 1993. The incidence of major amputations declined 3.4% annually and for minor amputations 4.8% annually (Table 2). (16) Although PAD and diabetes were most commonly associated with lower limb amputations, upper limb amputations accounted for the vast majority (68.6%) of all trauma-related amputations. (3) The incidence rates were lower in 1996 relative to 1988 with the exception of (through-knee, pelvic, wrist, trans-radial, and shoulder amputations). (3) The most notable reduction was the incidence of hand amputations. The authors attributed this downward trend due to potential changes in aggressiveness of both reconstructive (limb salvage) surgery and re-implantation of severed digits. (3) This decline could also be attributed to the improvements in occupational safety standards and the reduction in the proportion of the workforce operating heavy machinery and working in factories. The decline in rates of minor amputations could be partially due to increasing use of outpatient care for such severed digits such that these cases are not represented in hospital discharge data. (3)
Table 2. TRAUMATIC AMPUTATION (Rates per 100,000 population).
| Incidence 1979 | Incidence 1993 | ||
|---|---|---|---|
| Major Amputations | 992 | 1.88 | 1.07 (38% decline) |
| Minor Amputation | 5077 | 10.8 | 4.7 (48% decline) |
| Total | 6069 | 12.7 | 5.8 |
Source: Dillingham TR, Pezzin LE, MacKenzie EJ. Incidence, Acute Care Length of Stay, and Discharge to Rehabilitation of Traumatic Amputee Patients: An epidemiologic Study. Arch Phys Med Rehabil. 1998; 79: 279-287
Gender and race play a role in traumatic amputations. (16, 17, 18) Males were at a significantly higher risk of trauma-related amputations than females, 2:1. (16, 17, 18) Ebskov, Schroeder, Holstein report two peaks in the age distribution for male traumatic amputations 20-29 and 70-79 and among females 70-79. The younger age group could be attributed to occupational and automobile accidents and the later peak could be attributed to falls. (16, 17) Racial differences were again noted between blacks and non-blacks. (16, 17) Dillingham, Pezzin, MacKenzie reported that blacks over the age of 35 were at higher risk for trauma related amputations. (4)
Another population that has suffered from traumatic amputations is the post war returning veterans. Often the veterans are returning with poly-trauma and thus necessitating comprehensive care. An estimated 6,000 amputations occurred during the Vietnam War. (19) As of December 2012, the Congressional Research Service reports the number of wounded soldiers from Operation Iraqi Freedom (OIF) and Operation Enduring Freedom (OEF) was 18, 230 and among these injured soldiers, there were 1, 715 amputations. (20). Pasquina, Scoville, Belnap et al report that 21% of these veterans had upper limb amputations, and over 23% lost more than one limb. (21) The majority of these service members sustained multiple other injuries. Fully 50% of these soldiers with amputations had a documented traumatic brain injury, vision, or hearing deficit. In addition, these amputees suffered from complex fractures, soft tissue wounds, paralysis from peripheral nerve injuries or spinal cord injury. There was a high rate of mental health problems further compounding their recovery and rehabilitation programs. (21) A survey conducted among veterans from OIF/OEF and Vietnam by Reiber, McFarland, Hubbard et al in 2010 revealed that the veterans from both conflicts experienced limb loss at similar locations with the most common being transtibial, transfemoral, and transradial. There was however, a slight increase in transradial and partial foot amputations was found in the veterans from the OIF/OEF conflict. (22)
Cancer
Limb loss due to cancer in the United States is rare compared to dysvascular causes, occurring at less than one-one hundredth the rate of dysvascular amputations. In the United States, primary malignant bone tumors are 6% of all cancers in children under the age of twenty. (23) Osteosarcoma and Ewings sarcoma are the two predominant bone malignancies which affect the long bones and central axis. (23) Dillingham, Pezzin, MacKenzie found that most cancer related amputations were in the lower extremity, with transfemoral and transtibial amputations accounting for one third, with no differences in race or gender noted. (3) The decline in the rates of amputation due to malignancies of the limbs could be due to advancements in early detection and management of malignancies allowing for surgeons to perform more limb salvage techniques as an alternative to amputations. (23)
Congenital Deficiency
Congenital limb deficiency may be due to genetic variation, exposure to an environmental teratogen, or due to gene-environment interactions. (24) Birth prevalence rates ranged from 3.5 per 10,000 births (including pregnancy terminations) to 7.1 per 10,000 births. (24) The birth prevalence of limb deficiency in children with major congenital anomalies was 12.9 per 10,000 births. (25) Analysis of the HCUP data by Dillingham, Pezzin, and MacKenzie revealed that the incidence of congenital deficiencies accounted for 0.8% of all limb-loss related discharges, which remained stable over the 10 year period. (3) Upper limb defects occurred more commonly than lower limb defects. (24) Of these, longitudinal hand reductions were most frequent, accounting for 46.4% of upper-limb anomalies and longitudinal toe reduction was the most common among newborns. (24) There were similar of rates across different countries with the rate of congenital limb deficiencies falling within 2 to 7 per 10,000 live births. (24)
Summary
Literature from the last two decades demonstrates the rate of amputations among dysvascular patients was 8 times greater than those with trauma related amputations. However, recent studies have shown a reduction of rates in subsets of those with diabetes and peripheral arterial disease (PAD), which may be attributed to early detection of conditions and preventive programs. Additionally, the role of combined illness burden may have a stronger impact on the risk of amputation compared to single disease processes. Being cognizant of the new trends in rates of amputations and its implications will play an integral role in optimizing coordinated health care.
Key Points.
In 1996, incidence of amputations most commonly occurred due to vascular conditions, trauma, malignancy, and congenital deficiency.
Dsyvascular amputation rates were 8 times greater than trauma-related in 1996.
The number of amputations among diabetics are declining but the number of diabetics are increasing due to early diagnosis
The number of amputations among elderly with Peripheral Arterial Disease (PAD) is declining
Combined illness burden of multiple co-morbidities increases the risk of amputations
Males are at higher risk for dysvascular and trauma-related amputations than females
Racial disparities continue to play a role in dysvascular amputation rates with certain groups, African Americans, Hispanic Americans, and Native Americans having the highest rates
Trauma and cancer related amputations are on the decline
Acknowledgments
Partially supported by grants 2R42HD069067-02 (TRD) and HD042588R01 (MGS)
Footnotes
Publisher's Disclaimer: This is a PDF file of an unedited manuscript that has been accepted for publication. As a service to our customers we are providing this early version of the manuscript. The manuscript will undergo copyediting, typesetting, and review of the resulting proof before it is published in its final citable form. Please note that during the production process errors may be discovered which could affect the content, and all legal disclaimers that apply to the journal pertain.
Contributor Information
P Varma, Email: priya.varma@uphs.upenn.edu, University of Pennsylvania Department of PM&R, 1800 Lombard St, 1st floor, Philadelphia, PA 19146.
M.G. Stineman, Email: mstinema@exchange.upenn.edu, University of Pennsylvania Department of PM&R and Center for Clinical Epidemiology and Biostatistics, 423 Guardian Dr, 904 Blockley Hall, Philadelphia, PA 19104, Office: 215-898-6272, Fax: 215-573-2017.
T.R. Dillingham, Email: timothy.dillingham@uphs.upenn.edu, University of Pennsylvania, 1800 Lombard St, 1st floor, Philadelphia, PA 19146, Office: 215-893-2645, Fax: 215-893-2685.
References
- 1.Ziegler-Graham K, MacKenzie EJ, Ephraim PL, et al. Estimating the prevalence of limb loss in the United States: 2005 to 2050. Arch Phys Med Rehabil. 2008;89(3):422–9. doi: 10.1016/j.apmr.2007.11.005. [DOI] [PubMed] [Google Scholar]
- 2.Tseng CL, Helmer D, Rajan M, et al. Evaluation of regional variation in total, major, and minor amputation rates in a National Health-care System. International Journal for Quality in Health Care. 2007;19(6):368–76. doi: 10.1093/intqhc/mzm044. [DOI] [PubMed] [Google Scholar]
- 3.Dillingham TR, Pezzin L, MacKenzie E. Limb Amputation and Limb Deficiency: Epidemiology and Recent Trends in the United States. South Med J. 2002;95(8):875–883. doi: 10.1097/00007611-200208000-00018. [DOI] [PubMed] [Google Scholar]
- 4.Dillingham TR, Pezzin LE, MacKenzie E. Racial Differences in the Incidence of Limb Loss Secondary to Peripheral Vascular Disease: A Population-Based study. Arch Phys Med Rehabil. 2002;83:1252–1257. doi: 10.1053/apmr.2002.34805. [DOI] [PubMed] [Google Scholar]
- 5.National Diabetes Fact Sheet 2011. Retrieved June 3, 2013 from: http://www.cdc.gov/diabetes/pubs/pdf/ndfs_2011.pdf.
- 6.Carmona GA, Hoffmeyer P, Hermann FR, et al. Major lower limb amputations in the elderly observed over ten years: the role of diabetes and peripheral arterial disease. Diabetes and Metabolism. 2005;31(5):449–454. doi: 10.1016/s1262-3636(07)70215-x. [DOI] [PubMed] [Google Scholar]
- 7.CDC. Healthy People 2010; Final Review. Retrieved May, 15, 2013 from: http://www.cdc.gov/nchs/healthy_people/hp2010/hp2010_final_review.htm.
- 8.Goldberg JB, Goodney PP, Cronenwett JL, et al. The effect of risk and race on lower extremity amputations among Medicare diabetic patients. Journal of Vascular Surgery. 2012;56(6):1663–8. doi: 10.1016/j.jvs.2012.05.100. [DOI] [PMC free article] [PubMed] [Google Scholar]
- 9.Eggers PW, Ghodes D, Pugh J. Non-traumatic Lower Extremity Amputation in the End Stage Renal Disease Medicare Population. Kidney International. 1999;56:1524–1533. doi: 10.1046/j.1523-1755.1999.00668.x. [DOI] [PubMed] [Google Scholar]
- 10.Tseng CL, Rajan M, Miller DR, et al. Trends in initial lower extremity amputation rates among Veterans Health Administration health care Systems users from 2000-2004. Diabetes Care. 2011;34(5):1157–1163. doi: 10.2337/dc10-1775. [DOI] [PMC free article] [PubMed] [Google Scholar]
- 11.Norgren L, Hiatt WR, Dormandy JA, et al. Inter-Society Concensus for the Management of Peripheral Arterial Disease (TASC II) J Vasc Surg. 2007;45(Supplement S):S5–67. doi: 10.1016/j.jvs.2006.12.037. [DOI] [PubMed] [Google Scholar]
- 12.Jones WS, Patel MR, Dai D, et al. Temporal trends and geographic variation of lower-extremity amputation in patients with peripheral artery disease: results from U.S. Medicare 2000-2008. Journal of American College of Cardiology. 2012;60(21):2230–6. doi: 10.1016/j.jacc.2012.08.983. [DOI] [PMC free article] [PubMed] [Google Scholar]
- 13.Ephraim PL, Dillingham TR, Sector M, et al. Epidemiology of limb loss and congenital limb deficiency: a review of the literature. Arch Phys Med Rehabil. 2003;84(5):747–761. doi: 10.1016/s0003-9993(02)04932-8. [DOI] [PubMed] [Google Scholar]; Kurichi J, Stineman M, Kwong PL, et al. Assessing and Using Comorbidity Measures in Elderly Veterans with lower Extremity Amputations. Gerontology. 2007;53:255–259. doi: 10.1159/000101703. [DOI] [PMC free article] [PubMed] [Google Scholar]
- 14.Ebskov B, Josephson P. Incidence of reamputation and death after gangrene of the lower extremity. Prosthetics Orthotics International. 1980;4(2):77–80. doi: 10.3109/03093648009164567. [DOI] [PubMed] [Google Scholar]
- 15.Dillingham TR, Pezzin LE, Shore AD. Reamputation, mortality, and health care costs among persons with dysvascular lower-limb amputations. Arch Phys Med Rehabil. 2005;86(3):480–86. doi: 10.1016/j.apmr.2004.06.072. [DOI] [PubMed] [Google Scholar]
- 16.Dillingham TR, Pezzin LE, MacKenzie EJ. Incidence, Acute Care Length of Stay, and Discharge to Rehabilitation of Traumatic Amputee Patients: An epidemiologic Study. Arch Phys Med Rehabil. 1998;79:279–287. doi: 10.1016/s0003-9993(98)90007-7. [DOI] [PubMed] [Google Scholar]
- 17.Ebskov LB, Schroeder TV, Holstein PE. Epidemiology of leg amputations: the influence of vascular surgery. Br J Surg. 1994;81(11):1600–1603. doi: 10.1002/bjs.1800811111. [DOI] [PubMed] [Google Scholar]
- 18.Pohjolainen T, Alaranta H. Lower Limb amputations in Southern Finland 1984-1985. Prosthetics Orthotics International. 1988;12:9–18. doi: 10.3109/03093648809079386. [DOI] [PubMed] [Google Scholar]
- 19.Traumatic Amputations and Prosthetics. Veteran's Health Initiative. 2002 May; Retrieved June 18, 2013 from http://www.publichealth.va.gov/docs/vhi/traumatic_amputation.pdf.
- 20.Fischer H. Congressional Research Service Report. 2013 Feb; Retrieved May 18, 2013 from: http://www.fas.org/sgp/crs/natsec/RS22452.pdf.
- 21.Pasquina PF, Scoville CR, Belnap B, et al. Introduction: Developing a Combat Sysem of Care for the Combat Amputee. Retrieved May 10, 2013 from: https://ke.army.mil/bordeninstitute/published_volumes/amputee/CCAchapter01.pdf.
- 22.Reiber GE, McFarland LV, Hubbard S, et al. Servicemembers and veterna with major traumatic limb loss from Vietnam war and OIF/OEF conflicts: Survery methods, participants, and summary findings. Journal of Rehabilitation Research and Development. 2010;47:275–298. doi: 10.1682/jrrd.2010.01.0009. [DOI] [PubMed] [Google Scholar]
- 23.Nagarajan R, Neglia JP, Clohisty DR. Limb Salvage and Amputation in Survivors of Pediatric Lower Extremity Bone Tumors: What are the Long-Term Implications? Journal of Clinical Oncology. 2002;22:4493–4501. doi: 10.1200/JCO.2002.09.006. [DOI] [PubMed] [Google Scholar]
- 24.Ephraim PL, Dillingham TR, Sector TR, et al. Epidemiology of Limb Loss and Congenital Limb Deficiency: A Review of the Literature. Arch Phys Med Rehabil. 2003;84:747–761. doi: 10.1016/s0003-9993(02)04932-8. [DOI] [PubMed] [Google Scholar]
- 25.Rosano A, Botto L, Onlye R, et al. Limb defects associated with major congenitial anomalies: clinical and epidemiological study from the international clearinghouse for birth defects monitoring systems. American Journal of Medical Genetics. 2000;93:110–116. doi: 10.1002/1096-8628(20000717)93:2<110::aid-ajmg6>3.0.co;2-9. [DOI] [PubMed] [Google Scholar]
- 26.Amputee Coalition: Limb Loss Resource Center. Limb Loss Statistics. Retrieved May 30, 2013 from http://www.amputee-coalition.org/limb-loss-resource-center/resources-by-topic/limb-loss-statistics/limb-loss-statistics/index.html.
- 27.Kurichi JE, Vogel WB, Kwong PL, et al. Factors Associated with Total Inpatient Costs and Length of Stay During Surgical Hospitalization Among Veterans Who Underwent Lower Extremity Amputation. Am J Phys Med Rehabil. 2013;92(3):203–211. doi: 10.1097/PHM.0b013e31827446eb. [DOI] [PMC free article] [PubMed] [Google Scholar]