

Abstract
The psychometrics of the Parenting Scale's Overreactivity and Laxness subscales were evaluated using item response theory (IRT) techniques. The IRT analyses were based on two community samples of cohabiting parents of 3- to 8-year-old children, combined to yield an N of 852 families. The results supported the utility of the Overreactivity and Laxness subscales, particularly in discriminating among parents in the mid to upper reaches of each construct. The original versions of the Overreactivity and Laxness subscales were more reliable than alternative, shorter versions identified in replicated factor analyses from previously published research and in IRT analyses in the present research. Moreover, in several cases, the original versions of these subscales, in comparison with the shortened versions, exhibited greater six-month stabilities and correlations with child externalizing behavior and couple relationship satisfaction. Reliability was greater for the Laxness than for the Overreactivity subscale. Item performance on each subscale was highly variable. Together, the present findings are generally supportive of the psychometrics of the Parenting Scale, particularly for clinical research and practice. They also suggest areas for further development.
Keywords: item response theory, psychometrics, discipline, parenting, reliability
The valid assessment of parental discipline practices is crucial in both clinical and research settings. Self-reports of discipline are often desirable, either as adjunctive measures to observations, or in settings in which the direct observation of discipline is not feasible. The present article is concerned with the psychometric properties of a widely used and frequently evaluated self-report measure of discipline, the Parenting Scale (Arnold, O'Leary, Wolff, & Acker, 1993). The Parenting Scale was developed to measure dysfunctional discipline practices – those that are associated with poor child outcomes – in both clinical and research settings. It is commonly used in correlational studies and as an outcome in intervention trials (e.g., De Haan, Prinzie, & Deković, 2009; Sanders, Markie-Dadds, Tully, & Bor, 2000).
The factors identified in the Parenting Scales measure development study (Arnold et al., 1993) included Overreactivity, Laxness, and Verbosity, reflecting harsh, permissive, and overly wordy responses to child misbehavior, respectively. These subscales were validated against home observations of parenting and child misbehavior and discriminated mothers of clinically referred vs. nonreferred children. Since that time, several independent factor analyses of the Parenting Scale have consistently supported the presence of the Overreactivity and Laxness factors, but not the Verbosity factor. However, solutions have varied somewhat from study to study as to which items and how many best reflect Overreactivity and Laxness (e.g., Irvine, Biglan, Smolkowski, & Ary, 1999; Reitman et al., 2001; Rhoades & O'Leary, 2007).
Some interstudy variability in the Parenting Scale's factor structure is inevitable due to sampling error. Yet Rhoades and O'Leary's (2007) replication of Reitman et al. (2001) gives credence to their 5-item Overreactivity and Laxness factor solutions. The savings of 11 items compared with the Arnold et al. (1993) solution is also attractive, as shorter measures are desirable in both research and clinical settings. Despite these encouraging findings however, it may not yet be safe to limit the Parenting Scale to the items suggested by Rhoades and O'Leary.
As we will show, the psychometric properties of the Parenting Scale look different when viewed through the lens of item response theory (IRT). IRT and Confirmatory Factor Analysis (CFA) are similar in that each technique seeks to estimate the relation between items and the underlying factors they reflect, but by different methods and metrics. Some authors have emphasized the overlap and similarities in the results of IRT and CFA (e.g., Stark, Chernyshenko, & Drasgow, 2006). Others have emphasized the unique contributions of IRT and its fine grained evaluation of items' and scales' performance (Embretson & Reise, 2000).
Item Response Theory as Applied to the Parenting Scale
IRT is a collection of analytic models that use nonlinear functions to describe the probability of a person's responses on a questionnaire item, given a subject's trait level (e.g., a parent's degree of lax discipline). As in CFA, the trait is a continuous latent construct underlying manifest items. We focus our description here on the graded response model of Samejima (1997) in the context of the Parenting Scale. Each of its items presents a discipline scenario and asks the parent to designate where they are along a 7-point continuum between two anchors, one reflecting an ineffective and the other an effective way of handling the scenario. For example, “When I say my child can't do something” (scenario), “I let my child do it anyway” (ineffective) vs. “I stick to what I said” (effective) response to a given parenting scenario.
Applying the graded response model to the Parenting Scale, seven parameters are estimated per item, one slope and six thresholds. The slope (a) is referred to as a “discrimination” parameter, reflecting how well the item does in distinguishing among people at different levels of the underlying trait/construct (θ, interpreted as Z-scores). For example, how well does the “I raise my voice or yell” item discriminate among parents with differing levels of overreactivity? Thresholds (b) are often referred to as “difficulty” parameters, reflecting the points along the underlying latent construct (θ) at which the probability of obtaining the next highest response is .50. With 7-point responses, there are six thresholds because there are six intervals between response categories (e.g., 1 vs. 2, 2 vs. 3, etc.). To illustrate, if the first threshold, between responses 1 and 2 on the Laxness subscale is -2.5, this indicates that people who score at 2.5 SDs below the M of the laxness trait (θ score of -2.5) have an equal probability of endorsing 1 or 2; θ scores above -2.5 SDs increase the probability of endorsing a 2 above .50.
A useful feature of IRT is the item information curve (IIC) of each item. The IIC combines the slope and threshold parameters into a graphical summary that reflects how well the item measures a latent trait. Parenting Scale items with greater information better discriminate among parents at different levels of a discipline trait. As contrasted with item loadings in CFA, item information can vary at different levels of the trait rather than providing a single estimate of the item-trait relation. Moreover, IICs can be summed to yield a test information curve (TIC) that is analogous to the IIC, but gives estimates of the performance of a scale as a whole at different levels of the trait (e.g., the performance of the Laxness subscale).
The item information and scale information provided by the IICs and TICs in IRT could be particularly important in evaluating the Parenting Scale. For example, if a clinician were hoping to use the Parenting Scale to measure Laxness, it would ideally reliably distinguish among parents in the higher ranges of Laxness, and this information could be used to decide how much energy to devote to intervening in and monitoring a given parent's Laxness. Moreover, the Parenting Scale would need to reliably reflect change in parenting due to the intervention, as the client parent putatively moves from high to more moderate levels of Laxness. The same considerations apply to intervention trials in which measures need to provide especially reliable measurement of the higher ranges of dysfunctional discipline practices, as well as maximum sensitivity to change. In contrast, greater importance may be accorded to reliably discriminating parents across the full range of discipline practices in some non-clinical research settings. Given clinical and research interests in the measurement of dysfunctional discipline, the TICs of the Overreactivity and Laxness scales of the Parenting Scale would thus yield information crucial for determining the applicability of the instrument for the intended use.
One might also want to limit the Parenting Scale to items that are maximally informative in quantifying Overreactivity and Laxness, without sacrificing the overall information provided by each measure. The replicable CFA findings presented above (Reitman et al., 2001; Rhoades & O'Leary, 2007) suggest that each subscale can be limited to five items. Yet, CFA and IRT do not always converge on the same set of items as the best reflection of an underlying construct. This may be due to the common treatment of ordinal Likert-type response choices, such as those on the Parenting Scale, as continuous in CFA and ordinal in IRT (Dumenci & Achenbach, 2008). Moreover, unless a non-linear CFA approach is used, items that contribute unevenly to the measurement of the underlying construct may not load strongly in CFA (e.g., one that discriminates poorly among parents at the low end of Laxness, but discriminates well among parents at the high end of Laxness).
Where the removal of items is concerned, caution is warranted because a common effect of item removal, unless the item is clearly problematic, is sacrificed reliability. This concern may be magnified in the present case given that the Parenting Scale's subscales are already fairly short to begin with. Through analyses of TICs for different constellations of items (e.g., a 10-item vs. a 5-item Overreactivity subscale), IRT can be used to estimate the consequences to reliability of utilizing different versions of the same measure. One can then, for example, make an empirically-informed decision about whether the savings to time and participant burden are worth the degree of information loss associated with a shorter measure.
An additional helpful feature of IRT is that “unbiased estimates of item parameters may be obtained from unrepresentative samples” (p. 15; Embretson & Reise, 2000). In IRT models, the item parameters are thought to be independent of the sample characteristics. In contrast, CFA is conducted in a classical test theory framework, in which the generalization of findings to population groups different than the one the CFA is based on cannot be assumed. Whereas the p-values of factor loadings and the magnitudes of item-total correlations in classical test theory can vary greatly across samples, the slope and threshold parameters of IRT are more stable.
The Present Investigation
In the present investigation we examined the psychometric properties of the Parenting Scale Overreactivity and Laxness subscales using graded response IRT models. Our multi-step approach was primarily exploratory given the potential of the IRT approach to generate different insights than prior CFA findings. In Step 1 (Unidimensionality), we evaluated the unidimensionality of the original versions of the Overreactivity and Laxness subscales (Arnold et al., 1993), as a preliminary step before the main IRT analyses.
In Step 2 (Main IRT Analyses) we explored the performance of each original individual item and subscale for women and men, respectively. As an exploratory step, the model parameters were also compared in women vs. men. Clinicians and researchers alike would benefit from the knowledge of whether the scales discriminate equally well among mothers and among fathers along the continua of overreactive and lax discipline.
We further explored the relative performance of the original versions of the Overreactivity and Laxness subscales, as well as the revised five-item subscales suggested by Rhoades and O'Leary (2007) and Reitman et al. (2001), and subscales with five optimal items suggested by IRT analyses of the original subscales. These analyses allowed us to judge the relative measurement precision afforded by these different versions of the measures. We additionally evaluated the Hostility subscale – a new factor identified by Rhoades and O'Leary, made up of three discarded items from the original Overreactivity subscale.
In Step 3 (Stability and Concurrent Validity), we assessed the longitudinal stability and concurrent validity of the different versions of the measures. Concurrent validity was judged relative to child externalizing behavior and couple relationship satisfaction. Each of these factors is a replicable part of the nomological network of overreactivity and laxness (e.g., O'Leary, Slep, & Reid, 1999). We hypothesized that there would be significant longitudinal stability in each measure and that each would be associated with child externalizing behavior and relationship satisfaction. We explored the differences in the stability and concurrent validity associations among the different versions of the measures.
IRT analyses require very large samples because a great number of parameters are estimated simultaneously (Embretson & Reise, 2000). Thus, we combined two samples of community couples. This approach took advantage of IRT item parameters' aforementioned relative independence from specific sample characteristics and enabled the evaluation of item and scale performance across a wide range of parenting.
Method
Sample 1
Participants
A community sample of 453 couples (see Slep & O'Leary, 2005) residing in the New York City suburbs participated in the study. Participants were recruited from 1999 to 2002 via random digit dialing (RDD), in which households were contacted from a randomly generated list of telephone numbers (last four digits) for telephone exchanges (first three digits) located within a 45-minute drive from the University (Slep, Heyman, Williams, Van Dyke, & O'Leary, 2006). To be eligible, respondents had to have been living as a couple for at least a year, be parenting a 3- to 7-year-old child who was the biological child of at least one of the parents, and be able to complete questionnaires in English. If the family had more than one child in the age range, one child was selected randomly to be the target child for the purposes of this study. Demographic data for the sample are listed in Table 1. More details about the recruitment, as well as the sample's reasonably close correspondence to US Census data for the participants' county of residence, were described in Slep et al. (2006). This sample is the same one that Rhoades and O'Leary used in their 2007 factor analysis.
Table 1. Demographics for Samples 1 and 2.
| Sample 1 | Sample 2 | |||||||
|---|---|---|---|---|---|---|---|---|
|
|
|
|||||||
| Men | Women | Men | Women | |||||
|
|
|
|
|
|||||
| M/% | SD | M/% | SD | M/% | SD | M/% | SD | |
| Adult Age (Years) | 37.25 | 6.02 | 35.06 | 5.00 | 41.00 | 5.53 | 38.82 | 5.54 |
| Overreactivity | 2.61 | 0.73 | 2.73 | 0.72 | 2.58 | 0.73 | 2.72 | 0.88 |
| Laxness | 2.74 | 0.80 | 2.72 | 0.86 | 2.59 | 0.76 | 2.49 | 0.91 |
| Number of Children a | 2.36 | 0.99 | 2.76 | 0.89 | ||||
| Child Age a (Years) | 5.44 | 1.47 | 6.65 | 1.47 | ||||
| %Married a | 94% | 97% | ||||||
| %Female Child a | 52% | 50% | ||||||
| Annual Family Income a | ||||||||
| %< $25k | 3% | 1% | ||||||
| % $25k to $49k | 21% | 5% | ||||||
| % $50k to $74k | 31% | 18% | ||||||
| % $75k to $99k | 25% | 27% | ||||||
| % ≥ $100k | 20% | 49% | ||||||
| Education | ||||||||
| Some College or Above | 72% | 79% | 74% | 88% | ||||
| High School or Less | 28% | 21% | 26% | 12% | ||||
| Adult Race/Ethnicity | ||||||||
| %Non-Latino White | 79% | 82% | 91% | 91% | ||||
| % Black | 7% | 6% | 3% | 3% | ||||
| % Latino | 10% | 8% | 3% | 4% | ||||
| % Asian | 2% | 2% | 1% | 1% | ||||
| % Other | 3% | 2% | 1% | 1% | ||||
= Couple average.
Procedure
Couples completed one 6-hr or two 3-hr laboratory assessment(s). After consent was obtained, the couples were separated to complete questionnaires independently. Participants completed extensive batteries of questionnaires about themselves, their relationships, and their families. Study couples were paid $250.
Measures
Men and women each completed the Parenting Scale (Arnold et al., 1993), as part of a larger research protocol (see Slep & O'Leary, 2007). The Parenting Scale is a 30-item self-report scale that assesses parental discipline strategies in response to child misbehaviors. Parents' discipline strategies, after reverse coding some of items, were rated on 7-point Likert-type scales, where 1 indicates a high probability of using an effective discipline strategy and 7 indicates a high probability of ineffective discipline. The full measure is presented in an on-line supplement.
Sample 2
Participants
Three hundred and ninety-nine community couples residing in the New York City suburbs completed questionnaires as part of a broader study. Participants were recruited between 2004 and 2007, initially using the Sample 1 RDD procedure. In contrast to our prior experience, however, we detected an underrepresentation of minorities while the recruitment was ongoing. This may be the result of a shift in the demographics of people with landline phones. Thus, we supplemented RDD with calling lists purchased from Survey Sampling International (SSI; Shelton, CT). SSI maintains a database of households compiled from multiple sources (e.g., telephone directories, birth records, etc.). We conducted all subsequent recruitment with both RDD and phone calls to numbers on these lists, which were generated to oversample minority families in the vicinity of the University. The inclusion criteria were identical to the ones in Sample 1, with the exception that children were to be between 4 and 8 years old. Demographic data for the sample are listed in Table 1. The sample had a greater proportion of White families, and was more educated and affluent than the average family in their county of residence per US Census data (see on-line supplement Table S1).
Procedure
Couples completed two 2-hr laboratory assessments at T1 and again 6 months later (T2). Data were collected anonymously. Study couples were paid a total of $400.
Measures
Men and women each completed the Parenting Scale (T1 and T2), the Quality of Marriage Index (QMI; Norton, 1983, T1), and the MacArthur Health and Behavior Questionnaire (HBQ; Essex at al., 2002, T1), as part of a larger laboratory protocol.
The QMI is a six-item inventory that assesses marital satisfaction (e.g., “We have a good marriage”); responses are on 7-point scales. It has excellent internal consistency and high convergent validity with other measures of couple relationship satisfaction (Heyman, Sayers, & Bellack, 1994). Mothers' (α =.96) and fathers' (α =.95) QMI composites were then averaged (r = .59, p < .001) to create a couple-level relationship satisfaction variable for analysis.
The HBQ is a 140-item questionnaire measure of child health. It has adequate test-retest and inter-rater reliabilities in epidemiological samples (Essex et al., 2002) and it has been validated against diagnoses derived from the Diagnostic Interview Schedule for Children (Luby et al., 2002). For the present focus, we used an Externalizing composite that comprised the following subscales: Inattention, Impulsivity, Conduct Problems, Oppositional Defiant, Overt Hostility, and Relational Aggression subscales. Items were averaged for each subscale and subscales were subsequently averaged to form the Externalizing composite score. Fathers' (α = .83) and mothers' (α = .96) Externalizing composites were then averaged (r = .43, p< .001) across parents to create a dual-reporter Externalizing variable for analysis.
Results
Descriptive statistics for the different versions of the Parenting Scale subscales are found in Table 2. All analyses of the Parenting Scale's reliability utilized the full dataset (Sample 1; Sample 2, Time 1), with the very small percentage of missing data (.20 %) handled via the marginal maximum likelihood method with IRTPRO 2.1 (Scientific Software International, 2011). Stability and concurrent validity correlations were estimated in Sample 2, via a structural equation model; covariances were allowed between all pairs of variables. This task was implemented using Mplus 6.11 (Muthén, & Muthén, 1998-2010) with full information maximum likelihood estimation. Missing data (5.06 %) were primarily a function of attrition.
Table 2. Descriptive Statistics for and Correlations among Different Versions of the Subscales.
| Women | |||||||||||
|---|---|---|---|---|---|---|---|---|---|---|---|
|
|
|||||||||||
| OVRO | OVRR | OVRF | HOST | LAXO | LAXR | LAXF | M | SD | Min. | Max. | |
| OVRO | - | .92 | .93 | .68 | .42 | .33 | .35 | 2.73 | 0.80 | 1.00 | 5.90 |
| OVRR | .91 | - | .89 | .44 | .36 | .29 | .30 | 3.10 | 0.96 | 1.00 | 6.50 |
| OVRF | .92 | .88 | - | .55 | .45 | .37 | .38 | 3.00 | 0.96 | 1.00 | 6.40 |
| HOST | .63 | .36 | .48 | - | .31 | .24 | .28 | 1.64 | 0.79 | 1.00 | 6.00 |
| LAXO | .24 | .25 | .25 | .14 | - | .91 | .92 | 2.61 | 0.89 | 1.00 | 6.45 |
| LAXR | .17 | .19 | .17 | .09 | .90 | - | .90 | 2.52 | 0.94 | 1.00 | 6.60 |
| LAXF | .21 | .23 | .22 | .13 | .91 | .89 | - | 2.58 | 1.04 | 1.00 | 6.60 |
| Men | |||||||||||
| M | 2.60 | 2.91 | 2.83 | 1.62 | 2.67 | 2.50 | 2.55 | ||||
| SD | 0.73 | 0.91 | 0.91 | 0.80 | 0.78 | 0.85 | 0.92 | ||||
| Min. | 1.00 | 1.00 | 1.00 | 1.00 | 1.00 | 1.00 | 1.00 | ||||
| Max. | 5.40 | 6.00 | 6.60 | 6.67 | 5.36 | 5.80 | 6.60 | ||||
Note. Women above and men below the diagonal; OVR = Overreactivity; LAX = Laxness; HOST = Hostility; numbered subscripts indicate (O) Original (Arnold et al., 1993), (R) Reitman/Rhoades (Reitman et al., 2001; Rhoades & O'Leary, 2007), and (F) Most Informative Five version of each subscale; Min. and Max. respectively indicate minimum and maximum observed scores.
Step 1: Unidimensionality
Prior to the main analyses, IRT models' unidimsionality assumption was evaluated for each original subscale using both principal component analysis (PCA) and IRT methods with the original Arnold et al. (1993) Overreactivity and Laxness subscales. Scree plots in each case supported unidimensionality. For mothers' and fathers' Overreactivity and Laxness, there was a large first component, with a substantial drop-off in explained variance from the first to second component; the second component explained 35% and 23% as much variance as the first component for Overreactivity and Laxness, respectively. Moreover, there was little change in explained variance for subsequent components. Loadings for Overreactivity ranged from .42 to .72 (M = .60) for women and from .33 to .73 (M = .53) for men. Loadings for Laxness ranged from .44 to .76 (M = .64) for women and from .33 to .70 (M = .58) for men.
Local dependence in the graded response IRT models was evaluated as a further check for unidimensionality by values of the Chen and Thissen's (1997) standardized local dependence statistic (LD χ2). Local dependence is evident when covariances in pairs of items are greater than predicted by the model. Such a pattern suggests that the locally dependent items reflect an additional dimension that has not been modeled (i.e., there are clusters of items that hang together in a way not predicted by the unidimensional model). This is similar to correlated residual variances in CFA. For the Overreactivity subscale, all values of the LD χ2 were below the threshold of 10 that is considered positive evidence of local dependence (Scientific Software International, 2011). For the Laxness subscale, only 4 of the 54 (7.41%) LD χ2 values for men exceeded 10, as did 2 of the 54 (3.70%) LD χ2 values for women. Overall, there was little evidence to suggest local dependence of Laxness items.
Step 2: Main IRT Analyses
The “Original” (Arnold et al., 1993) Overreactivity (10-item) and Laxness (11-item) subscales were analyzed first1. The 5-item versions of these subscales suggested by Reitman et al. (2001) and Rhoades and O'Leary (2007), and by the results of IRT analysis reported below, were evaluated second. These are referred to as the “Reitman/Rhoades” and “Most Informative Five” versions, respectively. Their corresponding item numbers are found in Figures 1 and 3. The Hostility subscale suggested by Rhoades and O'Leary was evaluated last (item numbers in Figure 4). Tables of parameter estimates are provided in the on-line supplement (Tables S2 and S3). Descriptive statistics for and correlations among the different versions of these subscales are included in Table 2.
Figure 1.
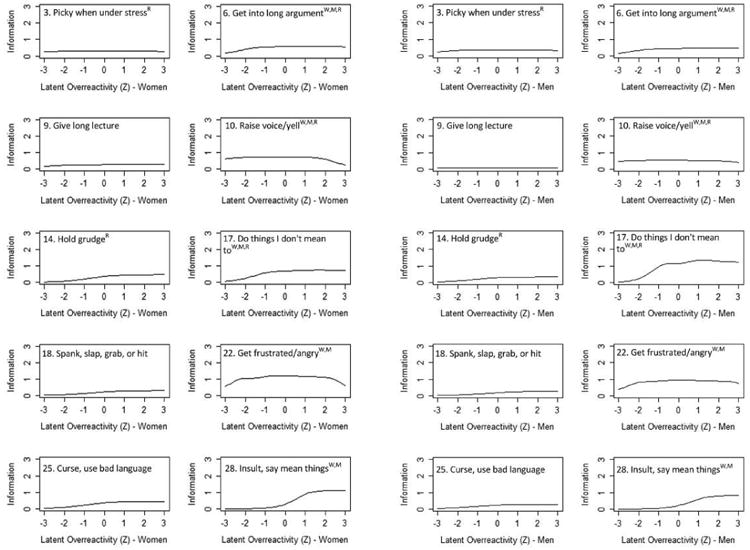
Item information curves for Overreactive discipline; W and M denote that item is among the five most informative items for women and men, respectively; R items were identified in the factor analyses of Rhoades and O'Leary (2007) and Reitman et al. (2001); item number corresponds to original questionnaire of Arnold et al. (1993; see on-line supplement).
Figure 3.

Item information curves for Lax discipline; W and M denote that item is among the five most informative items for women and men, respectively; R items were identified in the factor analyses of Rhoades and O'Leary (2007) and Reitman et al. (2001); item number corresponds to original questionnaire of Arnold et al. (1993; see on-line supplement).
Figure 4.

Item information curves for Hostile discipline factor identified by Rhoades and O'Leary (2007).
Overreactivity
IICs for the Original Overreactivity subscale revealed varying item precision (Figure 1). When only a single item is used to measure a latent trait, the absolute amount of information contributed by the item at any point on the trait being measured (i.e., the height of the IIC) is usually low (Baker, 2001). However, the relative amount of information contributed by different items, both overall and at specific points along the trait, points to the better and worse performers. Two items contributed very little information across the range of Overreactivity, as their IICs were low and flat: “Picky when under stress” and “Give long lecture.” The majority of the remaining items exhibited greater discrimination (i.e., more information) at higher than at lower levels of Overreactivity: “Get into a long argument,” “Hold a grudge,” “Do things I don't mean to,” “Spank, slap, grab, or hit,” “Curse, use bad language,” and “Insult, say mean things.” Finally, two items best discriminated people in the middle ranges of Overreactivity: “Raise voice or yell” became decreasingly precise above about +2 SDs of the mean. “Get frustrated/angry” contributed the most overall information of all items, but somewhat less so beyond +/-2 SDs of the mean. The items for the Most Informative Five version of Overreactivity were picked based on the overall height of their IICs.
Next, the performance of the Overreactivity subscale as a whole was evaluated with TICs and IRT based “marginal reliability” estimates (Sireci, Thissen, & Wainer, 1991; Figure 2, Panels A and B). TICs are plotted together for each version of the Overreactivity subscale in Figure 2. Discrimination was notably better at higher levels of Overreactivity. Of the different versions, the Original subscale showed a clear advantage (i.e., contributed more information), especially at the high end of the construct. The reliability of the Original subscale exceeded the .80 threshold at approximately -1 SD from the mean and continued to grow at higher levels, with a slight downward taper above +2 SDs (overall reliability = .83 and .81 for women and men, respectively). The Most Informative Five subscale had intermediate performance,2 but at its best barely exceeded the .80 reliability mark (overall reliability = .79 and .77 for women and men, respectively). The Reitman/Rhoades 5-item subscale had the weakest overall reliability (.77 and .75 for women and men, respectively), providing particularly poor discrimination at the low end of Overreactivity, but with better, and fairly flat, performance from -1 to +3 SD.
Figure 2.

Test information curves (TIC) for different versions of the Overreactivity (Panels A and B), Laxness (Panels C and D), and Hostility (Panels E and F) subscales.
Correlations among the different versions of the Overreactivity subscale ranged from .89 to .93 (M = .91) for women, and from .88 to .92 (M = .90) for men. Yet, for both women and men, mean test information, compared across the spectrum of Overreactivity in increments of .2, was greater for the Original subscale than for both the Rhoades/Reitman (ds > 4.70), and Most Informative Five (ds > 1.45) scales. The Most Informative Five subscale had greater mean test information than the Reitman/Rhoades subscale, ds > .41. These numeric differences are buttressed by statistically significant comparisons (ps < .001) of the corresponding Cronbach's alphas of each version, judged via the W statistic of Feldt (1980), albeit corresponding to a classical test theory operationalization of reliability.
Laxness
Analyses of the Laxness subscale followed the same model as those of Overreactivity. As with Overreactivity, IICs for Laxness revealed that some items performed better than others (Figure 3). Two items contributed very little information across the range of Laxness: “Let child get away with a lot when not at home” and “If child misbehaves then acts sorry, I let it go.” Another group contributed generally low information, rising somewhat at higher levels of Laxness: “Let my child do whatever s/he wants,” “Coax or beg child,” “Often let things go,” “Let it go/do it myself,” and “Offer child something nice to behave if ‘no’ fails.” Four items stood out as top performers: “Don't carry out threats/warnings,” “Back down when child gets upset at ‘no’,” “When I say my child can't do something, I let my child do it anyway,” and “Threaten things that I know I won't do.” For most of the items, discrimination was notably better at greater levels of Laxness, with some downward tapering between +2 and +3 SDs. The items for the Most Informative Five version of Laxness were picked based on the overall height of their IICs.
The performance of the Laxness subscale as a whole was evaluated next via TICs and IRT-based reliability estimates (Figure 2, Panels C and D). For all versions, discrimination was greater at higher levels of Laxness. However, as with Overreactivity, the Original Laxness subscale showed a clear advantage. The reliability of the Original subscale exceeded the .80 threshold over most of its range, from approximately -2 SD from the mean and continued to grow at higher levels, with a slight downward taper at +2 SDs (overall reliability = .89 and .87 for women and men, respectively). The Most Informative Five subscale had intermediate performance (overall reliability = .86 and .81 for women and men, respectively), with reliability greater than .80 above approximately -1.5 SD. The 5-item Reitman/Rhoades version exhibited notably poorer performance than did the other two versions. Its overall reliability was .77 for both men and women. At its best (+1 to +3 SDs), reliability hovered at around .80.
Correlations among the different Laxness subscales ranged from .90 to .92 (M = .91) for women, and from .89 to .91 (M = .90) for men (Table 2). Yet, for both women and men, mean test information, compared across the spectrum of Laxness in increments of .2, was greater for the Original subscale than for both the Rhoades/Reitman (ds > 2.28), and Most Informative Five (ds > 2.23) scales. The Most Informative Five subscale had greater mean test information than the Reitman/Rhoades subscale, ds > 1.34. These numeric differences are further buttressed with statistically significant W tests comparing the corresponding alphas of each version (ps < .001).
Laxness vs. Overreactivity
Given the appearance of greater reliability for Laxness than for Overreactivity in Figure 2, we conducted post-hoc tests comparing test information from the original versions of each of these two scales across their respective latent trait scores in increments of 0.2. For men and women, information was greater for the Laxness subscale than for the Overreactivity subscale, ds ≥ 1.52. These numeric differences are further buttressed with statistically significant W tests comparing the two subscales' alphas (ps < .001).
Hostility
The PCAs and local dependence tests reported above suggested unidimensionality among all Overreactivity items. Yet, Rhoades and O'Leary's (2007) findings suggested the possibility of a Hostility factor, distinct from the other Overreactivity items. Because the psychometrics of the Hostility factor may be of interest, a parallel set of analyses was performed for these three items. Judging by IICs (Figure 4), “Insult, say mean things” substantially outperformed “Spank, slap, grab, or hit” (low flat curve) and “Curse, use bad language” (low curve that increases above -1 SD). However “Insult, say mean things” contributed information very unevenly across the spectrum of Hostility. Its discriminative power was zero or near zero until just below the M of Hostility, followed by a sharp upward curve that flattened somewhat at about +1 SD. Correspondingly, overall reliability was poor for both women (.53) and men (.51). However, at the scale level, reliability was near or above the .8 threshold at approximately +1 SD and above (Figure 2, Panels E and F).
Gender comparisons of IRT parameters
To explore whether there were differences in IRT model parameters in women vs. men, we tested measurement invariance across genders for each Original subscale (Reise, Widaman & Pugh, 1993). Multidimensional IRT models were estimated, allowing male-female correlations between each latent trait, as the mothers and fathers were nested within couples. We tested a baseline model where the slope and threshold parameters were freely estimated in men and women, and then a more restrictive model in which we constrained women's slope and threshold parameters to be equal to men's. Measurement invariance was tenable for Hostility [χ2Δ (20) = 8.41, p = .99], however, not for Overreactivity [χ2Δ (71) = 161.50, p < .001], Laxness [χ2Δ (78) = 217.60, p < .001]. Follow-up analyses of measurement invariance on an item-by-item basis revealed significant mother-father differences in the slope (2 items) and threshold (5 items) parameters of the 10 Overreactivity items, slopes (2 items) and thresholds (6 items) of the 11 Laxness items, as reported in the on-line supplement (Table S4). These differences can be seen in the IICs and TICs, which generally indicate that the items and subscales better discriminated among women than men, as well as in the parameters reported in Tables S2 and S3.
Step 3: Stability and Concurrent Validity
Stability
Six-month stability was evaluated in Sample 2 (Table 3). Each version of the Overreactivity and Laxness subscales, as well as the three-item Hostility subscale, exhibited substantial six-month stability, rs ≥ .63, ps < .001. However, the degree of stability differed among the scales. Differences in stability correlations among different versions of the same scales were evaluated with the Fisher r-to-Z transformed version of the Pearson-Filon test for related but non-overlapping correlations (ZPF; Raghunathan, Rosenthal, & Rubin, 1996). A generally consistent pattern emerged in which the Original versions of the Overreactivity and Laxness scales, compared with their respective Reitman/Rhoades and Most Informative Five versions, had numerically greater six-month stability. In four cases, these differences were statistically significant. Stability was greater for women's Original than for Reitman/Rhoades Overreactivity scores, ZPF = 2.10, p = .036. Stability was also greater for the Original than for the Most Informative Five versions of Laxness in both women (ZPF = 2.28, p = .022) and men (ZPF = 2.58, p = .010). Finally, stability was greater for men's Original version than for the Reitman/Rhoades version of Laxness, ZPF = 3.44, p < .001). No other correlation comparison was statistically significant.
Table 3. Reliability, Stability, and Concurrent Validity Correlations of Different Versions of Discipline Subscales (With Sample 2).
| Concurrent Validity | |||||||||||
|---|---|---|---|---|---|---|---|---|---|---|---|
|
|
|||||||||||
| No. of Items | Time 1 Reliability | Time 1-2 Stability | Women's Parenting | Men's Parenting | Women's Parenting | Men's Parenting | |||||
|
|
|
|
|||||||||
| Women | Men | Women | Men | Correlations with QMI | Correlations with EXT | ||||||
| Overreactivity | |||||||||||
| Original | 10 | .83 | .81 | .78a | .72 | -.22 | -.24a | .47a | .39a,b | ||
| Reitman/Rhoades | 5 | .77 | .75 | .72 | .69 | -.21 | -.20 | .42 | .32 | ||
| Most Informative | 5 | .79 | .77 | .73 | .70 | -.22 | -.21 | .45 | .34 | ||
| Laxness | |||||||||||
| Original | 11 | .89 | .87 | .84b | .77a,b | -.23 | -.24b | .24b | .11 | ||
| Reitman/Rhoades | 5 | .77 | .77 | .77 | .64 | -.20 | -.20 | .22 | .10 | ||
| Most Informative | 5 | .86 | .81 | .75 | .68 | -.21 | -.16 | .18 | .10 | ||
| Hostility | 3 | .53 | .51 | .76 | .63 | -.16 | -.11 | .42 | .31 | ||
Note. Reliability is “marginal reliability” derived from IRT analysis; stability coefficients are six-month correlations; a and b denote greater stability or concurrent validity correlations for the Original scoring in comparison with the Reitman/Rhoades and Most Informative scorings, respectively, judged by the Z-based Pearson-Filon test (stability correlations) and Steiger's Z (concurrent validity correlations); QMI = Quality of Marriage Index (couple average); EXT = child externalizing (couple average).
All correlations are significant at p < .05 or better.
Concurrent validity
Concurrent validity for the Parenting Scale's subscales was examined relative to couple composites of both relationship satisfaction on the QMI and child externalizing behavior on the HBQ, in Sample 2 (Table 3). Given well-established relations of compromised discipline practices with couple relationship satisfaction and child externalizing behavior, it is no surprise that all discipline-QMI/HBQ correlations were significant. Correlations ranged from .10 (p = .047) to .47 (p < .001).
A more useful question to ask is whether the concurrent validity correlations were stronger for the Original versions of the Overreactivity and Laxness subscales compared with their counterparts, given their greater reliability and stability. Such differences were found in six cases, judging by Steiger's (1980) Z for comparing dependent correlations. For both women (Z = 3.50, p < .001) and men (Z = 3.43, p < .001), the Original Overreactivity subscale, compared with the Reitman/Rhoades version, was more strongly associated with child Externalizing behavior. In men the Overreactivity-Externalizing association was also stronger for the Original than for the Most Informative Five versions (Z = 2.55, p = .011). In women, the Laxness-Externalizing association was stronger for the Original than for the Most Informative Five version (Z = 3.13, p = .002). Further, among men the Overreactivity-QMI association was stronger for the Original than the Reitman/Rhoades (Z = 1.98, p = .047) version, and the Laxness-QMI association was stronger for the Original than Most Informative Five (Z = 3.72, p < .001) version.
Discussion
The IRT analyses yielded detailed and novel insights into the psychometrics of the Parenting Scale. The present results suggest that the Overreactivity and Laxness subscales discriminate most reliably among men and women with average to above average levels of these dysfunctional discipline practices. Accordingly, the Parenting Scale is well suited for clinical practice and for research applications concerned with discriminating among the mid to upper ranges of dysfunctional discipline (e.g., clinical research, etiological research on child psychopathology). Overreactivity and laxness are frequently hypothesized etiological factors for children's externalizing problems as well as two common targets of empirically-supported clinical and preventive interventions (e.g., Sanders et al., 2000). In clinical research and practice settings, discrimination among the gradations of moderately to highly ineffective parenting practices, as well as the ability to reliably detect change, are at a premium. For example, clinicians need to be able to measure the extent of overreactivity and laxness accurately to determine how much each should be a clinical focus. Clinicians also need to be able to reliably detect change in parenting to gauge intervention response. The present results suggest the utility of the Parenting Scale for such purposes. Yet reliability falters somewhat at the lower reaches of each construct. If discrimination at the lower reaches of these continua is of great concern (e.g., measuring the gradual emergence of overreactivity and laxness in infancy), measures other than the Parenting Scale may be more appropriate; but for those concerned with change from poor to better discipline, the Parenting Scale performs well.
The present results further suggest that shortened versions of the Parenting Scale result in significant losses of precision. Analyses of the item information curves revealed that some items offered much less discriminative power than others. At first blush, this would appear to suggest that relatively uninformative items can be eliminated. Yet the shortened versions of the Overreactivity and Laxness subscales, compared with the Original versions (10 and 11 items, respectively), resulted in psychometric disadvantages, whether using the 5-item sets of Reitman et al. (2001) and Rhoades and O'Leary (2007), or the most informative 5-item sets identified via IRT. These differences were particularly pronounced for Overreactivity, where information loss in the test information curves of the abbreviated subscales was especially noticeable at higher levels of the construct. The Reitman/Rhoades version of the Laxness subscale showed worse performance than either the original or most informative five items.
The psychometric disadvantages of the shortened scales were also evident in the six-month stability and concurrent validity correlations. Although differences among the versions were modest the stability and concurrent validity correlations were generally higher for the original scales in comparison with their counterparts. Several of the correlations were significantly different, despite the small magnitude of these differences and the difficulty of detecting differences in correlations with criterion variables among highly correlated versions of the scales. Together these findings suggest that the original versions of the Overreactivity and Laxness subscales, compared with their shorter counterparts, can be expected to have somewhat greater rank order stability. They can also be expected to have greater correlations with child externalizing behavior and couple relationship satisfaction, and perhaps with other related variables.
Although they are generally supportive of the validity of the Overreactivity and Laxness subscales, the present results indicate that there is room for further development. The Laxness subscale was more reliable than the Overreactivity subscale. Additional items could perhaps be written to index overreactivity more sensitively. Upon their validation, the new items could be added to the measure either in addition to the existing items or as replacements for the poorer performers. Several items individually contributed very little information and are therefore good candidates for replacement.
The need for further development is also suggested by both measures' better performance for women than men, particularly on the Laxness subscale. This finding was unanticipated; there is no theoretical basis of which the authors are aware to predict gender differences in the laxness construct. Men may either exhibit laxness in different ways than women or interpret the items differently. Additional items may need to be written that capture men's laxness more reliably. Alternatively, the poorer performance of the Laxness subscale in men could also be attributable to the fact that women usually do more parenting than men (Parke, 2002). In summary, the Laxness and Overreactivity scales' reliabilities are certainly acceptable for men and women, but the scales' performance for men were somewhat weaker than they were for women.
Fine grained follow-up analyses suggested some additional subtle differences in the performance of some items and responses for men and women on the Overreactivity and Laxness factors, particularly where threshold parameters are concerned. In several cases, the levels of the latent Overreactivity and Laxness constructs required to push responses on a given item to the next highest level (e.g., from a 4 to a 5) were different for men and women. The direction of these gender differences in thresholds was inconsistent, sometimes even among the six thresholds for a single item. Although these subtle differences do not impact the conclusions about the scales overall – they are more reliable for women than for men – researchers who are interested in untangling gender differences in the performance of the Parenting Scale might find these results to be interesting additional food for thought.
The Hostility subscale identified by Rhoades and O'Leary (2007) performed unevenly across the range of hostility, contributing little to discrimination among parents in the lower ranges of the construct. In contrast, discrimination among highly hostile parents was acceptable. Most of the discriminatory power of the Hostility subscale was driven by one of its three items. Thus, additional measure development or the use of alternative instruments is indicated where the measurement of hostile parent behavior that is distinct from more “ordinary” overreactive behaviors is concerned. The Psychological Aggression subscale of the Parent-Child Conflict Tactics Scale (PC-CTS; Straus, Hamby, Finkelhor, Moore, & Runyan, 1998) largely overlaps with the Parenting Scale's Overreactivity subscale. The Family Maltreatment measure (FM; Slep, Heyman, & Snarr, 2011), however, offers additional items to round out the construct.
Limitations
The study participants were drawn from a suburban population of cohabiting couples of 3- to 8-year-old children, with some underrepresentation of racial and ethnic minorities and with greater education and family income than is typical in the United States. Thus successful generalization to other population groups is not guaranteed. For example, contextual influences (e.g., ethnicity, neighborhood characteristics) may impact not only the quantity of different discipline practices (e.g., more or less yelling), but what these practices mean (e.g., yelling and spanking as a means of protecting the child against external harm vs. as an expression of an out-of-control parent; Deater-Deckard, Dodge, Bates, & Pettit, 1996). Such qualitative differences could impact the extent to which the Parenting Scale's psychometrics generalize to different groups. This concern is tempered somewhat, but not eliminated, by IRT's “new rules of measurement” (Embretson & Reise, 2000) in which statistical estimates are thought to be much more independent of sample characteristics than they are in methods based on classical test theory.
The present findings also highlight the largely verbal and expressive nature of the Overreactivity subscale. Conceptually, the construct includes both physically rough handling of the child and angry parental affect. However, the only explicitly physical item on the Overreactivity subscale (“Spank, slap, grab, or hit”) was not among the top performers. Given the underrepresentation of physical discipline tactics on the Parenting Scale, and the above item's poor performance, researchers and clinicians interested in characterizing physical discipline should turn to other measures, such as the Parent–Child Conflict Tactics Scale and the Family Maltreatment measure.
Conclusion
The present findings suggest that the Parenting Scale's Overreactivity and Laxness subscales are well suited for research and clinical settings in which there is an emphasis on discriminating among parents in the mid to upper reaches of each construct. Discrimination among parents who exhibit very low Overreactivity and Laxness was poorer. The original versions of the Overreactivity and Laxness subscales outperformed their shortened counterparts identified in replicated factor analyses in previous research and in IRT analyses in the present research. Pending further development, it may be psychometrically advantageous to continue using the original Overreactivity and Laxness subscales. Finally, the present results also suggest the need for some improvement to increase the reliability of the Overreactivity subscale, and to improve the performance of the Parenting Scale in measuring fathers' discipline practices.
Supplementary Material
Table S1: Demographic Comparison of Study Samples to 2011 US Census Data for the County of Residence
Table S2: Item Parameters Derived from Graded Response Model IRT Analyses – Overreactivity and Laxness
Table S3: Item Parameters Derived from Graded Response Model IRT Analyses – Hostility
Table S4: IRT Parameters and DIF Tests for Women and Men
Acknowledgments
The authors thank Virginia Y. Lorber for her valuable editorial assistance.
Footnotes
Item fit was assessed with the S-χ2 item-fit statistic suggested by Orlando and Thissen (2003). For the vast majority of the items (∼88%), there was no evidence of statistically significant misfit – differences between expected (i.e., model implied) and observed probabilities. The exceptions are noted here. For men's Overreactivity, one item had reliable misfit: 14 (“Hold grudge,” p =.049). For women's Laxness, three items exhibited reliable observed vs. expected probability misfit: 12 (“Coax or beg child,” p =.018), 24 (“If child misbehaves then acts sorry, I let it go,” p =.005), and 30 (“Back down when child gets upset at ‘no’,” p = .013). For men's Laxness, one item had reliable observed vs. expected probability misfit: 26 (“When I say my child can't do something, I let my child do it anyway,” p = .002). Ideally, no item would exhibit reliable misfit; one might consider removing such items. However, it was decided that retaining the above items was preferable to the loss of information associated with removing them.
The study women and men were nested within couples, thus their data are not independent. Yet, when each gender is analyzed separately, it is not necessary to account for such dependence (Kenny, Kashy, & Cook, 2006).
Contributor Information
Michael F. Lorber, New York University
Shu Xu, New York University.
Amy M. Smith Slep, New York University
Lisanne Bulling, New York University.
Susan G. O'Leary, Stony Brook University
References
- Arnold DS, O'Leary SG, Wolff LS, Acker MM. The Parenting Scale: A measure of dysfunctional parenting in discipline situations. Psychological Assessment. 1993;5:137–144. doi: 10.1037/1040-3590.5.2.137. [DOI] [Google Scholar]
- Baker Frank. The Basics of Item Response Theory. ERIC Clearinghouse on Assessment and Evaluation, University of Maryland; College Park, MD: 2001. [Google Scholar]
- Chen W, Thissen D. Local dependence indexes for item pairs using item response theory. Journal of Educational and Behavioral Statistics. 1997;22:265–289. doi: 10.2307/1165285. [DOI] [Google Scholar]
- Deater-Deckard K, Dodge KA, Bates JE, Pettit GS. Physical discipline among African American and European American mothers: Links to children's externalizing behaviors. Developmental Psychology. 1996;32:1065–1072. doi: 10.1037//0012-1649.32.6.1065. [DOI] [Google Scholar]
- De Haan AD, Prinzie P, Deković M. Mothers' and fathers' personality and parenting: The mediating role of sense of competence. Developmental Psychology. 2009;45:1695–1707. doi: 10.1037/a0016121. [DOI] [PubMed] [Google Scholar]
- Dumenci L, Achenbach TM. Effects of estimation methods on making trait-level inferences from ordered categorical items for assessing psychopathology. Psychological Assessment. 2008;20:55–62. doi: 10.1037/1040-3590.20.1.55. [DOI] [PubMed] [Google Scholar]
- Embretson SE, Reise SP. Item Response Theory for Psychologists. Mahwah, NJ: L. Erlbaum Associates; 2000. [Google Scholar]
- Essex MJ, Boyce WT, Goldstein LH, Armstrong JM, Kraemer HC, Kupfer DJ. The confluence of mental, physical, social, and academic difficulties in middle childhood. II: Developing the MacArthur health and Behavior Questionnaire. Journal of the American Academy of Child & Adolescent Psychiatry. 2002;41:588–603. doi: 10.1097/00004583-200205000-00017. [DOI] [PubMed] [Google Scholar]
- Feldt LS. A test of the hypothesis that Cronbach's alpha reliability coefficient is the same for two tests administered to the same sample. Psychometrika. 1980;45:99–105. doi:10.1007=BF02293600. [Google Scholar]
- Heyman RE, Sayers SL, Bellack AS. Global marital satisfaction versus marital adjustment: An empirical comparison of three measures. Journal of Family Psychology. 1994;8:432–446. doi: 10.1037/0893-3200.8.4.432. [DOI] [Google Scholar]
- Irvine A, Biglan A, Smolkowski K, Ary DV. The value of the Parenting Scale for measuring the discipline practices of parents of middle school children. Behavior Research and Therapy. 1999;37:127–142. doi: 10.1016/S0005-7967(98)00114-4. [DOI] [PubMed] [Google Scholar]
- Kenny DA, Kashy DA, Cook WL. Dyadic Data Analysis. New York, NY: Guilford Press; 2006. [Google Scholar]
- Luby JL, Heffelfinger A, Measelle JR, Ablow JC, Essex MJ, Dierker L, Harrington R, Kraemer HC, Kupfer DJ. Differential performance of the MacArthur HBQ and DISC-IV in identifying DSM-IV internalizing psychopathology in young children. Journal of the American Academy of Child and Adolescent Psychiatry. 2002;41:458–466. doi: 10.1097/00004583-200204000-00019. [DOI] [PubMed] [Google Scholar]
- Muthén LK, Muthén BO. Mplus User's Guide. Sixth. Los Angeles, CA: Muthén & Muthén; 1998-2010. [Google Scholar]
- Norton R. Measuring marital quality: A critical look at the dependent variable. Journal of Marriage and the Family. 1983;45:141–151. doi: 10.2307/351302. [DOI] [Google Scholar]
- O'Leary SG, Slep AMS, Reid MJ. A longitudinal study of mothers' overreactive discipline and toddlers' externalizing behavior. Journal of Abnormal Child Psychology. 1999;27:331–341. doi: 10.1023/a:1021919716586. doi:10.1023/A: 1021919716586. [DOI] [PubMed] [Google Scholar]
- Orlando M, Thissen D. Further investigation of the performance of S-X2: An item fit index for use with dichotomous item response theory models. Applied Psychological Measurement. 2003;27:289–298. doi: 10.1177/0146621603027004004. [DOI] [Google Scholar]
- Parke RD. Fathers and families. In: Bornstein MH, editor. Handbook of Parenting. Vol. 3. Mahwah, NJ: Erlbaum; 2002. pp. 27–63. [Google Scholar]
- Raghunathan TE, Rosenthal R, Rubin DB. Comparing correlated but nonoverlapping correlations. Psychological Methods. 1996;1:178–183. doi: 10.1037/1082-989X.1.2.178. [DOI] [Google Scholar]
- Reise SP, Widaman KF, Pugh RH. Confirmatory factor analysis and item response theory: Two approaches for exploring measurement invariance. Psychological Bulletin. 1993;114:552–566. doi: 10.1037//0033-2909.114.3.552. [DOI] [PubMed] [Google Scholar]
- Reitman D, Currier RO, Hupp SA, Rhode PC, Murphy MA, O'Callaghan PM. Psychometric characteristics of the Parenting Scale in a head start population. Journal of Clinical Child & Adolescent Psychology. 2001;30:514–524. doi: 10.1207/S15374424JCCP3004_08. [DOI] [PubMed] [Google Scholar]
- Rhoades KA, O'Leary SG. Factor structure and validity of the Parenting Scale. Journal of Clinical Child & Adolescent Psychology. 2007;36:137. doi: 10.1080/15374410701274157. [DOI] [PubMed] [Google Scholar]
- Samejima F. Graded response model. In: van der Linden WJ, Hambleton RK, editors. Handbook of Modern Item Response Theory. New York: Springer; 1997. pp. 85–100. [Google Scholar]
- Sanders MR, Markie-Dadds C, Tully LA, Bor W. The Triple P-Positive Parenting Program: A comparison of enhanced, standard, and self-directed behavioral family intervention for parents of children with early onset conduct problems. Journal of Consulting and Clinical Psychology. 2000;68:624–640. doi: 10.1037/0022-006X.68.4.624. [DOI] [PubMed] [Google Scholar]
- Scientific Software International. IRTPRO: User's Guide. Lincolnwood, IL: Author; 2011. [Google Scholar]
- Sireci SG, Thissen D, Wainer H. On the reliability of testlet-based tests. Journal of Educational Measurement. 1991;28:237–247. [Google Scholar]
- Slep AMS, Heyman RE, Snarr JD. Child emotional aggression and abuse: Definitions and prevalence. Child Abuse and Neglect. 2011;35:783–796. doi: 10.1016/j.chiabu.2011.07.002. [DOI] [PubMed] [Google Scholar]
- Slep AMS, Heyman RE, Williams MC, Van Dyke CE, O'Leary SG. Using random telephone sampling to recruit generalizable samples for family violence studies. Journal of Family Psychology. 2006;20:680–689. doi: 10.1037/0893-3200.20.4.680. [DOI] [PubMed] [Google Scholar]
- Slep AM, O'Leary SG. Multivariate models of mothers' and fathers' aggression toward their children. Journal of Consulting and Clinical Psychology. 2007;75:739–751. doi: 10.1037/0022-006X.75.5.739. [DOI] [PubMed] [Google Scholar]
- Slep AMS, O'Leary SG. Parent and partner violence in families with young children: Rates, patterns, and connections. Journal of Consulting and Clinical Psychology. 2005;73:435–444. doi: 10.1037/0022-006X.73.3.435. doi:0.1037/0022-006X.73.3.435. [DOI] [PubMed] [Google Scholar]
- Stark S, Chernyshenko OS, Drasgow F. Detecting differential item functioning with confirmatory factor analysis and item response theory: Toward a unified strategy. Journal of Applied Psychology. 2006;91:1292–1306. doi: 10.1037/0021-9010.91.6.1292. [DOI] [PubMed] [Google Scholar]
- Steiger JH. Tests for comparing elements of a correlation matrix. Psychological Bulletin. 1980;87:245–251. doi: 10.1037//0033-2909.87.2.245. [DOI] [Google Scholar]
- Straus MA, Hamby SL, Finkelhor D, Moore DW, Runyan D. Identification of child maltreatment with the Parent-Child Conflict Tactics Scales: Development and psychometric data for a national sample of American parents. Child Abuse & Neglect. 1998;22:249–270. doi: 10.1016/S0145-2134(97)00174-9. [DOI] [PubMed] [Google Scholar]
Associated Data
This section collects any data citations, data availability statements, or supplementary materials included in this article.
Supplementary Materials
Table S1: Demographic Comparison of Study Samples to 2011 US Census Data for the County of Residence
Table S2: Item Parameters Derived from Graded Response Model IRT Analyses – Overreactivity and Laxness
Table S3: Item Parameters Derived from Graded Response Model IRT Analyses – Hostility
Table S4: IRT Parameters and DIF Tests for Women and Men