

Abstract
Neuroimaging methods have been employed to study cue‐reactivity‐induced neural correlates in the human brain. However, very few studies have focused on characterizing the dynamic neural responses to the factorial interactions between the cues and the subjects. Fifteen right‐handed heroin‐dependent subjects and 12 age‐matched nondrug using subjects participated in this study. Cue‐reactivity paradigms were employed, while changes in blood oxygenation level‐dependent (BOLD) signals were acquired by functional MRI (fMRI). The fMRI datasets were analyzed with AFNI software and repeated two‐way ANOVA was employed for factorial analyses. Neural correlates of factorial interactions between cue‐factor and subject‐factor were identified in the regions of the ventral tegmental area (VTA), the left and right amygdala, the left and right fusiform cortex, and the precuneus in the mesocorticolimbic system, and in the superior frontal, dorsal lateral prefrontal, and orbitofrontal cortices in the prefrontal cortex system. The neural response patterns in the prefrontal systems are dynamic: decreased response to neutral‐cues and increased response to heroin‐cues. Further, heroin‐cue‐induced neural responses within the subregions in the PFC system are significantly intercorrelated. In conclusion, the cue‐reactivity paradigms significantly activated the dynamic neural activations in the prefrontal system. It is suggested that the dynamic response patterns in the PFC system characterize the impaired brain control functions in heroin‐dependent subjects. Hum Brain Mapp, 2009. © 2008 Wiley‐Liss, Inc.
Keywords: craving, heroin addiction, human brain, fMRI, prefrontal cortex, amygdala
INTRODUCTION
Uncontrollable urges to obtain drugs and reduced behavioral response to natural rewards are some of the defining clinical characteristics of drug abuse. Recently, neuroimaging techniques have been used to study the neurobiological mechanisms responsible for the uncontrollable urges of drug use. Specifically, the cue‐reactivity paradigm has been widely employed in studying illegal drug use in human subjects, using functional MRI (fMRI) [Garavan et al., 2000; Maas et al., 1998; Wexler et al., 2001; Xiao et al., 2006] and PET methods [Childress et al., 1999; Daglish et al., 2001; Grant et al., 1996; Kilts et al., 2004, Bonson et al., 2002; Wang et al., 1999]. A set of neural correlates of cue‐induced drug urge in cocaine‐ or heroin‐dependents has been identified. These include the amygdala (Amy), the anterior cingulate cortex (ACC), the orbitofrontal cortex (OFC), and the prefrontal cortex (PFC). These regions form a distributed network linked to the cue‐induced drug drive [Wilson et al., 2004]. It was suggested that drug craving is not associated with a dedicated and unique neuroanatomical circuitry [Garavan et al., 2000]; rather, it is a “normal” neural circuitry activated to a greater degree to the drug‐related cues [Daglish et al., 2003]. However, the detailed dynamic characteristics of cue‐induced neural activities and their relationships with uncontrollable urges to obtain drugs are not clear.
Previous studies demonstrated that the decreased response sensitivity to the monetary reward in the dorsal lateral PFC in cocaine dependents was observed [Goldstein et al., 2007]. Similarly, a significantly low response to the GO–NOGO inhibition task was observed in the cocaine‐dependent subjects [Hester and Garavan, 2004]. Lack of response sensitivity to a functional task has been employed to predict relapse among methamphetamine‐dependent users [Paulus et al., 2005]. The lower the response sensitivity to a simple two‐choice task is the higher the rate to relapse. In other words, drug‐dependent subjects often give decreased neural responses to those nondrug rewarding tasks. On the other hand, drug‐dependent subjects often provide increased neural responses to cocaine‐ or heroin‐related cues [Garavan et al., 2000; Maas et al., 1998; Wexler et al., 2001; Xiao et al., 2006]. These results lead us to hypothesize that the cue‐reactivity paradigms will induce a dynamic neural response pattern: significantly decreased neural responses to the neutral‐cues and significantly increased neural responses to the heroin‐cues in the prefrontal cortex (PFC) regions. This pattern of dynamic neural activities in PFC systems may characterize the impaired brain control functions in the heroin‐dependent subjects.
The majority of the previous neuroimaging studies on cocaine and heroin cues only recruited one group of subjects—the drug‐dependents [Bonson et al., 2002, Daglish et al., 2001; Wang et al., 1999; Xiao et al., 2006]. Therefore, it is not known if the identified neural responses to heroin cues also occurred in nondrug users. In other words, there is no study that focuses on those neural responses to factorial interactions between heroin cues and heroin dependents. In the present study, we will identify neural substrates in which the cue‐induced neural activations are subject dependent. Also, we will characterize the patterns of the neural responses in these brain regions. We recruited heroin‐dependent subjects and nondrug‐using subjects for this study, because neuroimaging rarely has been used to investigate opioid dependence [Daglish et al., 2001; Sell et al., 1999; Xiao et al., 2006].
METHODS AND MATERIALS
Participating Subjects
Fifteen right‐handed heroin‐dependent subjects, 13 males and two females (32.2 ± 3.8 years old with 9 ± 2 years education), who were inpatients at Beijing AnKang Hospital (Beijing, China), and 12 age‐matched generally healthy right‐handed nondrug using male subjects (31.2 ± 5.3 years old with 10.2 ± 2 years education) participated in this study. The exclusion criteria for the heroin‐dependent group were as follows: current or psychiatric diseases other than heroin dependence; past or present history of neurological, cardiovascular, or endocrinological disease; history of head trauma leading to loss of consciousness >30 min; and current medical illness and dependence or abuse on any substance other than heroin. Special care was taken to exclude subjects who abused or were addicted to alcohol or drugs other than heroin and nicotine. All heroin dependents are cigarette smokers, but they were smoking abstinent at least for 4 h before fMRI scanning. In the heroin‐dependent group, each subject met the DSM‐IV criteria for heroin dependence and had a positive urine test for opiate use before entering the hospital [American Psychiatry Association, 2003]. These heroin‐dependent subjects had an average history of 4.6 ± 2.5 years of heroin use, ranging from 2 months to 8 years. These subjects had been detoxified on a ward in the Beijing AnKang Hospital and were abstinent for at least 1 week (range 1–4 weeks) before fMRI scans were performed. After completion of the fMRI study, they were escorted back to the hospital. The 12 nondrug using subjects did not have family history of drug dependence. However, seven of the 12 nondrug using subjects were cigarette smokers. The experimental protocol was approved by the Beijing Institute of Basic Medical Science and the Beijing AnKang Hospital. Individual written informed consent was obtained after the procedures had been fully explained.
MRI Scans
All fMRI experiments were performed using a 1.5T GE Signa LX scanner located at the PLA General Hospital in Beijing. Each subject's head was placed comfortably inside a birdcage RF head coil with foam padding to minimize the involuntary head movement during the scans. Each subject participated in one scanning session that contained one high‐resolution anatomical scan (12 min) and two fMRI scans (12 min each). The whole scanning session lasted about 1 h including times for shimming field homogeneity, setting up scan parameters, time for localizer scans, time for data reconstructing and transferring between scans, and time for subject‐set up and off‐loading. Following a localizer, a high‐resolution anatomical scan with 3‐D SPGR sequence was acquired for image registration. The fMRI scans were acquired with a single‐shot gradient‐recalled echo planar imaging (EPI) sequence. The imaging parameters were as follows: TE of 30 ms, TR of 2 s, FOV of 24 cm, matrix size of 64 × 64, slice thickness of 5 mm without spacing. Twenty five slices were acquired in an oblique‐axial orientation with the aid of sagittal localizer images to yield whole‐brain coverage. The two fMRI scans were acquired with a block‐design paradigm and with two different video tapes. One neutral video tape consisted of three concatenated portions: (1) a 3‐min baseline video, (2) a 4‐min neutral‐cue video, and (3) a 5‐min baseline video again. Another heroin‐cue video tape also consisted of three concatenated portions, except that the second portion of the video tape was replaced by a 4‐min heroin‐cue video.
The approach to making these cues‐related films was basically similar to that used by Childress et al. [1999], Grant et al. [1996], and Garavan et al. [2000], except that the cues in these films, such as environmental context and paraphernalia, were specific to the metropolitan Beijing area. These films have been reviewed by several former and current heroin users to ensure authenticity. Based on feedback and repeated modification, these films were edited to have a consistent distribution of cravings for more addicts. A visual fixation point was present throughout the film. Specifically, the baseline video consisted of far‐sighted scenic mountain views, which provided a pleasant and relaxed ambience. A neutral‐cue video consisted of people performing physical exercise, sightseeing, touring scenic gardens and parks, and fishing. A heroin‐cue video consisted of two people simulating heroin use, heroin powder, 100 Yuan bill, heroin‐related paraphernalia, flowers of an opioid plant, an addict who was “chasing the dragon,” intravenous drug use, etc. The presentation order of the neutral video and the heroin video was counter‐balanced across subjects.
Subjects' craving, as induced by heroin‐related cues, were assessed by an 11‐point Likert‐type scale (with “0” indicating “complete dislike” and “10” indicating “extreme like”), which focused on the subjects' responses to the film. The scale was administered immediately after the scans had been completed. A Mann‐Whitney U test was employed to determine the effects of the cues in the behavioral measures and assess the differences between the controls and addicted subjects.
Data Analysis
The image processing and statistical analysis were conducted with AFNI software package [Cox, 1996]. One heroin‐dependent subject was excluded from the analysis because of the technical problems in the data acquisition. The fMRI images and the SPGR anatomical images for each subject were coregistered. After motion detection and correction with motion criteria of less than 1‐mm movement and less than 1° rotation, five heroin‐dependent subjects and three non‐drug users were excluded for further analysis. The final datasets contained nine nondrug users (nine males, 32.2 ± 5.9 years old with 9.8 ± 2.9 years education) and nine heroin‐dependent subjects (eight males and one female, 33.6 ± 4.3 years old with 8.4 ± 1.8 year education, heroin use duration 4.6 ± 0.9 years, heroin abstinent for 3 ± 0.7 weeks before fMRI scans were performed.
The voxel time courses were linearly detrended and low‐pass filtered (freq < 0.02 Hz) to improve the quality of nonlinear fitting in the following fitting step. After the preprocessing, the voxel time series was fitted to a beta function model with a linear trend baseline. The onset time of the beta model was constrained to occur within a range of 0–1.5 min, which is a reasonable range of starting time for neuronal responses to the cue after video onset [Garavan et al., 2000]. The other parameters of the beta model were loosely constrained to find the best fitting model for each voxel time series. The activity of each voxel was expressed by the percentage of the area‐under‐the‐curve (AUC%) relative to the area‐under‐the‐baseline. The map of the AUC% for each subject was then converted to standard Talairach space and spatially smoothed with an FWHM of 4‐mm isotropic Gaussian kernel before entering the group statistical test.
After the fMRI datasets were preprocessed, the AUC% values of individual subjects were laid out on a voxel‐by‐voxel basis. Based on the two‐by‐two factorial design, the analyses of the main effect and interaction were performed with two factors: A (cue type) and B (subject type). The factor A has two levels of neutral (A1) and heroin‐cues (A2) and the factor B has two levels comprised of nondrug user (B1) and heroin‐dependent (B2). The four factorial levels of A1B1, A2B1, A1B2, and A2B2 are the four experimental conditions (two‐by‐two design). The measured AUC% values for the kth subject are the vector
where Yij k (i = A1, A2 and j = B1 and B2) is taken as a single‐dependent variable.
We consider a repeated measures model, with mean observation vector
where μ11, μ12, μ21, and μ22 are the mean responses for the combinations of factor levels A1B1, A1B2, A2B1, and A2B2, respectively. We are interested in determining whether there is an interaction between factors A and B (i.e., whether the indication of different subject groups influences the reaction to the cue type), which is tested by:
or, equivalently:
In practice, the nonparametric statistical tests are more robust than traditional parametric tests for a small sample size and a non‐normally distributed sample. To implement the factorial interaction test, a two‐step analysis was introduced. First, a linear contrast was formed: A2 vs. A1, regardless of Level B. That is (μ21 vs. μ11) or (μ22 − μ12). The contrast was estimated for each subject by finding the AUC% difference between the heroin‐cue run and neutral run. Second, we adopted a two‐sample Wilcoxon Signed‐Rank Test for group comparison. This test was used to determine if the effect of the different cue type depends on the subject factor, i.e. H o: μ12 − μ11 = μ22 − μ21. The test results were then thresholded at P < 0.05 for activated regions, corrected for multiple comparisons (individual voxel threshold at P < 0.03, cluster size > 351 μl). The clustering parameters were determined using the Monte Carlo simulation of simultaneous statistical testing (Alphasim program).
The identified neural regions (ROIs) involved in the factorial interaction were masked to create a map called the interaction map (I‐MAP). The maximum intensity projection (MIP) map was generated by overlaying the I‐MAP to a glass‐brain template from SPM2 (http://www.fil.ion.ucl.ac.uk/spm/software/spm2) using MATLAB (The MathWorks) The voxelwise AUC% values were averaged over each individual ROI in the I‐MAP to obtain the regional AUC% values. The Tukey's Post Hoc Test was employed at a significance level of P < 0.01 for all pairwise multiple comparisons of ROI AUC% values among four factorial levels (A1B1, A1B2, A2B1, and A2B2) on an ROI‐by‐ROI basis. To study the differences in AUC% between the four factorial levels over all ROIs, a paired t‐test was employed with corrections for multiple comparisons.
RESULTS
The results from the 2 × 2 factorial analysis showed that there was a significant factorial interaction effect between the cue‐type factor and the subject‐type factor in the regions of the left and right orbitofrontal cortex (OFC) (BA 47), the left middle frontal cortex (BA 6), the right middle frontal cortex (BA 10), the left and right superior frontal cortex (BA 9, 10, and 48), the left (BA 37) and right (BA 21) middle temporal cortex, the right middle occipital cortex, the right precuneus (BA 7), the left and right fusiform cortex (BA 19), the left and right amygdala, the left lentiform nucleus/putaman, the VTA, the left and right declive (cerebellum), and the left and right lingual cortex. The detailed activated positions (x, y, z) in the Talairach space and activated brain volumes are listed in Table I. These interactive regions are further presented with the maximum intensity projection (MIP) map (glass brain), as shown in Figure 1.
Table I.
Human brain regions (P < 0.05 after clustering) activated by the factorial interaction
| Brodmann area (BA) | X (LR) | Y (PA) | Z (IS) | Cluster volume (mm3) | Max PFI in AUC% | P value | |
|---|---|---|---|---|---|---|---|
| Factorial interaction between the cue‐type factor and the subject‐type factor | |||||||
| L orbitofrontal cortex | BA47 | −39 | 28 | −16 | 535 | 0.51 | <0.002 |
| L orbitofrontal cortex | BA47 | −47 | 24 | −4 | 1,089 | 0.23 | <0.001 |
| R orbitofrontal cortex | BA47 | 50 | 20 | −7 | 384 | 0.46 | <0.01 |
| R orbitofrontal cortex | BA47 | 31 | 27 | −21 | 622 | 0.44 | <0.001 |
| L middle frontal cortex | BA6 | −21 | 20 | 54 | 372 | 0.19 | <0.01 |
| L superior frontal cortex | BA48 | 0 | 25 | 49 | 1,566 | 0.31 | <0.001 |
| R middle frontal cortex | BA10 | 41 | 39 | 22 | 569 | 0.22 | <0.002 |
| R superior frontal cortex | BA9/10 | 7 | 56 | 32 | 454 | 0.28 | <0.003 |
| L middle temporal cortex | BA37 | −46 | −65 | 4 | 628 | 0.19 | <0.001 |
| R middle temporal cortex | BA21 | 56 | −49 | 7 | 850 | 0.19 | <0.001 |
| R middle occipital cortex | BA19 | 24 | −94 | 1 | 1,612 | 0.23 | <0.001 |
| R middle occipital cortex | BA19 | 35 | −79 | −1 | 1,587 | 0.35 | <0.001 |
| R precuneus | BA7 | 3 | −66 | 49 | 482 | 0.41 | <0.003 |
| R fusiform cortex | BA19 | 33 | −85 | −12 | 342 | 0.29 | <0.05 |
| R fusiform cortex/cerebellum | 47 | −58 | −25 | 3,601 | 0.75 | <0.001 | |
| L amygdala | −17 | −3 | −16 | 315 | 0.28 | <0.05 | |
| R amygdala | 21 | 2 | −13 | 442 | 0.26 | <0.003 | |
| L lentiform nucleus/putamen | −26 | 8 | −5 | 393 | 0.16 | <0.01 | |
| VTA | −5 | −17 | −14 | 219 | 0.17 | <0.05 | |
| L fusiform cortex | −25 | −81 | −11 | 6,736 | 0.23 | <0.001 | |
| R fusiform cortex | 22 | −78 | −13 | * | 0.19 | ||
| L lingual cortex | −24 | −81 | −10 | * | 0.24 | ||
| R lingual cortex | 22 | −76 | −10 | * | 0.17 | ||
| L cerebellum | −1 | −74 | −22 | * | 0.34 | ||
| R cerebellum | 2 | −76 | −22 | * | 0.38 | ||
| R fusiform cortex | 51 | −55 | −18 | 3,601 | 0.39 | <0.001 | |
| R cerebellum | 47 | −58 | −25 | * | 0.75 | ||
The maximum peak activations for factorial interactions (Max PFI) in each region were expressed in AUC%, calculated by (μ22 − μ12) − (μ21 − μ11). P value was significance from the cluster analysis in each region. An asterisk refers to an activation site (in the Talairach space) that belongs to a large cluster listed in the row directly above. The brain regions, cluster volumes, the max PFI AUC%, p values, and the x, y, and z coordinates were presented in the same way as in Table I in the main text.
Figure 1.
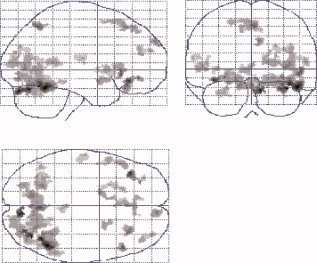
The brain regions activated from the factorial interactions. These regions were presented with the maximum intensity projection (MIP) method and shown on a glass‐brain template from SPM2. [Color figure can be viewed in the online issue, which is available at www.interscience.wiley.com.]
Figures 2 and 3 show the individual regions of the factorial interactions, along with the regional neural activations at the four factorial levels of A1B1, A1B2, A2B1, and A2B2. Figure 3 shows the factorial interactions specifically in the PFC regions. The results from Tukey's test, used to assess the significances between these factor levels in individual regions, are provided in Table II. In the column of A1B2 vs. A1B1, the regional neural responses to the neutral cues in the PFC systems showed significantly decreased activity, signed with (−), in the heroin‐dependent subjects in comparison with the nondrug‐using subjects. There were no significant differences, signed with (ns) in regions of the right precuneus, the left and right fusiform cortex, and VTA between the groups of subjects. In the column A2B2 vs A2B1, in contrast, the majority of regional responses to the heroin‐cues in the PFC and the mesocorticolimbic (MCL) systems showed a significant increase, signed with (+), in the heroin‐dependent subjects compared with the nondrug users, except in the regions of the right middle PFC and the left Amy. In the column of A2B2 vs. A1B2, all regional activities in the PFC systems and other regions with factorial interactions showed significantly increased responses to the heroin‐cues than the neutral‐cues. Figure 4 shows the averaged neural activations over ROIs in the PFC regions at four factorial levels of A1B1, A1B2, A2B1, and A2B2. The paired t‐test (two‐tail with multiple comparison correction) showed that the neural activity at the A2B2 level was significantly higher than at the levels of A1B2 (t = 2.887, P < 0.01) and A2B1 (t = −2.326, P < 0.03) factor levels. The neural activity at the A1B1 level was significantly higher than at the A1B2 level (t = 3.078, P < 0.007). There were no significant differences between the A1B1 level and the A2B1 level, between A1B1 level and A2B2 level, or between A1B2 level and A2B1 level. Further analysis showed that the intensity difference between (A2B1 − A1B1) and (A2B2 − A1B2) was significantly different (−0.037 ± 0.064 vs. 0.124 ± 0.09, t = 3.995, P < 0.001) over all five ROIs in the PFC regions.
Figure 2.
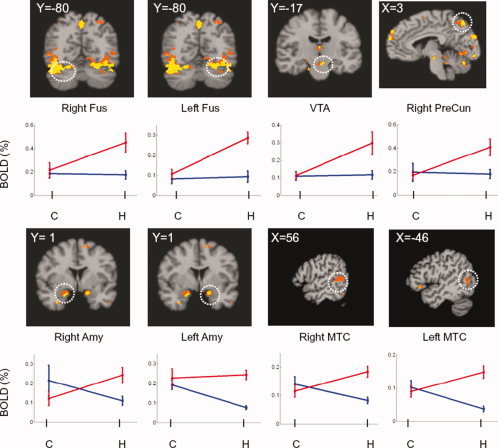
Activation maps resulting from factorial interactions and their corresponding BOLD signals at four factorial levels in individual regions of interest (ROI). The white circles in the maps indicate the regions with factorial interactions. The y‐axis represents the BOLD signal and x‐axis represents the subject‐factor for control subjects (C) and heroin‐dependent subject (H). The blue lines indicate the BOLD signals induced by the neutral‐cue and the red lines by the heroin‐cues. OFC, orbitofrontal cortex; Amy, amygdala; VTA, ventral tegmental area; FUS, fusiform cortex; PreCun, precuneus; MTC, middle temporal cortex. The regional significances of multiple paired t‐tests between four factorial levels were presented in Table II. The values of X and Y coordinates in the activation maps were the locations of the slices in the Talairach space.
Figure 3.
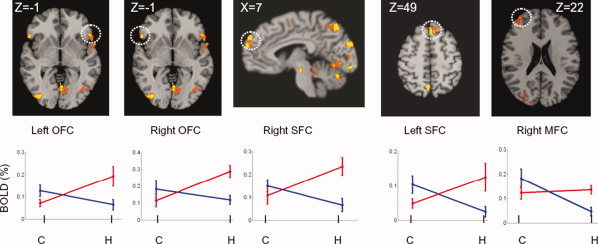
Activation maps resulting from factorial interactions and their corresponding BOLD signals at four factorial levels in the PFC regions. MFC, Middle frontal cortex; SFC, superior frontal cortex. All other illustrations were the same as described in Figure 2.
Table II.
The significance from the paired Tukey's test between the four factorial levels of A1B1, A1B2, A2B1, and A2B2
| Brain regions | A1B2 vs. A1B1 | A2B2 vs. A2B1 | A2B2 vs. A1B2 | A1B1 vs. A2B1 | A2B2 vs. A1B1 | A1B2 vs. A2B1 |
|---|---|---|---|---|---|---|
| Prefrontal system | ||||||
| L orbitofrontal cortex | − | + | + | + | + | ns |
| R orbitofrontal cortex | − | + | + | + | + | ns |
| L superior frontal cortex | − | + | + | + | ns | ns |
| R superior frontal cortex | − | + | + | + | ns | ns |
| R middle frontal cortex | − | ns | + | + | + | − |
| Impulsive system | ||||||
| L middle temporal cortex | − | + | + | + | ns | − |
| R middle temporal cortex | − | + | + | + | ns | − |
| R precuneus | ns | + | + | ns | + | ns |
| L fusiform cortex | ns | + | + | ns | + | ns |
| R fusiform cortex | ns | + | + | ns | + | ns |
| L amygdala | − | ns | + | ns | + | − |
| R amygdala | − | + | + | + | ns | ns |
| VTA | ns | + | + | ns | + | ns |
The A1 and A2 represent the factor levels of neutral‐cues and heroin‐cues, respectively. The B1 and B2 represent the factor levels of nondrug use group and heroin‐dependent group, respectively. In each pair (column) of comparison, the sign (+) indicates that the neural responses are significantly higher in the first factor level than the second; the sign (−) indicates significantly lower. The sign (ns) indicates not significant. The significant level is set at P < 0.01 with multiple comparison correction.
Figure 4.
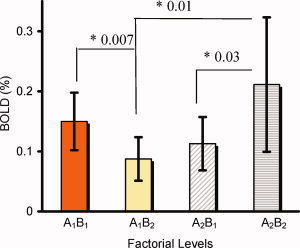
The averaged neural activations (BOLD%) at four factorial levels of A1B1, A1B2, A2B1, and A2B2 over the left and right OFC, the left and right SFC, and the right MFC in the PFC system. The multiple paired t‐test revealed that the BOLD signal at the A2B2 level was significantly higher than that at A1B2 (P < 0.01) and A2B1 (P < 0.03) levels. The BOLD signal at the level of A1B1 was significantly higher than that at the level of A1B2 (P<0.007). The difference in BOLD signals between the levels of (A2B2 − A1B2) was significantly greater than that of (A2B1 − A1B1) (P < 0.001). [Color figure can be viewed in the online issue, which is available at www.interscience.wiley.com.]
Although no online, real‐time subjective behavioral ratings were performed, subjects were asked to rate their subjective responses to the video films immediately after the fMRI scans were completed. On a zero to 10 scale (0 = complete dislike, 10 = extreme like), the heroin‐cue video, versus the neutral video, had a significantly higher heroin craving in experienced heroin users than the nondrug users (P < 0.05).
Considering the possible difference between men and women in terms of neural correlates of heroin craving in heroin‐dependent subjects, one female heroin‐dependent subject was excluded and data were reanalyzed with all male participants (nine control subjects and eight heroin‐dependent subjects). The results are presented in Table I and Figures 2(b) and 3(b) as supplemental materials. No significant differences were observed by excluding or including this female subject, possibly because insignificant female subjects were involved in this study.
DISCUSSION
Neural Correlates of Factorial Interaction Between the Cue‐Factor and Subject‐Factor
As introduced earlier, previous studies only recruited heroin‐dependent subjects and only the differences in neural responses to different cue‐reactivity paradigms could be detected [Bonson et al., 2002; Daglish et al., 2003, Xiao et al., 2006; Wang et al., 1999]. It is not known if these differences in neural responses to those cues also occur in nondrug‐using subjects. In a few studies, although nondrug‐using subjects were recruited for study, no factorial interactions were reported [Garavan, 2000, Wexler et al., 2001]. One of the major findings in this study is the identification of the regions representing factorial interactions that indicate regional neural activations induced by heroin‐cues linked with the heroin‐dependent subjects. These brain regions can be categorized into two separate, but interacting neural systems. The VTA, the left and right amygdala, the left and the right fusiform cortex, and the precuneus, as well as cerebellum fit into the MCL system. The superior, middle and inferior frontal cortex regions fit into the PFC system. These results suggest that uncontrollable urges to obtain drugs are a result of the synergism of two distinct mechanisms: abnormal activation enhancement related to the MCL system dysfunction, and inhibitory control impairment tied to prefrontal cortex dysfunction [Bechara, 2005; Jentsch and Taylor, 1999].
Dynamic Neural Responses to Cue‐Reactivity Paradigms in the PFC System
Another major finding in the present study is the discovery of the dynamic neural response patterns to cue‐reactivity paradigms in the PFC system. The term “dynamic” means two different ways of activation toward heroin‐ and neutral cues. For simplified discussion, each neural activation (BOLD%) at four factorial levels of A1B1, A1B2, A2B1, and A2B2 over each region of the left and right OFC, the left and right SFC, and the right MFC was combined as an overall neural responses in the PFC system. We use the analogy of a two‐sided coin to state the dynamic characteristics. On the one side, when the heroin‐dependent subjects were watching the neutral‐cues, the neural response level in the PFC systems was the lowest among the four factorial levels (the level A1B2 in Fig. 4). As shown in Figure 4, for the same neutral‐cues, the heroin‐dependent subjects have the lowest BOLD activation level of (0.09 ± 0.03)% versus (0.15 ± 0.05)% for the control subjects (P < 0.007). The regional neural responses to the neutral‐cues, as a pairwised comparison between A1B2 and A1B1 listed in Table II, were significantly lower (with a negative sign) in heroin‐dependent subjects than in nondrug‐using subjects. These results suggested that the heroin‐dependent subjects have lower homeostatic baseline levels compared with the normal subjects, and the neutral cues were not strong enough to raise the homeostatic state to the normal level. These results may support the previous hypothesis of the hedonic homeostatic dysregulation and changes in “hedonic set point” in addicted subjects [Ahmed and Koob, 1998; Koob and Le Moal, 1997]. These are exactly the reasons why one should not compare only heroin cues between controls and heroin dependent subjects. It is more accurate to compare the difference of heroin and neutral cues between controls and heroin‐dependent subjects.
On the other hand, when the heroin‐dependent subjects were watching the heroin‐cues, neural response levels at the A2B2 factorial level in the PFC system were the highest among the four factorial levels, as shown in Figure 4 and listed in Table II. The activations in the fusiform cortex are intriguing, since the heroin‐cues activated large clusters in both left and right fusiform areas, as shown in Figure 2. A recent study has shown that the fusiform cortex represents the neural correlates involved in episodic memory retrieval (recollection) activity [Johnson and Rugg, 2007]. For heroin‐dependent subjects, heroin‐cues can induce recollections of heroin‐taking and ‐seeking episodes. Such content‐specific recollection may reflect the reinstatement of processes, resulting in fusiform activation. The activations in the VTA, precuneus, and amygdala suggest that the dopaminergic system was activated by the conditioned heroin‐cues. This is consistent with results from animal models, in which cocaine‐conditioned rats experienced dopamine release, resulting in drug reinstatement [Antkiewicz‐Michaluk et al., 2006; Phillips et al., 2003; Xi et al., 2006]. It has been demonstrated that dopamine activation can attenuate prefrontal cortical suppression of sensory input to the basolateral amygdala in rats [Rosenkranz and Grace, 2001]. Translationally, such drug‐cue‐induced neural responses have been employed to predict relapse among alcoholics [Grüsser et al., 2004]. When those alcoholics were presented with alcohol‐associated cues, the response sensitivity in the regions of the putamen, anterior cingulated, and medial prefrontal cortex, predicted relapse. The higher the cue‐induced activity is, the higher the chance to relapse.
Further data analysis revealed how powerful the heroin‐cue‐induced neural responses were and suggested that the uncontrollable drug‐taking and ‐seeking behaviors may be driven by significantly strong neural signals [Everitt and Robbins, 2005]. As shown in Figure 4, when the nondrug‐using subjects were watching the heroin‐cues and neutral‐cues, the difference in the BOLD responses (BOLDA2B1 − BOLDA1B1) was very small (0.037 ± 0.064)%. However, when the heroin‐dependent subjects were watching these cues, the difference (BOLDA2B2 − BOLDA1B2) was (0.124 ± 0.090)%. This is significantly larger than that of nondrug users (t = 3,995, P< 0.001). Tobler et al. [2005] found that cues acquire the ability to activate dopamine release in the brain as an error signal between reward and expected reward through Pavlovian learning. It is plausible that the observed large signal difference associated with the heroin‐cues may reflect a similar signal, which may lead to relapse.
Exploratory Correlation Analyses Between Neural Activities in the Discrete Subregions of the PFC and VTA
In studying the interaction between the regions of factorial interactions, it is interesting to note that both the activations in VTA and subregions of the PFC showed positive correlation (P < 0.05). Both activations in the PFC subregions and the VTA strongly support a dopaminergic hypothesis that the PFC activities are highly influenced by the dopaminergic activity [Floresco and Magyar, 2006]. The observed lower signals in the PFC system to the neutral cues are similar. Recent studies indicate that the lower neural responses in the PFC regions to Go/No‐Go Task [Hester and Garavan, 2004] and decreased prefrontal cortical sensitivity to monetary rewards [Goldstein et al., 2007] may reflect the depressed dopaminergic activity in cocaine users. The higher neural responses to heroin‐cues in the PFC may reflect the conditioned increase in dopaminergic activity [Antkiewicz‐Michaluk et al., 2006; Phillips et al., 2003; Xi et al., 2006]. It is further suggested that these significant activations in the VTA and the PFC may reflect the “gating” mechanisms of the control function of the PFC. In other words, the control system is hijacked by the impulsive system [Miller and Cohen, 2001]. It should be pointed out that, although we emphasize that the dopaminergic abnormality could mediate the PFC functions, other neurotransmitter systems, such as glutamatergic, noradrenergic, cholinergic, and GABAergic systems may also regulate the PFC functions. It is suggested that future PET studies may be needed to address which neurotransmitters are involved.
Besides examining the significant activations in the PFC and VTA, it would be interesting to explore if the heroin‐cue‐induced activations within the activated PFC subregions are working in concert. Within the heroin group, the neural responses to heroin‐cues in the right middle PFC were intercorrelated significantly within the subregions of the PFC system, as shown in Figure 5. According to a control theory reviewed by Miller and Cohen [2001], the PFC must provide a source of activation as “active memory in service of control.” For example, the observed Amygdala‐OFC activation induced by the heroin‐cues in the present study may represent the high motivation value and strong expectation of drug use [Gottfried et al., 2003; Kufahl et al., 2007; Schoenbaum et al., 2003]. In addition, the heroin‐cue‐induced activations were significantly intercorrelated in the regions of the dorsal lateral PFC and the OFC and the SFC. It is plausible that these intercorrelated activities in these discrete regions of the PFC, may provide a high capacity for integration and maintenance against distractions until the goal of drug‐seeking and ‐taking is achieved. Traditionally, this behavior is considered “loss of control.” In our view, the brains of heroin‐dependent subjects are highly controlled by these biased intercorrelated activities elicited by heroin‐cues in the PFC system.
Figure 5.
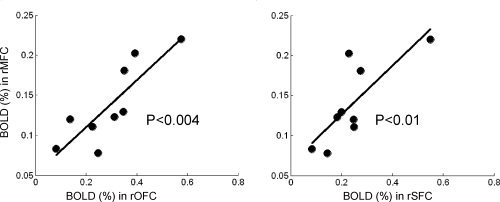
Representative plots of intercorrelations of activated BOLD signals among the PFC subregions when heroin‐dependent subjects were watching heroin‐cues. The BOLD signals in the rMFC were significantly correlated with that in the rOFC (P < 0.004) and the rSFC (P < 0.01), as shown in correlation‐plots, respectively. Similarly, the rOFC correlated with lSFC (P < 0.01), rSFC (P < 0.01), and lOFC (P < 0.03); the lOFC correlated with lSFC (P < 0.001) and rSFC (P < 0.0004); the rSFC correlated with the lSFC (P < 0.002) (The correlation plots are not shown).
Supporting information
Additional Supporting Information may be found in the online version of this article.
Table 1(b). Human brain regions (P <0.05 after clustering) activated by the factorial interactions obtained from all male participants. The brain regions, cluster volumes, the max PFI AUC%, p values, and the x, y, and z coordinates were presented in the same way as in Table 1 in the main text.
Figure 2(b). Activation maps resulting from factorial interactions obtained from all male participants. The colors, the white cycles, and the x, y, and z coordinates were presented in the same way as in Fig. 2 in the main text.
Figure 3(b). Activation maps resulting from factorial interactions obtained from all male participants. The colors, the white cycles, and the x, y, and z coordinates were presented in the same way as in Fig. 3 in the main text.
Acknowledgements
We thank Mr. B. Douglas Ward, MS, for useful statistical discussions, and Ms. Carrie O'Connor, MA, for editorial assistance.
REFERENCES
- Ahmed SH,Koob GF ( 1998): Transition from moderate to excessive drug intake: Change in hedonic set point. Science 282: 298–300. [DOI] [PubMed] [Google Scholar]
- American Psychiatric Association ( 2003): Diagnostic and Statistical Manual of Mental Disorder, 4th ed, Text Revision. Washington, DC: American Psychiatric Association. [Google Scholar]
- Antkiewicz‐Michaluk L,Filip M,Michaluk J,Romanska I,Patsenka A,Papla I,Przegalinski E,Vetulani J ( 2006): Conditioned rewarding stimulus associated with cocaine self‐administration reverses the depression of catecholamine brain systems following cocaine withdrawal in rats. Int J Neuropsychopharmacol 9: 37–50. [DOI] [PubMed] [Google Scholar]
- Bechara A ( 2005): Decision making, impulse control and loss of willpower to resisit drugs: A neurocogitive perspective. Nature Neurosci 8: 1458–1463. [DOI] [PubMed] [Google Scholar]
- Bonson KR,Grant SJ,Contoreggi CS,Links JM,Metcalfe J,Weyl HL,Kurian V,Ernst M,London ED ( 2002): Neural systems and cue‐induced cocaine craving. Neuropsychopharmacology 26: 376–386. [DOI] [PubMed] [Google Scholar]
- Childress AR,Mozley PD,McElgin W,Fitzgerald J,Reivich M,O'Brien CP ( 1999): Limbic activation during cue‐induced cocaine craving. Am J Psychiatry 156: 11–18. [DOI] [PMC free article] [PubMed] [Google Scholar]
- Cox RW ( 1996): AFNI: Software for the analysis and visualization of functional magnetic resonance images. Comput Biomed Res 29: 162–173. [DOI] [PubMed] [Google Scholar]
- Daglish MR,Weinstein A,Malizia AL,Wilson S,Melichar JK,Britten S, et al. ( 2001): Changes in regional cerebral blood flow elicited by craving memories in abstinent opiate‐dependent subjects. Am J Psychiatry 158: 1680–1686. [DOI] [PubMed] [Google Scholar]
- Daglish MR,Weinstein A,Malizia AL,Wilson S,Melichar JK,Lingford‐Hughes A,Myles JS,Grasby P,Nutt DJ ( 2003): Functional connectivity analysis of the neural circuits of opiate craving: "More" rather than "different"? Neuroimage 20: 1964–1970. [DOI] [PubMed] [Google Scholar]
- Everitt BJ,Robbins TW ( 2005): Neural systems of reinforcement for drug addiction: From actions to habits to compulsion. Nat Neurosci 8: 1481–1489. [DOI] [PubMed] [Google Scholar]
- Floresco SB,Magyar O ( 2006): Mesocortical dopamine modulation of executive functions: Beyond working memory. Psychopharmacology (Berl) 188: 567–585. [DOI] [PubMed] [Google Scholar]
- Garavan H,Pankiewicz J,Bloom A,Cho J‐K,Sperry L,Ross TJ,Salmeron BJ,Risinger R,Kelley D,Stein EA ( 2000): Cue‐induced cocaine craving: neuroanatomical specificity for drug users and drug stimuli. Am J Psychiatry 157: 1789–1798. [DOI] [PubMed] [Google Scholar]
- Goldstein RZ,Alia‐Klein N,Tomasi D,Zhang L,Cottone LA,Maloney T,Telang F,Caparelli EC,Chang L,Ernst T,Samaras D,Squires NK,Volkow ND ( 2007): Is decreased prefrontal cortical sensitivity to monetary reward associated with impaired motivation and self‐control in cocaine addiction? Am J Psychiatry 164: 43–51. [DOI] [PMC free article] [PubMed] [Google Scholar]
- Gottfried JA,O'Doherty J,Dolan RJ ( 2003): Encoding predictive reward value in human amygdala and orbitofrontal cortex. Science 301: 1104–1107. [DOI] [PubMed] [Google Scholar]
- Grant S,London ED,Newlin DB ( 1996): Activation of memory circuits during cue‐clicited cocaine craving. Proc Natl Acad Sci USA 93: 12040–12045. [DOI] [PMC free article] [PubMed] [Google Scholar]
- Grüsser SM,Wrase J,Klein S,Hermann D,Smolka MN,Ruf M,Weber‐Fahr W,Flor H,Mann K,Braus DF,Heinz A ( 2004): Cue‐induced activation of the striatum and medial prefrontal cortex is associated with subsequent relapse in abstinent alcoholics. Psychopharmacology 175: 296–302. [DOI] [PubMed] [Google Scholar]
- Hester R,Garavan H ( 2004): Executive dysfunction in cocaine addiction: Evidence for discordant frontal, cingulate, and cerebellar activity. J Neurosci 24: 11017–11022. [DOI] [PMC free article] [PubMed] [Google Scholar]
- Jentsch JD,Taylor JR ( 1999). Impulsivity resulting from frontostrial dysfunction in drug abuse: Implications for the control of behavior by reward‐related stimuli. Psychopharmacology 146: 373–390. [DOI] [PubMed] [Google Scholar]
- Johnson JD,Rugg MD ( 2007): Recollection and the reinstatement of encoding‐related cortical activity. Cereb Cortex 17: 2507–2515. [DOI] [PubMed] [Google Scholar]
- Kilts CD,Gross RE,Ely TD,Drexler KP ( 2004): The neural correlates of cue‐induced craving in cocaine‐dependent women. Am J Psychiatry 161: 233–241. [DOI] [PubMed] [Google Scholar]
- Koob GF,Le Moal M ( 1997): Drug abuse: Hedonic homeostatic dysregulation. Science 278: 52–58. [DOI] [PubMed] [Google Scholar]
- Kufahl P,Li Z,Risinger R,Rainey C,Piacentine L,Wu G,Bloom A,Yang Z,Li S‐J ( 2008): Expectation modulates human brain responses to acute cocaine: An FMRI study. Biol Psychiatry 63: 222–230. [DOI] [PubMed] [Google Scholar]
- Maas LC,Lukas SE,Kaufman MJ,Weiss RD,Daniels SL,Rogers VW,Kukes TJ,Renshaw PF ( 1998): Functional magnetic resonance imaging of human brain activation during cue‐induced cocaine craving. Am J Psychiatry 155: 124–126. [DOI] [PubMed] [Google Scholar]
- Miller EK,Cohen JD ( 2001): An integrative theory of prefrontal cortex function. Annu Rev Neurosci 24: 167–202. [DOI] [PubMed] [Google Scholar]
- Paulus MP,Tapert SF,Schuckit MA ( 2005): Neural activation patterns of methamphetamine‐dependent subjects during decision making predict relapse. Arch Gen Psychiatry 62: 761–768. [DOI] [PubMed] [Google Scholar]
- Phillips PEM,Stuber GD,Helen MLAV,Wightman RM,Carelli RM ( 2003): Subsecond dopamine release promotes cocaine seeking. Nature 422: 614–618. [DOI] [PubMed] [Google Scholar]
- Rosenkranz JA,Grace AA ( 2001): Dopamine attenuates prefrontal cortical suppression of sensory inputs to the basolateral amygdala of rats. J Neurosci 21: 4090–4103. [DOI] [PMC free article] [PubMed] [Google Scholar]
- Schoenbaum G,Setlow B,Saddoris MP,Gallagher M ( 2003): Encoding predicted outcome and acquired value in orbitofrontal cortex due cue sampling depends on input from basolateral amygdala. Neuron 39: 855–867. [DOI] [PubMed] [Google Scholar]
- Sell LA,Morris J,Bearn J,Frackowiak RS,Friston KJ,Dolan RJ ( 1999): Activation of reward circuitry in human opiate addicts. Eur J Neurosci 11: 1042–1048. [DOI] [PubMed] [Google Scholar]
- Tobler PN,Fiorillo CD,Schultz W ( 2005): Adaptive coding of reward value by dopamine neurons. Science 307: 1642–1645. [DOI] [PubMed] [Google Scholar]
- Wang GJ,Volkow ND,Fowler JS,Cervany P,Hitzemann RJ,Pappas NR,Wong CT,Felder C ( 1999): Regional brain metabolic activation during craving elicited by recall of previous drug experiences. Life Sci 64: 775–784. [DOI] [PubMed] [Google Scholar]
- Wexler BE,Gottschalk CH,Fulbright RK,Prohovnik I,Lacadie CM,Rounsaville BJ,Gore JC ( 2001): Functional magnetic resonance imaging of cocaine craving. Am J Psychiatry 158: 86–95. [DOI] [PubMed] [Google Scholar]
- Wilson SJ,Sayette MA,Fiez JA ( 2004): Prefrontal responses to drug cues: A neurocognitive analysis. Nature Neurosci 7: 211–214. [DOI] [PMC free article] [PubMed] [Google Scholar]
- Xiao Z,Lee T,Zhang JX,Wu Q,Wu R,Weng X,Hu X ( 2006): Thirsty heroin addicts show different fMRI activations when exposed to water‐related and drug‐related cues. Drug Alcohol Depend 83: 157–162. [DOI] [PubMed] [Google Scholar]
- Xi ZX,Newman AH,Gilbert JG,Pak AC,Peng XQ,Ashby CR Jr,Gitajn L,Gardner EL ( 2006): The novel dopamine D3 receptor antagonist NGB 2904 inhibits cocaine's rewarding effects and cocaine‐induced reinstatement of drug‐seeking behavior in rats. Neuropsychopharmacology 31: 1393–1405. [DOI] [PubMed] [Google Scholar]
Associated Data
This section collects any data citations, data availability statements, or supplementary materials included in this article.
Supplementary Materials
Additional Supporting Information may be found in the online version of this article.
Table 1(b). Human brain regions (P <0.05 after clustering) activated by the factorial interactions obtained from all male participants. The brain regions, cluster volumes, the max PFI AUC%, p values, and the x, y, and z coordinates were presented in the same way as in Table 1 in the main text.
Figure 2(b). Activation maps resulting from factorial interactions obtained from all male participants. The colors, the white cycles, and the x, y, and z coordinates were presented in the same way as in Fig. 2 in the main text.
Figure 3(b). Activation maps resulting from factorial interactions obtained from all male participants. The colors, the white cycles, and the x, y, and z coordinates were presented in the same way as in Fig. 3 in the main text.