Abstract
Objective:
The aim of this prospective study was to investigate the relationships between inflammation, cerebral vasoregulation, and cognitive decline in type 2 diabetes mellitus (T2DM) over a 2-year span.
Methods:
Sixty-five participants (aged 66 ± 9.2 years, 35 with T2DM, 33 women) were enrolled for this 2-year prospective study. Continuous arterial spin labeling at 3-tesla MRI was used to measure global and regional cerebral perfusion and vasoreactivity. Neuropsychological measures were evaluated at the beginning and completion of the study. The associations between serum inflammatory markers, regional cerebral vasoreactivity, and cognitive functions were examined using least squares models.
Results:
After 2 years of follow-up, participants with T2DM had diminished global and regional cerebral vasoreactivity and a decline in multiple cognitive tasks compared with baseline (p < 0.0001–0.012). In the T2DM group, lower cerebral vasoreactivity was associated with a greater decrease in daily living activities score (r2adj = 0.35, p = 0.04), and lower global vasodilation was associated with a greater decline in executive function (r2adj = 0.6, p = 0.047). Higher serum soluble intercellular and vascular adhesion molecules, higher cortisol, and higher C-reactive protein levels at baseline were associated with greater decreases in cerebral vasoreactivity and vasodilation only in the T2DM group (r2adj = 0.16–0.53, p = 0.007–0.048), independent of diabetes control and 24-hour blood pressure. Higher glycated hemoglobin A1c levels were associated with a greater increase in vasoconstriction in the T2DM group.
Conclusions:
Inflammation may further impair cerebral vasoregulation, which consequently accelerates decline in executive function and daily activities performance in older people with T2DM.
Type 2 diabetes mellitus (T2DM) has been recognized as an independent risk for development of cognitive impairment and dementia.1,2 Endothelial dysfunction and impaired cerebral vasoregulation associated with hyperglycemia and elevated proinflammatory cytokine levels have been linked to functional decline in T2DM.3–5 The aim of this study was to prospectively determine the associations between inflammation, cerebral vasoregulation, and cognitive performance over a 2-year span in older adults with and without T2DM. We hypothesized that (1) inflammation and hyperglycemia are associated with impaired vasoregulation in the brain, and (2) impaired vasoregulation is associated with cognitive decline in T2DM.
METHODS
Participants.
This study was conducted in the Syncope and Falls in the Elderly Laboratory at the Clinical Research Center and at the MRI Center at Beth Israel Deaconess Medical Center between August 2009 and July 2013.
Participants with T2DM were treated for diabetes for more than 5 years. Nondiabetic controls were age- and sex-matched with normal fasting glucose and glycated hemoglobin A1c (HbA1c). Exclusion criteria were type 1 diabetes, heart disease, major surgery in the previous 6 months, stroke, carotid artery stenosis, liver or renal insufficiency, severe hypertension (systolic blood pressure [BP] >200 mm Hg or diastolic BP >110 mm Hg or taking 3 or more antihypertensive medications), seizures, malignant tumors, recreational drug or alcohol abuse, body mass index (BMI) ≥40 kg/m2, dementia, or subthreshold Mini-Mental State Examination (MMSE) score (≤24). MRI exclusion criteria included incompatible metal implants, pacemakers, and claustrophobia.
Standard protocol approvals, registrations, and patient consents.
Participants were recruited consecutively and provided written informed consent as approved by the Beth Israel Deaconess Medical Center institutional review board.
Protocol.
The study consisted of 2 visits in a 2-year interval. Participants completed the same protocol at baseline and at the 2-year follow-up visit. They were admitted to the Clinical Research Center for an overnight stay and completed medical history, physical and neurologic examinations, and neuropsychological assessments. The next morning, fasting laboratory chemistries were obtained and MRI studies were performed. Antihypertensive medications were withdrawn on the morning of the study; glycemic control medications were administered as usual. Systolic, diastolic, and mean BPs were measured every 20 minutes for 3 days using a wearable 24-hour ambulatory BP monitoring device (DynaPulse, Inc., Vista, CA) before the study visits.
Neuropsychological measures.
Neuropsychological assessments included the Hopkins Verbal Learning Test–Revised (HVLT-R) (verbal learning and memory function, including a Total Recall Delayed, Retention, and Recognition Discrimination Index), Rey-Osterrieth Complex Figure (ROCF) test (a measure of visual-spatial ability and visual memory function, including Immediate Recall and Delayed Recall tests), Trail Making Test, Parts A and B (tests for executive function), Verbal Fluency (VF) (a measure of executive function; dependent variables were number of items generated for phonemic trials and for the semantic tasks), MMSE, and Instrumental Activities of Daily Living (IADL) scale. The neuropsychological test results were analyzed using age-, sex-, race- and education-adjusted standardized T scores.
Composite learning and memory T score was calculated as an average of HVLT-R and ROCF T scores. Composite executive function T score was calculated as an average of VF and Trail Making Test T scores. A total overall composite T score was calculated as the average of all the T scores.6
Inflammation markers.
Laboratory evaluations included fasting serum glucose, HbA1c, and lipid and renal panels. Inflammation markers including soluble intercellular adhesion molecule (sICAM) and soluble vascular adhesion molecule (sVCAM) levels, cortisol, interleukin 6 (IL-6), and tumor necrosis factor α were measured from venous samples using the quantitative sandwich enzyme immunoassay technique (R&D Systems, Minneapolis, MN). C-reactive protein (CRP) was measured using a high-sensitivity CRP assay (Immulite-1000; Diagnostic Products, Los Angeles, CA).
MRI.
Studies were performed using a 3T GE GHX MRI scanner (GE Medical Systems, Milwaukee, WI). Anatomical images were acquired using 3-dimensional magnetization-prepared rapid-acquisition gradient echo (MP-RAGE) and fluid-attenuated inversion recovery sequences. Respiratory rate, tidal volume, and end-tidal CO2 values were recorded during each scan, and vital signs were measured at 1-minute intervals using an upper-arm automatic pressure cuff and finger photoplethysmogram. Three-dimensional continuous arterial spin labeling (CASL) was used for noninvasive mapping of cerebral blood flow.7,8
Image processing.
Images were analyzed using tools developed in interactive data language (Research Systems, Boulder, CO) and MATLAB (MathWorks, Natick, MA). Anatomical MRIs were coregistered to a standard template and segmented to calculate regional brain volumes using the Statistical Parametric Mapping software package (SPM, University College London, UK).
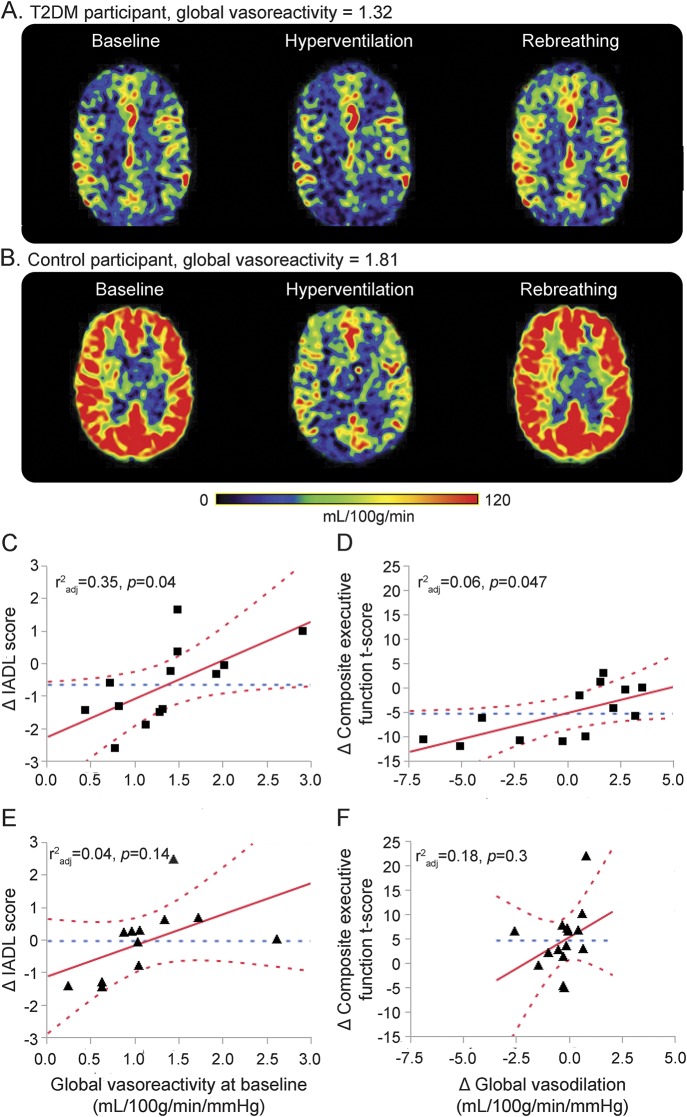
The MP-RAGE image and perfusion and vasoreactivity CASL images were coregistered and normalized to a standard template. Baseline perfusion, vasoreactivity, vasodilation, and vasoconstriction measures were calculated for global brain and also for the frontal, temporal, parietal, occipital, and insular regions. Within each region, perfusion was normalized for tissue volume. Vasodilation was defined as an increase in perfusion from baseline to CO2 rebreathing, normalized to the change in CO2 between these 2 conditions. Vasoconstriction was defined as the decrease in perfusion from baseline to hyperventilation, normalized to the change in CO2 between these 2 conditions. Vasoreactivity was calculated as the slope of the best-fit line produced by linear regression of perfusion and CO2 values (mL/100 g/min/mm Hg) across the 3 conditions during normal breathing, CO2 rebreathing, and hyperventilation3,9,10 (figure 1, A and B).
Figure 1. Associations between cerebral vasoregulation and decline in cognition.
(A and B) Perfusion maps for 2 representative participants using a 3T, 3-dimensional CASL MRI. (A) Participant with T2DM who has lower global vasoreactivity. (B) Participant without T2DM who has higher global vasoreactivity. (C) Lower baseline global vasoreactivity is associated with greater decline in IADL scores, and (D) lower baseline global vasodilation is associated with greater decline in composite executive function T scores after the 2-year follow-up in the T2DM group only. No similar effect was observed for the IADL scores (E) and executive function (F) in the control group. Best fit = red solid line; confidence interval = red dashed lines; mean = blue dashed line. CASL = continuous arterial spin labeling (mL/100 g/min/mm Hg); IADL = Instrumental Activities of Daily Living; T2DM = type 2 diabetes mellitus.
Statistical analysis.
All analyses were performed using JMP software (SAS Institute, Cary, NC). Variables were summarized using descriptive statistics. Demographic data, laboratory results, and cognitive functions were compared between groups using 1-way analysis of variance and nonparametric tests. Matched-pairs t tests were used to compare changes in glycemic control, cerebral perfusion, and cognitive scores between baseline and at the 2-year follow-up visit within each group. A correlation matrix was used to determine significant associations among multiple variables (i.e., age, sex, BMI, glucose, HbA1c, hematocrit [Hct], hypertension, cognitive functions, and perfusion). Those with r2 > 0.1, p < 0.05 were included in the modeling approach. Least squares models were used to assess relationships between serum inflammatory markers, changes of cognitive function, and vasoreactivity. The models were adjusted for age, sex, years of education, and 24-hour mean arterial pressure (MAP) or the presence of hypertension. For perfusion measurement, the model effect was adjusted for Hct because this variable is inversely correlated with blood viscosity and is higher in men than in women.11 Modeling was performed for each brain region separately.
RESULTS
Characteristics of the study cohort.
Of 131 participants that signed an informed consent, 65 participants, aged 50 to 85 years, 33 women, and 35 with T2DM, were eligible and included in baseline analyses; of those, 40 participants (19 with T2DM) who completed the 2-year follow-up visit were enrolled in the final analyses. Participants were excluded from baseline analyses for the following reasons: withdrew consent (n = 11), lost to follow-up (n = 10), smoking (n = 1), arrhythmia (n = 4), cancer (n = 2), MMSE score (n = 3), stroke or TIA (n = 2), heart failure (n = 1), MRI-incompatible implants (n = 1), renal insufficiency (n = 1), T2DM <5 years (n = 3), poorly controlled hypertension (n = 3), poor glycemic control (n = 4), unidentified neurologic disorders (n = 2), adverse event (n = 1), and incomplete datasets (n = 17). Participants were excluded from final analyses for the following reasons: withdrew consent (n = 5), lost to follow-up (n = 25), dementia (n = 1), and incomplete datasets (n = 4).
Participants with T2DM were treated with insulin (n = 9), oral glucose-control agents (n = 29), or diet only (n = 3), and for hypertension (n = 30) and hypercholesterolemia (n = 19). Control participants were treated for hypertension (n = 7) and hypercholesterolemia (n = 6).
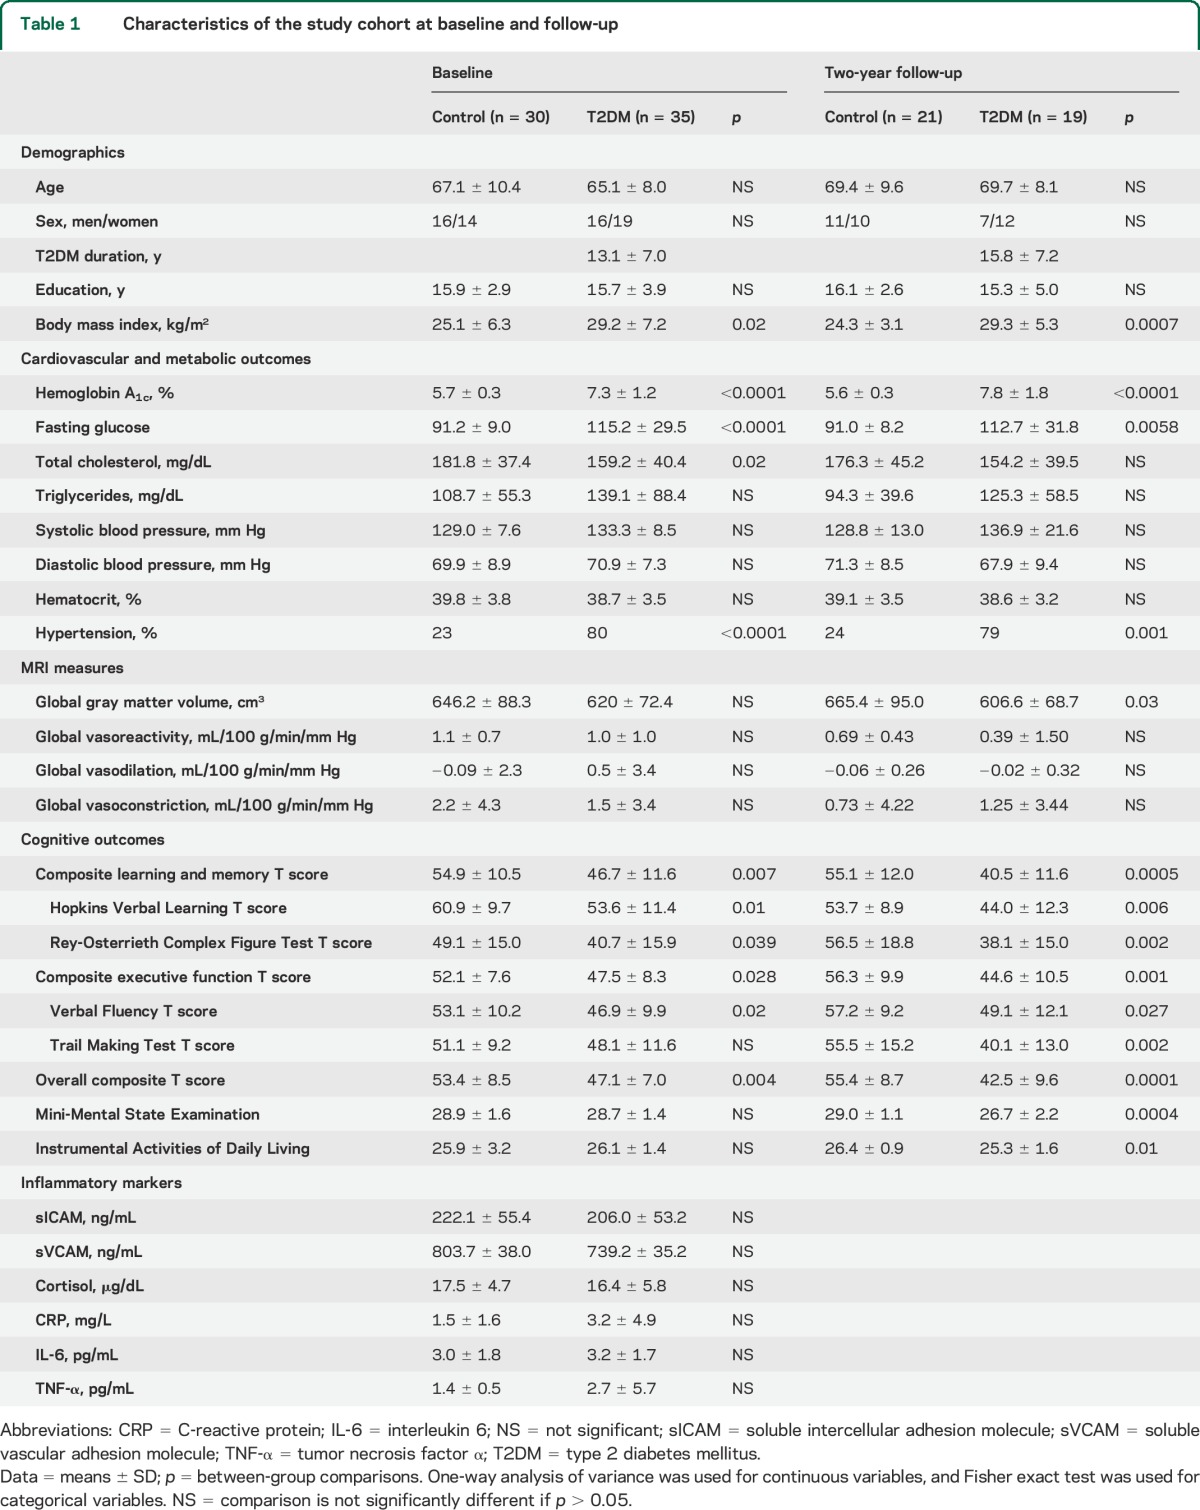
At baseline, the T2DM group had higher glycemic indices (HbA1c and glucose), higher BMI, and higher prevalence of hypertension. Participants with T2DM had worse performance on the composite learning and memory, HVLT-R, ROCF, composite executive function, VF, and overall composite T scores compared with the controls (p = 0.004–0.039; table 1).
Table 1.
Characteristics of the study cohort at baseline and follow-up
Two-year follow-up visit.
At the 2-year follow-up, the T2DM and control groups remained similar in demographic characteristics. However, the T2DM group had lower global gray matter volume and lower composite learning and memory, HVLT-R, ROCF, composite executive function, VF, TM, overall composite T scores, and MMSE and IADL scores compared with controls (p = 0.0001–0.03; table 1).
Progression of decline in vasoreactivity and cognition.
After 2 years of follow-up, participants with T2DM had lower global and regional cerebral vasoreactivity and worse glycemic controls, as compared with baseline (table 2).
Table 2.
Changes in vasoreactivity and cognitive function after 2 years in the T2DM group
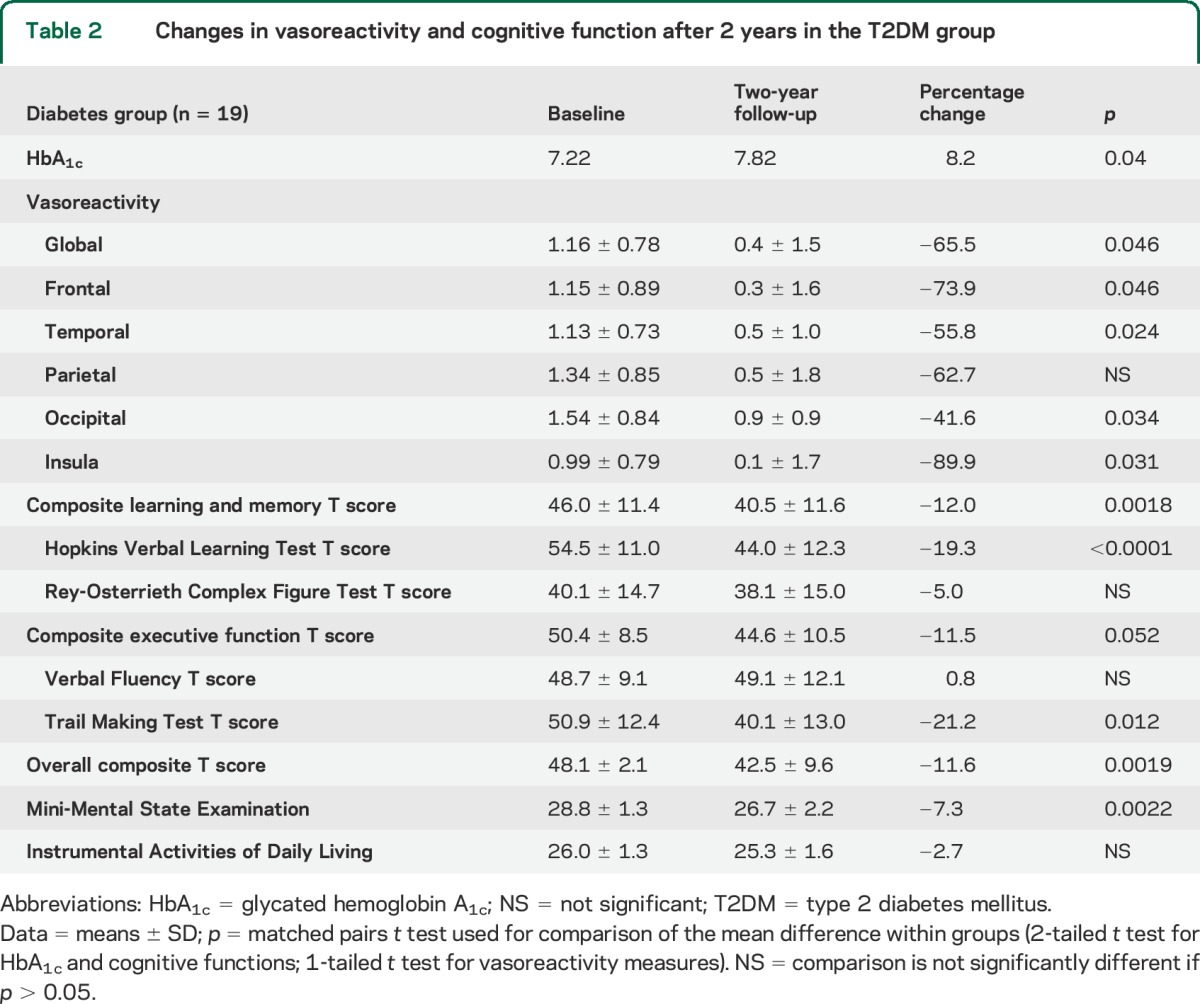
Cognitive function declined in the T2DM group, as measured by the T scores of composite learning and memory, HVLT-R, TM, overall composite, and MMSE (p < 0.0001–0.012; table 2). In the control group, vasoreactivity declined only in the insular cortex (p = 0.02) and there was no significant cognitive change except for worse performance in HVLT-R T score (p = 0.017).
Relationship between vasoregulation and cognitive function.
We investigated the relationship between cognitive function and cerebral vasoregulation between the 2 visits. In the T2DM group, those with lower global vasoreactivity at baseline had a greater deterioration in IADL scores after 2 years (r2adj = 0.35, p = 0.04), independent of their age, education, and Hct (figure 1C). A decrease in global vasodilation was associated with a decline in the composite executive function T score in participants with T2DM (r2adj = 0.6, p = 0.047), independent of age, education, Hct, and 24-hour MAP (figure 1D). Similar interactions between regional vasodilation and executive function were also observed in the frontal (r2adj = 0.59, p = 0.047) and parietal lobes (r2adj = 0.63, p = 0.034) in the T2DM group only. There were no similar effects in the control group (figure 1, E and F). The least squares models controlled for BMI did not reveal similar associations.
Associations between glycemic control, inflammation, and perfusion.
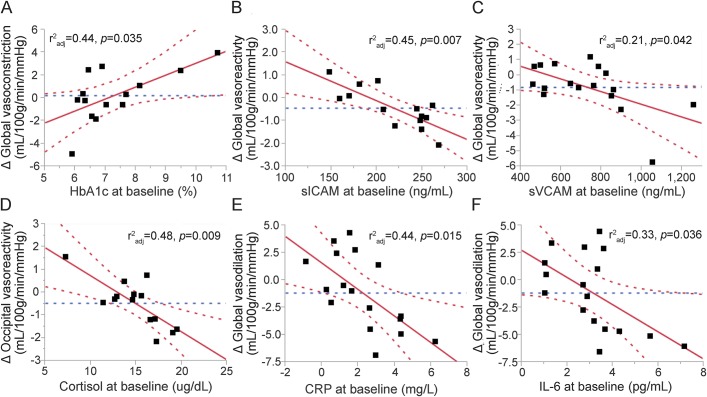
The relationships between glycemic control, serum inflammatory markers, vasoreactivity, vasodilation, and vasoconstriction were examined separately for each group. In the T2DM group, higher HbA1c levels were associated with a greater increase in global (r2adj = 0.44, p = 0.035; figure 2A) and regional vasoconstriction (temporal lobes: r2adj = 0.58, p = 0.006; insular cortex: r2adj = 0.40, p = 0.01), independent of age, Hct, and 24-hour MAP.
Figure 2. Associations between serum inflammatory markers and cerebral vasoregulation in the T2DM group.
(A) Higher baseline HbA1c is associated with greater increase in global cerebral vasoconstriction after 2-year follow-up, and (B) higher sICAM at baseline is associated with greater decrease in global vasoreactivity. Similar associations can be observed between the cerebral vasoregulations and serum sVCAM (C), cortisol (D), CRP (E), and IL-6 (F). Best fit = red solid line; confidence interval = red dashed lines; mean = blue dashed line. CRP = C-reactive protein; HbA1c = glycated hemoglobin A1c; IL-6 = interleukin 6; sICAM = soluble intercellular adhesion molecule; sVCAM = soluble vascular adhesion molecule; T2DM = type 2 diabetes mellitus.
In the T2DM group, inflammation markers were predictive of a decline in regional vasoreactivity. Higher baseline sICAM levels were associated with a greater decrease in global (r2adj = 0.45, p = 0.007; figure 2B) and regional cerebral vasoreactivity in the frontal (r2adj = 0.45, p = 0.006), temporal (r2adj = 0.42, p = 0.01), parietal (r2adj = 0.53, p = 0.0045), occipital lobes (r2adj = 0.44, p = 0.012), and insular cortex (r2adj = 0.31, p = 0.027), independent of age, Hct, HbA1c, and 24-hour MAP. Higher baseline sICAM levels were also associated with a greater decrease in vasodilation in the frontal lobes (r2adj = 0.40, p = 0.048), independent of age, Hct, HbA1c, and 24-hour MAP. Higher baseline sVCAM levels were associated with a greater decrease in global (r2adj = 0.21, p = 0.042; figure 2C) and regional vasoreactivity (frontal: r2adj = 0.16, p = 0.05; temporal: r2adj = 0.32, p = 0.022; insular cortex: r2adj = 0.23, p = 0.04) and a greater decrease in vasodilation in the insular cortex (r2adj = 0.31, p = 0.027), independent of age, Hct, HbA1c, and presence of hypertension in participants with T2DM. Higher cortisol levels were linked to a greater decrease in regional vasoreactivity in the temporal (r2adj = 0.22, p = 0.04), parietal (r2adj = 0.18, p = 0.05), and occipital (r2adj = 0.48, p = 0.009) lobes, independent of age, Hct, HbA1c and 24-hour MAP (figure 2D). Higher baseline CRP levels in the T2DM group were associated with a greater decrease in global (r2adj = 0.44, p = 0.015; figure 2E) and regional vasodilation (frontal: r2adj = 0.35, p = 0.04; temporal: r2adj = 0.38, p = 0.02; parietal: r2adj = 0.48, p = 0.01; occipital: r2adj = 0.39, p = 0.02) during the follow-up visit, independent of age, Hct, HbA1c, and presence of hypertension. IL-6 was associated with lower global vasodilation (r2adj = 0.33, p = 0.036; figure 2F) and in the parietal lobes (r2adj = 0.32, p = 0.048). However, the association between IL-6 and vasodilation, as well as its effect, became nonsignificant after adjusting for HbA1c. None of these relationships was observed in the control group.
Effects of hyperglycemia on cognitive decline.
In the entire cohort, a higher HbA1c level at baseline was associated with a greater decline in MMSE scores (r2adj = 0.53, p = 0.009; figure 3), composite executive function T score (r2adj = 0.09, p = 0.028), and overall composite T score (r2adj = 0.11, p = 0.044), independent of age, sex, education, and baseline MMSE scores.
Figure 3. Association between HbA1c level and decline in the MMSE.
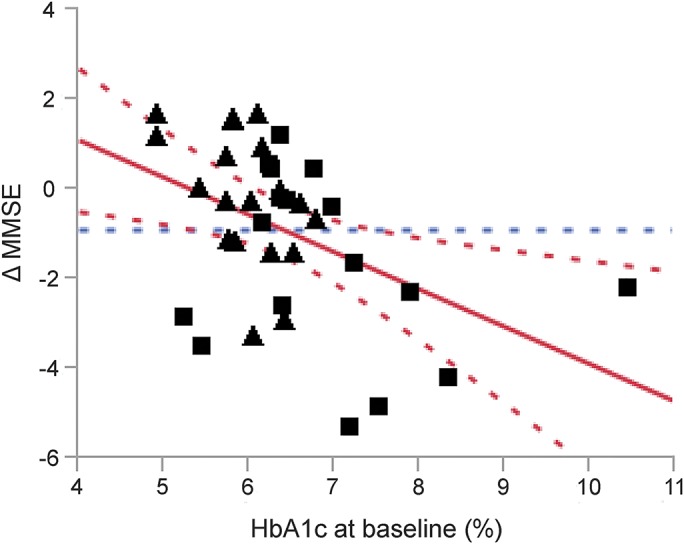
Across groups, a higher level of HbA1c at baseline is associated with a greater decline in MMSE score after the 2-year follow-up, independent of the age, sex, years of education, and baseline MMSE score. Squares = participants with type 2 diabetes mellitus; triangles = control participants. Best fit = red solid line; confidence interval = red dashed lines; mean = blue dashed line. HbA1c = glycated hemoglobin A1c; MMSE = Mini-Mental State Examination.
DISCUSSION
This study has shown that T2DM is associated with an accelerated impairment of cerebral vasoregulation and a greater decline in cognitive function as compared with nondiabetic controls matched for age, sex, and comorbidity. In the T2DM group, impaired cerebral vasoreactivity at baseline was associated with worse performance of daily activities, and the worsening in vasodilation was correlated with greater decline in executive functions. In participants with T2DM, higher baseline sICAM and sVCAM levels were associated with a greater decrease in cerebral vasoreactivity and vasodilation after 2 years of follow-up. Higher cortisol and CPR levels were associated with greater decline in cerebral vasoregulation.
The mechanisms behind cognitive decline in T2DM are multifactorial,12–18 reflecting the metabolic complexity involved in T2DM, and the wide diversity of mechanisms lead to cognitive impairments. Our previous study3 linked the adhesion molecules (i.e., sICAM and sVCAM) to altered vasoregulation and brain atrophy in T2DM cross-sectionally. This prospective study provided further evidence for the progression of decline in cognitive function in participants with T2DM and its relationships with cerebral vasoregulation and inflammation.
Our results suggest that hyperglycemia imposes a chronic negative effect on cognitive functions in the T2DM population. These findings are consistent with previous studies that demonstrated that higher HbA1c levels are associated with faster cognitive decline.3,19–21
Normal cerebral vasoreactivity enables redistribution of cerebral blood flow to areas of increased neuronal activity during the performance of different tasks, including cognitive function.9,22 Its normal activity relies on the intact endothelium in the neurovascular unit responding to changes of CO2 and other metabolites.23,24 Impaired vasoreactivity is a marker of microangiopathy in T2DM25 and is linked to impaired cognitive function in the aging diabetic brain3 and Alzheimer disease.22 However, whether impaired cerebral vasoreactivity is directly associated with cognitive performance in individuals with T2DM remains unclear.
In the T2DM group, global and regional cerebral vasoreactivity decreased more than 50% over the 2-year period (table 2). In addition, vasoreactivity and vasodilation were positively correlated with performance on executive function tests and daily living activities. These correlations provided the link between altered cerebral vasoregulation and cognitive deterioration in participants with T2DM that can be tracked prospectively even over a relatively short time period of 2 years. Furthermore, the association between serum inflammatory markers and the subsequent decrease in vasoregulation was exclusively observed in the T2DM group (figure 2, B–E). These relationships were not observed in nondiabetic controls who did not show a significant decrease of vasoreactivity and cognition, underscoring the effects of hyperglycemia and glycemic variability on brain tissue and function. These correlations suggest that inflammation has a critical role in degradation of cerebral vasoregulation in the milieu of chronic hyperglycemia regardless of glycemic control.
In T2DM, hyperglycemia and insulin resistance lead to oxidative stress in the mitochondria and endoplasmic reticulum that triggers the release of proinflammatory cytokines and activation of proapoptotic pathways.26 This cascade ultimately leads to endothelial dysfunction. Adhesion molecules are expressed concomitantly with altered endothelial cell motility through nitric oxide–dependent pathways, angiogenic activity, and neovascularization, indicating an ongoing inflammation-remodeling process of endothelium.23,27–29 A combination of hyperglycemia and inflammation appears to accelerate neuronal loss and atrophy in the affected regions. Vasoreactivity in the cerebral cortex is negatively affected by increased capillary thickness, microangiopathy,30,31 and altered endothelial permeability.14,25 A shift in the balance between vasodilation and vasoconstriction may be an important factor in the pathophysiology of hyperglycemia-mediated microangiopathy. As a result, metabolic vascular reactivity diminishes.24 These associations also suggest that endothelial derangement of the cerebral microvasculature may happen early in the course of hyperglycemic damage, before structural changes.9,13 Early detection and monitoring of cerebral blood flow regulation may be a critical predictor of cognitive decline acceleration in T2DM.
Our protocol excluded individuals with cognitive impairment at baseline because they may have a higher risk of cognitive decline. The study design allowed only for a relatively short follow-up of 2 years, and diabetes-related complications and cognitive decline are associated with unsuccessful follow-up32; therefore, the overall impact of T2DM on cognition may be even greater. A study with a larger sample size and a longer follow-up period is warranted to establish the time sequence of the relationship between blood flow regulation and functional outcomes in T2DM.
Our study provided prospective data about the associations between glycemic control, serum inflammatory markers, cerebral vasoregulation, and cognitive function in individuals with and without T2DM, as well as about the time course of their changes by direct measurement of cerebral blood flow based on CASL-MRI. We observed that higher levels of inflammatory markers are associated with greater impairment in cerebral vasoregulation and linked altered vasoregulation to faster cognitive decline in older adults with T2DM. This study provides clinical evidence regarding the mechanisms of long-term effects of diabetes on the brain and has implications for health care and future treatments for the growing population of older people with T2DM.
GLOSSARY
- BMI
body mass index
- BP
blood pressure
- CASL
continuous arterial spin labeling
- CRP
C-reactive protein
- HbA1c
glycated hemoglobin A1c
- Hct
hematocrit
- HVLT-R
Hopkins Verbal Learning Test–Revised
- IADL
Instrumental Activities of Daily Living
- IL-6
interleukin 6
- MAP
mean arterial pressure
- MMSE
Mini-Mental State Examination
- MP-RAGE
magnetization-prepared rapid-acquisition gradient echo
- ROCF
Rey-Osterrieth Complex Figure
- sICAM
soluble intercellular adhesion molecule
- sVCAM
soluble vascular adhesion molecule
- T2DM
type 2 diabetes mellitus
- VF
Verbal Fluency
AUTHOR CONTRIBUTIONS
Chen-Chih Chung, MD: contributed to study conduct, performed MRI data and statistical analysis, and contributed to manuscript preparation. Daniela Pimentel, MD: contributed to conducting the study and to manuscript preparation. Azizah J. Jor'dan, PhD: contributed to the statistical analysis and manuscript preparation. Ying Hao, PhD: processed MRI data. William Milberg, PhD: oversaw cognitive testing and analyses. Vera Novak, MD, PhD: designed the study and protocol, oversaw all aspects of the study conduct and experiments and manuscript preparation.
STUDY FUNDING
The study was supported by NIH-NIA 1R01-AG0287601A2, NIH-NIDDK 5R21 DK084463, American Diabetes Association, Clinical 1-03-CR-23 and 1-06-CR-25 to Dr. Vera Novak. The project described was supported by grant UL1 RR025758, Harvard Clinical and Translational Science Center, and M01-RR-01032 from the National Center for Research Resources.
DISCLOSURE
C. Chung and D. Pimentel report no disclosures relevant to the manuscript. A. Jor'dan, PhD, is funded by NIH-NIA T32 (5T32AG023480) fellowship and Supplement Award (R01AG041785). Y. Hao and W. Milberg report no disclosures relevant to the manuscript. V. Novak was funded by NIH-NIA 1R01-AG0287601A2, NIH-NIDDK 5R21 DK084463, American Diabetes Association, Clinical 1-03-CR-23 and 1-06-CR-25. Go to Neurology.org for full disclosures.
REFERENCES
- 1.Bordier L, Doucet J, Boudet J, Bauduceau B. Update on cognitive decline and dementia in elderly patients with diabetes. Diabetes Metab 2014;40:331–337. [DOI] [PubMed] [Google Scholar]
- 2.Xu WL, Qiu CX, Wahlin A, Winblad B, Fratiglioni L. Diabetes mellitus and risk of dementia in the Kungsholmen project: a 6-year follow-up study. Neurology 2004;63:1181–1186. [DOI] [PubMed] [Google Scholar]
- 3.Novak V, Zhao P, Manor B, et al. Adhesion molecules, altered vasoreactivity, and brain atrophy in type 2 diabetes. Diabetes Care 2011;34:2438–2441. [DOI] [PMC free article] [PubMed] [Google Scholar]
- 4.Tsao CW, Seshadri S, Beiser AS, et al. Relations of arterial stiffness and endothelial function to brain aging in the community. Neurology 2013;81:984–991. [DOI] [PMC free article] [PubMed] [Google Scholar]
- 5.Mehrabian S, Raycheva M, Gateva A, et al. Cognitive dysfunction profile and arterial stiffness in type 2 diabetes. J Neurol Sci 2012;322:152–156. [DOI] [PubMed] [Google Scholar]
- 6.Heaton RK, Akshoomoff N, Tulsky D, et al. Reliability and validity of composite scores from the NIH Toolbox Cognition Battery in adults. J Int Neuropsychol Soc 2014;20:588–598. [DOI] [PMC free article] [PubMed] [Google Scholar]
- 7.Alsop DC, Dai W, Grossman M, Detre JA. Arterial spin labeling blood flow MRI: its role in the early characterization of Alzheimer's disease. J Alzheimers Dis 2010;20:871–880. [DOI] [PMC free article] [PubMed] [Google Scholar]
- 8.Detre JA, Alsop DC, Vives LR, Maccotta L, Teener JW, Raps EC. Noninvasive MRI evaluation of cerebral blood flow in cerebrovascular disease. Neurology 1998;50:633–641. [DOI] [PubMed] [Google Scholar]
- 9.Last D, Alsop DC, Abduljalil AM, et al. Global and regional effects of type 2 diabetes on brain tissue volumes and cerebral vasoreactivity. Diabetes Care 2007;30:1193–1199. [DOI] [PMC free article] [PubMed] [Google Scholar]
- 10.Zhao P, Alsop DC, Abduljalil A, et al. Vasoreactivity and peri-infarct hyperintensities in stroke. Neurology 2009;72:643–649. [DOI] [PMC free article] [PubMed] [Google Scholar]
- 11.Zeng SM, Yankowitz J, Widness JA, Strauss RG. Etiology of differences in hematocrit between males and females: sequence-based polymorphisms in erythropoietin and its receptor. J Gend Specif Med 2001;4:35–40. [PubMed] [Google Scholar]
- 12.Gorelick PB, Scuteri A, Black SE, et al. Vascular contributions to cognitive impairment and dementia: a statement for healthcare professionals from the American Heart Association/American Stroke Association. Stroke 2011;42:2672–2713. [DOI] [PMC free article] [PubMed] [Google Scholar]
- 13.Luchsinger JA. Type 2 diabetes cognitive impairment: linking mechanisms. J Alzheimers Dis 2012;30(suppl 2):S185–S198. [DOI] [PMC free article] [PubMed] [Google Scholar]
- 14.Biessels GJ, Staekenborg S, Brunner E, Brayne C, Scheltens P. Risk of dementia in diabetes mellitus: a systematic review. Lancet Neurol 2006;5:64–74. [DOI] [PubMed] [Google Scholar]
- 15.Yaffe K, Lindquist K, Schwartz AV, et al. Advanced glycation end product level, diabetes, and accelerated cognitive aging. Neurology 2011;77:1351–1356. [DOI] [PMC free article] [PubMed] [Google Scholar]
- 16.Craft S. Insulin resistance and Alzheimer's disease pathogenesis: potential mechanisms and implications for treatment. Curr Alzheimer Res 2007;4:147–152. [DOI] [PubMed] [Google Scholar]
- 17.Whitmer RA, Karter AJ, Yaffe K, Quesenberry CP, Selby JV. Hypoglycemic episodes and risk of dementia in older patients with type 2 diabetes mellitus. JAMA 2009;301:1565–1572. [DOI] [PMC free article] [PubMed] [Google Scholar]
- 18.McNay EC, Cotero VE. Mini-review: impact of recurrent hypoglycemia on cognitive and brain function. Physiol Behav 2010;100:234–238. [DOI] [PMC free article] [PubMed] [Google Scholar]
- 19.Shorr RI, de Rekeneire N, Resnick HE, et al. Glycemia and cognitive function in older adults using glucose-lowering drugs. J Nutr Health Aging 2006;10:297–301. [PubMed] [Google Scholar]
- 20.Luchsinger JA, Palmas W, Teresi JA, et al. Improved diabetes control in the elderly delays global cognitive decline. J Nutr Health Aging 2011;15:445–449. [DOI] [PMC free article] [PubMed] [Google Scholar]
- 21.Yaffe K, Falvey C, Hamilton N, et al. Diabetes, glucose control, and 9-year cognitive decline among older adults without dementia. Arch Neurol 2012;69:1170–1175. [DOI] [PMC free article] [PubMed] [Google Scholar]
- 22.Cantin S, Villien M, Moreaud O, et al. Impaired cerebral vasoreactivity to CO2 in Alzheimer's disease using BOLD fMRI. Neuroimage 2011;58:579–587. [DOI] [PubMed] [Google Scholar]
- 23.Lavi S, Gaitini D, Milloul V, Jacob G. Impaired cerebral CO2 vasoreactivity: association with endothelial dysfunction. Am J Physiol Heart Circ Physiol 2006;291:H1856–H1861. [DOI] [PubMed] [Google Scholar]
- 24.Zhang P, Huang G, Shi X. Cerebral vasoreactivity during hypercapnia is reset by augmented sympathetic influence. J Appl Physiol 2011;110:352–358. [DOI] [PMC free article] [PubMed] [Google Scholar]
- 25.Lasek-Bal A, Kazibutowska Z, Gołba A, Motta E. Cerebral vasoreactivity in hypocapnia and hypercapnia in patients with diabetes mellitus type 2 with or without arterial hypertension. Neurol Neurochir Pol 2012;46:529–535. [DOI] [PubMed] [Google Scholar]
- 26.Monnier L, Mas E, Ginet C, et al. Activation of oxidative stress by acute glucose fluctuations compared with sustained chronic hyperglycemia in patients with type 2 diabetes. JAMA 2006;295:1681–1687. [DOI] [PubMed] [Google Scholar]
- 27.Kevil CG, Orr AW, Langston W, et al. Intercellular adhesion molecule-1 (ICAM-1) regulates endothelial cell motility through a nitric oxide-dependent pathway. J Biol Chem 2004;279:19230–19238. [DOI] [PubMed] [Google Scholar]
- 28.Kevil CG, Pruitt H, Kavanagh TJ, et al. Regulation of endothelial glutathione by ICAM-1: implications for inflammation. FASEB J 2004;18:1321–1323. [DOI] [PubMed] [Google Scholar]
- 29.Koch AE, Halloran MM, Haskell CJ, Shah MR, Polverini PJ. Angiogenesis mediated by soluble forms of E-selectin and vascular cell adhesion molecule-1. Nature 1995;376:517–519. [DOI] [PubMed] [Google Scholar]
- 30.Mäkimattila S, Yki-Järvinen H. Endothelial dysfunction in human diabetes. Curr Diab Rep 2002;2:26–36. [DOI] [PubMed] [Google Scholar]
- 31.Starr JM, Wardlaw J, Ferguson K, MacLullich A, Deary IJ, Marshall I. Increased blood-brain barrier permeability in type II diabetes demonstrated by gadolinium magnetic resonance imaging. J Neurol Neurosurg Psychiatry 2003;74:70–76. [DOI] [PMC free article] [PubMed] [Google Scholar]
- 32.Tilvis RS, Kähönen-Väre MH, Jolkkonen J, Valvanne J, Pitkala KH, Strandberg TE. Predictors of cognitive decline and mortality of aged people over a 10-year period. J Gerontol A Biol Sci Med Sci 2004;59:268–274. [DOI] [PubMed] [Google Scholar]


