

Abstract
Understanding the way how proteins interact with each other to form transient or stable protein complexes is a key aspect in structural biology. In this study, we combined chemical cross-linking with mass spectrometry to determine the binding stoichiometry and map the protein–protein interaction network of a human SAGA HAT subcomplex. MALDI-MS equipped with high mass detection was used to follow the cross-linking reaction using bis[sulfosuccinimidyl] suberate (BS3) and confirm the heterotetrameric stoichiometry of the specific stabilized subcomplex. Cross-linking with isotopically labeled BS3 d0-d4 followed by trypsin digestion allowed the identification of intra- and intercross-linked peptides using two dedicated search engines: pLink and xQuest. The identified interlinked peptides suggest a strong network of interaction between GCN5, ADA2B and ADA3 subunits; SGF29 is interacting with GCN5 and ADA3 but not with ADA2B. These restraint data were combined to molecular modeling and a low-resolution interacting model for the human SAGA HAT subcomplex could be proposed, illustrating the potential of an integrative strategy using cross-linking and mass spectrometry for addressing the structural architecture of multiprotein complexes.
Keywords: cross-linking mass spectrometry, SAGA HAT subcomplex, proteomics, protein–, protein interaction
Introduction
Most if not all biological processes are catalyzed by dedicated interaction networks. Proteins rarely exist alone in the cell but are involved in macromolecular complexes and elucidation of the assembling dynamics of these multiprotein blocks is of major importance to understand and modulate cellular dysfunction.
In the last few years, integrative approaches have attracted considerable interest. This might be partly because of the realization that, despite their own limitations, traditional structural methods have complementary attributes, and combining respective information would definitely help in exploring the architecture, dynamics, and function of macromolecular complexes. Data arising from various biophysical techniques may be gathered on the bound as well as on the free states of the multiprotein system, and may help generating testable structural models or understanding self-assembling of the protein building blocks.1,2 Input of physical theories and statistical data arising from sequence or structural databases homology studies, might also be added to best refine the proposed model.3 In this context, mass spectrometry (MS) was shown as a high-potential technique for characterizing intact multiproteins assemblies, especially for determining the complex stoichiometry or monitoring dynamic changes.4 More recently, MS-based technologies, such as IM,5 H/D exchange,6 chemical cross-linking (CX),7 have emerged to assist these structural building activities. In particular cross-linking, by providing important spatial restraint information, is emerging as a promising approach for generating residue level topological data.8 Revealing precisely which residues are linked yields proximity information that might increase the resolution of the proposed structural model. An increasing number of studies were reported during the last decade,9–11 including very large multiprotein complexes such as RNA polymerase II12 and protein–drug interactions13 or illustrating the integration of CX-MS to theoretical structural knowledge arising from modeling,14,15 EM,16 or XRD.17 The choice of cross-linkers is crucial because the success of cross-linking reaction depends on their reactivity and selectivity as well as their spacer-arm lengths which rule the maximum distance between two cross-linked residues.18,19 Identifying the cross-linked peptides is also still very challenging since they often are present at a small concentration in solution compared to unmodified peptides. Indeed, multiple cross-linked products may occur for one reactive residue or the reaction may be incomplete. Therefore, several enrichment methods that will improve MS detection have been successfully developed including affinity selection,20 strong cation exchange (SCX) chromatography,21 H/D labeling or exclusion list of low charge states peptides. Using cross-link reagent bearing a HCCA (α-cyano-4-hydroxycinnamic acid) moiety might also be very efficient allowing specific MALDI signal enhancement of such cross-linked peptides compared to unmodified peptides.22,23 Furthermore, the CX-MS workflow requires the use of search engines dedicated to identification of cross-linked peptides. A large number of algorithms are available in the literature24–27 but the main challenge still resides in assigning the confidence of a match.
The multisubunit Spt-Ada-Gcn5 Acetyltransferase (SAGA) complex investigated here is a paramount example of a transcriptional coactivator.28 Transcription of protein coding genes by the RNA polymerase II (RNAPII) enzyme is a tightly regulated process that requires the assembly of a Pre-Initiation Complex (PIC) at the promoter of transcribed genes. Sequence-specific transcriptional activators and post-translational modifications of nucleosomal histones contribute to the recruitment of multisubunit coactivator complexes acting as bridging factors between the activators and the PIC.29,30 In humans, the 1.8 MDa SAGA coactivator complex is composed of 18 distinct subunits31,32 and adopts a modular organization as evidenced by genetic complementation studies,33 and by electron microscopy models.34,35 More recently, quantitative proteomics established a subunit interaction network and segmented SAGA into four stable modules.36 SAGA harbors a Histone Acetyl Transferase (HAT) activity carried by the Gcn5 subunit and modulated by the Ada2 and Ada3 subunits. Together with Sgf29, these subunits form the HAT module which is a major regulator of histone H3 acetylation in yeast cells.37,38 Gcn5 contains a bromodomain which binds acetylated lysines in histone tails,39 while Sgf29 contains a Tudor domain capable of binding H3K4me2/3, another hall mark of actively transcribed chromatin.40
In this paper, we describe how CX-MS has been successfully used to determine the binding stoichiometry and topology of the human SAGA HAT subcomplex. We integrated these data with molecular modeling in order to determine the molecular interactions between the four subunits.
Results
Production of the human SAGA HAT module
The sequence analysis of the SAGA HAT subunits revealed conserved homology domains and for some of them an atomic model has been determined by X-ray crystallography [Fig. 1(A)]. To analyze the SAGA HAT subcomplex, we produced recombinant hGCN5, hADA2B, mADA3, and hSGF29 from a single virus in insect cells using the Multibac technology.41 The mouse ADA3 sequence is 99.3% identical to its human homologue with the exception of three mutations (T110A, V126L, and I226M). The complex was histidine-tagged on GCN5 and purified over a metal chelating affinity column followed by size exclusion chromatography (SEC). SEC of the HAT complex showed a single peak consistent with an homogeneous protein assembly and the SDS-PAGE analysis indicated that all four polypeptides co-elute in the same fractions [Fig. 1(B)]. Because of their close molecular weight ADA2B and ADA3 co-migrate on a 10% acrylamide gel.
Figure 1.

Purification and biochemical characterization of the SAGA HAT subcomplex. (A) Maps of the conserved structural domains within the SAGA HAT subunits. The domains are identified as follows: ZZ—type zinc finger domain; SANT—histone binding domain found in Swi3, ADA2, N-Cor and TFIIIB; SWIRM—eukaryotic domain found in proteins implicated in chromatin remodeling and gene expression; CC—coiled-coil domain; TUDOR—structural motif involved in binding methylated arginine or lysine residues; PCAF—P300/CBP-associated factor homology domain; AT—acetyltransferase domain; BR—bromodomain. The known atomic structures of the conserved domains are shown (SANT—PDB 1X41, TUDOR—PDB 3MEA, AT—PDB 1Z4R, BR—PDB 3D7C). (B) SDS-PAGE analysis of the purified SAGA HAT module. MW molecular weight marker, lane 1 purified SAGA HAT after the metal chelating affinity column, lanes 2–7—peak fractions of the size exclusion chromatography. (C) Co-expression of histidine-tagged GCN5 with different combinations of the other SAGA HAT subunits followed by pull down experiments.
Co-expression experiments
In order to investigate the interactions between the catalytic subunit GCN5 and the other subunits of the SAGA HAT module, the histidine-tagged GCN5 was co-expressed in isolation or with different combinations of the ADA3, ADA2B, or SGF29 subunits. The resulting complex was purified and analyzed as described above. The ADA2B and ADA3 subunits interact poorly in isolation with GCN5 [lanes 2 and 3 in Fig. 1(C)] but form a heterotrimeric complex when expressed together [lane 6 in Fig. 1(C)]. SGF29 incorporates only in a complex formed by GCN5, ADA2B, and ADA3 [lane 7 in Fig. 1(C)] and does not bind stably to GCN5 alone [lane 1 in Fig. 1(C)].
Characterization of the cross-linking reaction by MALDI-MS
The cross-linking reaction was performed with bis[sulfosuccinimidyl] suberate (BS3). The reaction conditions (cross-linker to protein ratios, times, and temperatures) were optimized so that cross-linker reacts on the whole sample, but at a quite low cross-linker concentration to avoid perturbation on structure which can lead to aggregation or nonspecific interactions42 (see Materials and Methods, Supporting Information Fig. 1). The complex stoichiometry as well as the cross-linking kinetics were followed by MALDI-MS analysis using high mass detection.43 Before cross-linking, ions at 33,197, 48,773, and 97,197 ± 10 Da were detected, which corresponds to the theoretical masses of the four subunits (ADA2B and ADA3 are co-detected since their mass difference is too small to be distinguished by MALDI-MS) [Fig. 2(A)]. After cross-linking, molecular mass of about 241,387 Da ± 200 Da was measured. From this mass, two possible stoichiometries could be formally deduced, i.e. 1/1/1/1 (of each subunit) or 1/2/1 (GCN5/ADA3 or ADA2B/SGF29) [Fig. 2(B)]. A bottom-up approach by LC-MS/MS (see further) will definitively allow to conclude in favor of the first hypothesis. The signal corresponding to the cross-linked entire complex is quite broad, which results in a quite low mass accuracy but sufficient to propose a tetrameric binding stoichiometry without ambiguity. This may be because of the heterogeneity of the cross-linked molecules but also to a certain amount of salt adducts arising from the 100 mM NaCl containing buffer. No signal corresponding to other stoichiometries (homomers or high-order multimers) neither to intermediates reflecting incomplete cross-linking reaction or assembly process was observed. This suggests that there was no residual aggregation and that the detected complex with the expected stoichiometry is formed by specific interactions.
Figure 2.
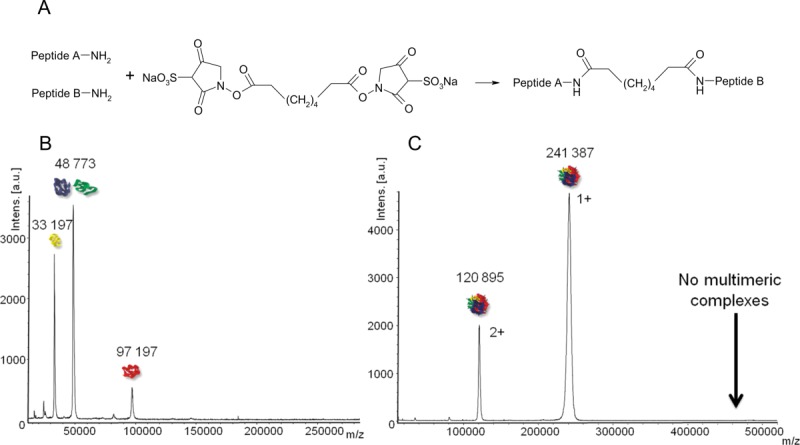
(A) Chemical formula of two peptide chains connected through the BS3 cross-linker. (B,C) MALDI-MS spectra of the complex before (B) and after (C) cross-linking with BS3. A unique stoichiometry at 241,387 Da is detected after cross-linking.
Determination of the proximity map in SAGA HAT by LC-MS/MS
In order to get insight into the “in-proximity areas” (through identification of the spatially close lysines), the cross-linked complex was digested with trypsin and the resulting peptide mixture was then directly analyzed by LC-MS/MS. As described by Müller et al.,44 a mixture of the light form (d0) and the isotopically labeled form (d4) of BS3 was used for the cross-linking reaction in order to facilitate the detection of low abundant cross-linked products. In this method, peptides containing the cross-linker will appear as a doublet in the mass spectrum with a mass shift of 4.025 amu.
Trypsin activity did not appear to be affected by cross-linking as shown by the high sequence coverages obtained after classical Mascot database search (from 55% for SGF29 up to 91% for ADA3). Whereas peptides that have been modified by a partially hydrolyzed cross-linker (type 0 cross-link or dead-end peptides18) are easily identified by performing standard database search in Mascot, two open-source algorithms, pLink26 and xQuest,27 were chosen, for both intra- and interlinkages determination. Whereas pLink is dedicated to the identification of peptides modified with either light or heavy cross-linker, xQuest is based on the determination of peptides modified with both light and heavy cross-linkers. The request was repeated using a database containing random protein sequences (instead of the sequences of four subunits of SAGA HAT) and false cross-linker mass in order to evaluate false positive matches as well as the associated scorings for both algorithms. From such experiment, background threshold scores were extracted, under which there is a serious risk that a good fit with the MS/MS data occurred by chance. Scores higher than 25 for xQuest and E-06 for pLink were then chosen as thresholds for positive identification. In addition, manual validation was systematically performed to further validate the identification (about 10% were manually removed). Cross-linked peptides follow the general rules of CID-peptide fragmentation45 and thus, their fragmentation spectra should provide fragment ions arising from both bridged peptides upstream and downstream of the linkage. Two examples of MS/MS spectrum assignment by pLink are shown in Figure 3. In both cases, the corresponding peptides were unambiguously identified as reflected by the large series of consecutive y-ions and b-ions. In some cases, ions containing the linkage product will also be detected increasing the identification relevance as shown in Figure 3(A) at m/z = 879.4828.
Figure 3.

MS/MS spectra of two intercross-linked peptides as identified by pLink (score E-10). The K–K bridge may be (A) or not (B) detected as an ion fragment.
A total number of 97 unique inter-cross-links (indicating the linkage of unique lysine–lysine pairs) have been found with pLink and xQuest (Table1). Among them, 23 were identified by xQuest only and 43 by pLink only. These results are the combination of three technical replicates (displaying 80% overlap) and one biological replicate (40% overlap). It should be noticed that the proximity areas were strictly equivalent in all replicates. The overlap discrepancy might come from: (i) a lower MS/MS intensity spectrum that could not be unambiguously assigned, (ii) a flexibility of the complex structure that slightly modify the distance between reactive lysines leading to different links, or (iii) from a competitive reactivity of two neighboring lysines, yielding cross-linked peptides with different masses.
Table 1.
List of intermolecular cross-links between SAGA HAT subunits. No score means the cross-linked peptide was not identified or not validated manually.
| GCN5-ADA3 | |||||
|---|---|---|---|---|---|
| Linked K in GCN5 | Linked K in ADA3 | Score in pLink | Score in xQuest | Mass (Da) | Mass precision (ppm) |
| 314 | 85 | 5.26E-14 | 55 | 2614.3754 | −0.4 |
| 314 | 147 | 3.65E-12 | 2905.4569 | 1.1 | |
| 314 | 221 | 45.71 | 2654.3527 | −0.9 | |
| 314 | 354 | 1.56E-13 | 44.66 | 3218.6297 | −0.7 |
| 361 | 85 | 5.47E-10 | 1803.0770 | 0.8 | |
| 366 | 78 | 4.89E-07 | 1229.6615 | −0.7 | |
| 366 | 85 | 7.13E-07 | 1491.8961 | 0.7 | |
| 366 | 421 | 5.47E-09 | 1400.7874 | −0.1 | |
| 536 | 85 | 1.74E-06 | 2835.6122 | 0.2 | |
| 561 | 78 | 2.27E-07 | 1622.8750 | −0.1 | |
| 561 | 85 | 1.15E-08 | 50.64 | 1877.0595 | −0.1 |
| 561 | 109 | 1.15E-09 | 2560.3219 | 1.3 | |
| 561 | 147 | 1.37E-13 | 2172.1661 | −0.6 | |
| 580 | 85 | 1.28E-11 | 45.79 | 1856.1238 | −0.5 |
| 649 | 85 | 8.37E-10 | 51.03 | 1563.9136 | −0.7 |
| 649 | 124 | 2.08E-10 | 45.04 | 1630.9042 | −0.3 |
| 649 | 304 | 36.54 | 2227.1581 | −7.6 | |
| 657 | 405 | 27.06 | 1937.1456 | −7.9 | |
| 660 | 85 | 1.29E-06 | 1455.8925 | −0.8 | |
| 707 | 85 | 1.03E-08 | 1617.0026 | −0.3 | |
| 713 | 364 | 35.84 | 2059.1279 | −0.5 | |
| 748 | 418 | 32.19 | 1957.0869 | −0.8 | |
| 750 | 418 | 44.43 | 1957.0843 | −2.1 | |
| 784 | 78 | 9.97E-07 | 2081.0428 | 2.5 | |
| 816 | 85 | 35.8 | 1959.1605 | −3.3 | |
| GCN5-ADA2B | |||||
|---|---|---|---|---|---|
| Linked K in GCN5 | Linked K in ADA2B | Score in pLink | Score in xQuest | Mass (Da) | Mass precision (ppm) |
| 314 | 328 | 44.78 | 2626.3341 | −0.4 | |
| 314 | 331 | 5.50E-07 | 57.22 | 2514.2217 | −0.8 |
| 314 | 378 | 7.20E-09 | 42.5 | 3089.6396 | −3.3 |
| 314 | 390 | 40.44 | 2753.3972 | −0.5 | |
| 361 | 390 | 4.30E-06 | 1942.0999 | −2.7 | |
| 536 | 214 | 2.43E-06 | 2651.5058 | −0.7 | |
| 572 | 214 | 2.85E-08 | 1664.9613 | −1.1 | |
| 572 | 220 | 7.75E-13 | 1720.9987 | −0.8 | |
| 580 | 250 | 38.81 | 2154.2570 | −7.7 | |
| 580 | 250 | 35.23 | 1870.0746 | −1.6 | |
| 702 | 250 | 29.07 | 2645.4865 | −3.5 | |
| GCN5-SGF29 | |||||
|---|---|---|---|---|---|
| Linked K in GCN5 | Linked K in SFG29 | Score in pLink | Score in xQuest | Mass (Da) | Mass precision (ppm) |
| 314 | 40 | 4.31E-11 | 3585.7811 | −1.3 | |
| 314 | 50 | 2.09E-08 | 38.84 | 3410.6459 | 0.2 |
| 561 | 40 | 2.71E-16 | 2852.4903 | 1.1 | |
| 561 | 50 | 5.72E-12 | 44.79 | 2673.3288 | −0.2 |
| 580 | 40 | 5.47E-09 | 2827.5303 | 1.9 | |
| 580 | 50 | 5.78E-10 | 51.09 | 2652.3947 | 0.1 |
| 649 | 40 | 1.06E-16 | 34.72 | 2539.3443 | −0.2 |
| 649 | 50 | 4.39E-10 | 43.37 | 2360.1818 | −0.7 |
| 649 | 79 | 1.49E-09 | 1404.7976 | −0.5 | |
| 649 | 112 | 6.92E-08 | 1365.7438 | 1.2 | |
| 816 | 40 | 4.67E-07 | 2934.5975 | −6.7 | |
| 816 | 50 | 1.39E-14 | 2755.4366 | 0.5 | |
| 855 | 50 | 1.85E-06 | 2638.3675 | −0.3 | |
| ADA3-ADA2B | |||||
|---|---|---|---|---|---|
| Linked K in ADA3 | Linked K in ADA2B | Score in pLink | Score in xQuest | Mass (Da) | Mass precision (ppm) |
| 147 | 235 | 7.92E-13 | 45.89 | 2644.4160 | 0.4 |
| 147 | 390 | 42.1 | 2033.1002 | −0.8 | |
| 194 | 331 | 3.05E-09 | 41.76 | 2069.1205 | −0.1 |
| 194 | 378 | 7.49E-06 | 2640.5114 | 0.0 | |
| 194 | 390 | 35.29 | 2304.2634 | −3.0 | |
| 210 | 319 | 3.62E-06 | 2446.2276 | 0.6 | |
| 210 | 319 | 3.33E-08 | 30.06 | 3172.6412 | −6.4 |
| 210 | 322 | 1.63E-10 | 39.13 | 2884.4199 | −0.1 |
| 210 | 322 | 2.88E-12 | 40.76 | 3016.5401 | −0.1 |
| 210 | 328 | 4.43E-06 | 56.43 | 2673.3658 | 0.2 |
| 210 | 331 | 7.99E-08 | 50.25 | 2557.2294 | −0.1 |
| 210 | 378 | 8.13E-06 | 3132.6454 | −0.6 | |
| 210 | 390 | 33.39 | 2796.4038 | −0.2 | |
| 221 | 319 | 4.79E-07 | 1431.8233 | 1.6 | |
| 221 | 322 | 9.36E-09 | 297.22 | 1874.0409 | 1.1 |
| 221 | 322 | 6.31E-15 | 45.29 | 1998.1108 | −0.4 |
| 221 | 328 | 3.39E-14 | 42.52 | 1654.9365 | 0.5 |
| 221 | 331 | 1.54E-09 | 44.44 | 1542.8210 | −2.8 |
| 221 | 373 | 1.63E-08 | 2087.2605 | 0.8 | |
| 221 | 378 | 30.64 | 2118.2407 | −0.3 | |
| 221 | 390 | 41.6 | 1781.9974 | −1.4 | |
| 223 | 328 | 3.72E-07 | 2270.3145 | 0.1 | |
| 223 | 378 | 2.86E-06 | 2729.5941 | 0.0 | |
| 242 | 328 | 1.06E-06 | 1783.0202 | −0.8 | |
| 242 | 378 | 2.96E-11 | 45.58 | 2246.3254 | 0.2 |
| 242 | 390 | 9.38E-06 | 44.71 | 1910.0836 | 0.5 |
| 304 | 378 | 4.59E-06 | 2741.5227 | −2.4 | |
| 304 | 390 | 42.97 | 2405.2822 | 0.3 | |
| 312 | 390 | 26.06 | 2977.5704 | −1.0 | |
| 354 | 390 | 40.72 | 2346.2754 | −0.6 | |
| 364 | 282 | 3.79E-07 | 1597.9274 | 0.2 | |
| 372 | 390 | 2.14E-07 | 41.31 | 1940.0690 | 0.1 |
| 397 | 403 | 29.07 | 2645.4865 | 1.0 | |
| ADA3-SGF29 | |||||
|---|---|---|---|---|---|
| Linked K in ADA3 | Linked K in SGF29 | Score in pLink | Score in xQuest | Mass (Da) | Mass precision (ppm) |
| 77 | 50 | 6.23E-14 | 33.99 | 3586.8165 | 0.2 |
| 78 | 50 | 4.17E-07 | 2141.0575 | 1.3 | |
| 85 | 40 | 2.34E-08 | 2574.4029 | −0.1 | |
| 85 | 50 | 1.70E-09 | 47.29 | 2399.2672 | 0.0 |
| 85 | 50 | 39.28 | 2555.3450 | −9.1 | |
| 97 | 50 | 34.14 | 3176.6059 | −0.6 | |
| 109 | 40 | 4.30E-08 | 3257.6652 | −0.3 | |
| 147 | 40 | 1.57E-11 | 2869.5094 | 0.4 | |
| 147 | 50 | 4.08E-10 | 45.14 | 2690.3476 | −0.4 |
| 372 | 40 | 1.38E-11 | 30.73 | 2772.4517 | −1.3 |
| 372 | 50 | 1.06E-06 | 2597.3158 | −0.6 | |
| 397 | 50 | 4.09E-07 | 2355.2078 | −0.1 | |
| 421 | 40 | 6.71E-06 | 2487.3193 | 0.3 | |
| 421 | 50 | 7.04E-07 | 2312.1834 | 0.4 | |
| 421 | 99 | 2.34E-07 | 2501.3789 | 0.6 | |
A linkage map has been produced from these results to visualize intrasubunit links and inter-subunit links (Fig. 4). This map clearly highlights several discrete inter-linked areas with high significance as shown by many contacts that have been detected for each of them. In particular, extensive cross-linking was observed between ADA3 and ADA2B suggesting a strong network of connections between these two subunits while no cross-links were detected between SGF29 and ADA2B. Remarkably, among the 22 lysines equally distributed on the SGF29 sequence, two lysines (K40 and K50) appeared to be mostly involved in inter-cross-linked products, suggesting that the bridging reaction occurred in a very specific way. On the other hand, no cross-links could be detected for the N-terminal half of GCN5 containing most of the PCAF domain, the Tudor domain of SGF29, and the ZZ-SANT domains of ADA2B.
Figure 4.
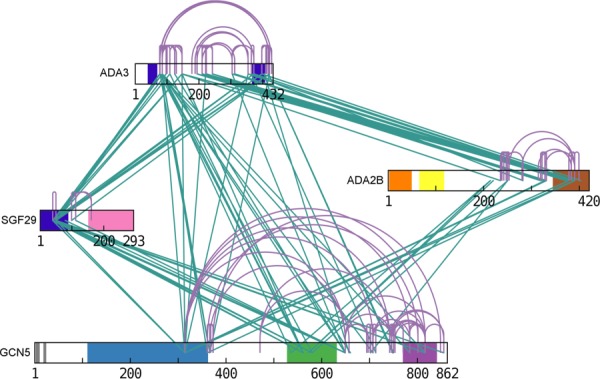
Inter- (green) and intra- (purple) molecular cross-linking map within the SAGA HAT subunits obtained with the BS3 d0-d4 cross-linking agent. The represented cross-links are deduced from both xQuest and pLink identification. Colors are consistent with Figure 1(A).
Molecular modeling
Atomic structures of several domains composing the HAT subunits are available [SANT, Tudor, acetyltransferase, and bromo domains, Fig. 1(A)] or can be predicted by homology modeling of closely related sequences (PCAF, ZZ, SWIRM). Intrasubunit cross-links were used as additional spatial restraints helping to predict tertiary models of the SAGA HAT subunits since the relative positions of their domains are not known. For each subunit, domains with known or modelled structure were positioned in a way that minimizes the distances between the cross-linked lysines. That was achieved with a rigid body docking approach where the domain structure was not deformed.
For GCN5 the intricate interaction network has allowed to position the PCAF, acetyltransferase and bromo domains satisfying the maximum theoretical distances between cross-linked lysines [Fig. 5(A)]. The only exception is the connection between lysines K361 and K801 [Fig. 5(B)]. K361 residue is situated within a disordered region between PCAF and acetyltransferase domains, that region is flexible and thus the lysine residue may occupy a different position. The whole GCN5 subunit is heavily cross-linked with the exception of N-terminus including mostly PCAF domain. According to the secondary structure prediction this part of the protein is mostly helical. We note that about 40% of GCN5 sequence, comprising the gaps between three known domains, is unstructured and we could not predict tertiary structure of these areas. In case of ADA2B protein most of the cross-links were detected in C-terminal part. ZZ and SANT domains that are known to stimulate nucleosome binding are not involved in any interactions [Fig. 5(C,D)]. The middle part of ADA2B does not have a specific structure and represent around 45% of total sequence. The complete structure of ADA3 was predicted by comparative modeling and docking of four domains (see Materials and Methods section) since no homologs with known structures were found. Secondary structure prediction showed that this protein is mostly helical with two short coiled-coil domains at the termini [Fig. 5(E,F)]. In the case of SGF29 we have modelled the structure of the coiled coil domain (3–88), but unfortunately this model is of low quality since the protein does not display enough intralinks that would allow more accurate structure modeling.
Figure 5.

Tertiary subunit architecture modelled by intrasubunit cross-links. (A, C, E) Modeling of the conserved domains of GCN5, ADA2B, and ADA3, respectively. Red spheres correspond to lysine residues involved in intrasubunit cross-links, grey spheres show the nonmodified lysines and black lines represent the distance between the cross-linked residues. (B, D, F) Calculated distances between all cross-linked residues of GCN5, ADA2B, and ADA3, respectively. The 30Å threshold is indicated by a dotted line.
In order to obtain an initial low-resolution model of SAGA HAT subcomplex, all four subunits were positioned one with respect to the others by minimizing the distances between inter-subunit cross-linked lysines and by avoiding any steric clashes between the atomic models [Fig. 6(A,B)]. This model of the SAGA HAT module is still missing several unstructured parts of subunits and might be further improved by molecular dynamics methods since here only rigid-body docking was used.
Figure 6.

Quaternary organization of the SAGA HAT module. (A) Schematic representation of the 3D organization of the conserved SAGA HAT subunit domains obtained upon distance minimization of intersubunit cross-linked lysine residues. (B) Proposed 3-D model of the SAGA HAT module in which the atomic models of the conserved domains are positioned and oriented according to the cross-linking network and avoiding structural overlap. The model represents 63% of the SAGA HAT residues.
Discussion
In this project, chemical cross-linking-mass spectrometry was used in combination with modeling in order to build a low-resolution structural model of the SAGA HAT subcomplex. Even with advances in mass spectrometry technology or with cross-linking reagents improvements, data interpretation is still challenging and the problem of extracting effective cross-linked peptide from random matching remains.
Strategy and validation of the identification of cross-linked peptides
MALDI-TOF allowed a straightforward comparison between control and cross-linked samples and thus a direct determination of the binding stoichiometry. While ESI-MS is shown to be an appropriate method to characterize noncovalent complexes in terms of existence and stoichiometry,46 it could not be used in this particular case, since the SAGA HAT subcomplex could not be transferred properly to a volatile ammonium acetate buffer. Chemical cross-linking appeared as a nice alternative by covalently stabilizing the complex before its characterization by mass spectrometry so that it could withstand denaturing conditions and be analyzed by methods that usually lead to complex dissociation. A bottom-up approach was then used to look for the cross-linked peptides and establish a linkage map. As already described in the literature,47,48 mass spectrometer yielding high-resolution measurement of peptide and fragment masses but also able to precisely determine the charged states, appeared to be essential for the success of the database search. The large number of bridged products that are arising from all possible pair-wise combination of peptides containing a lysine should be considered, which generates a very large theoretical database and increases the risk of random matches if mass accuracy is not sufficient. In our case, the parameters of mass spectrometer (mass range of 300–1200 m/z) allowed us to analyze a large majority of digested peptides present in solution without compromising the high mass accuracy and high resolution. All matched peptides displayed a mass accuracy within 6 ppm from which 97% were lower than 2 ppm.
Interestingly, the overall connectivity pattern of the pLink- and xQuest-extracted maps is very convergent (Supporting Information Fig. 4). Each of the putative linked areas has been observed with both algorithms and combining the results of both searches yielded a more expressive network map. Some limitations of one algorithm might be compensated by the other (pLink requires generous fragmentation spectra of the cross-linked peptide, whereas xQuest needs quality fragmentation spectra for both d0 and d4 modified peptide).
Several observations strengthen the validation of our putative linkage map. (i) Each linked area is defined by multiple peptide pairs (for example, 6 and 7 links respectively are detected to propose a connection between the N- and C-termini of ADA3 with the N-terminal domain of SGF29). (ii) Most of the time, there is a correlation between inter and intrasubunit linkages. For example, the lysine K40 of SGF29 is in the vicinity of the lysines K85 and K421 of ADA3 whereas intrasubunit link between K85 and K421 of ADA3 strongly suggests that these two lysines are brought close to each other by the tertiary fold of the subunit. (iii) The analysis of deletion mutants have shown an interaction between yAda2b residues 167–434 (including the SWIRM domain) with C-terminus of Ada349 which is fully consistent with our observations. (iv) Yeast two hybrid approaches demonstrated an interaction between the N-termini of SGF29 and of ADA350–53 which is also revealed by our experiments.
The absence of observed cross-linked peptides might also be worth to exploit but it is not straightforward to unambiguously correlate no cross-linking with distant lysines (i.e. higher than the known 30 Å maximum distance of Cα–Cα atoms of peptides that can be cross-linked by BS354,55). Indeed, various situations could prevent reaction with the cross-linker: (i) there is no lysine in a particular domain (only four lysines in the ADA2B N-terminus domain); (ii) the lysines may not be accessible to the cross-linker (buried in the structure) or not reactive because of chemical environment. Looking at dead-end peptides could likely help to address this purpose (see Supporting Information Table 3). In our case, 53% of the lysines in the GCN5 PCAF domain have been shown to possibly react with BS3, meaning that they are accessible to the solvent but without forming cross-links. On the other hand, only two lysines among 12 in SGF29 Tudor domain have been detected as dead-end modified lysine, strongly suggesting that these lysines are not available for cross-linking reaction. Interestingly these noncross-linked domains are often involved in interactions with modified histone tails and are likely to be exposed to bind nucleosomes thus being less prone to interactions with subunits of the HAT module.37,56 In such situation, the use of cross-linkers containing other types of reactive functions (photo-reactive cross-linkers, sulfhydryl cross-linkers etc.) is also conceivable. In these cases, it may be important to adapt the cross-links identification software to be used. (iii) The mass/charge of cross-linked peptides may be higher than 1200 m/z to be selected by the MS for fragmentation, or too short (less than three amino acids) to give sufficient information for being recognized during database search; (iv) the fragmentation mass spectrum is of poor quality to be unambiguously interpreted.
Biological relevance of our linkage map
We compared our results with the recently published linkage map of the full yeast SAGA.57 The yeast and human subunits show a large degree of sequence conservation except for hGCN5 which contains an additional PCAF domain at its N-terminus and the yAda3 subunit which is twice as large as hADA3. Despite a different lysine distribution in the sequences from two organisms, the network of domain interactions is highly conserved with the notable exception of ySgf29 which shows a large number of intrasubunit links and only interacts with yAda3 while hSGF29 has a strong interaction network with the most domains of hGCN5 (Fig. 4). The interaction between yeast Sgf29 and Gcn5 was previously demonstrated by systematic deletion analysis.58 The same regions of hGCN5 make extensive cross-links with hADA3 along its whole sequence while in yeast the link between these two subunits is limited to a single domain in the C-terminal part of yAda3. Rather than reflecting the differences in primary sequence between the two organisms, we suggest that these differences in the cross-linking network reflect a conformational change between the free HAT module and when it is incorporated into the complete SAGA complex. Interestingly, the domains that show less cross-links within the HAT module in the yeast complex are strongly involved in interactions with other SAGA subunits. As shown by Han et al.,57 in yeast Ada3 has few intra- and interlinks with subunits of HAT module, at the same time revealing numerous cross-links with other proteins like Taf5, Taf6, Taf12, Spt7, Sgf73, and Ada1. We show that in human ADA3 is extensively cross-linked to the other HAT subunits: ADA2B, SGF29. and GCN5. Altogether these results suggest that the HAT module is reorganized upon integration in the SAGA complex.
The histidine pull down assays [Fig. 1(C)] do not completely recapitulate the cross-linking experiments and it appears that proximity does not imply interaction. Cross-linking results indicate that the N-terminus of SGF29 is close to GCN5 but this proximity is not enough to form a stable pair-wise interaction. SGF29 requires the presence of both ADA3 and ADA2B to establish a network of interactions leading to a HAT subcomplex. Likewise the ADA2B and ADA3 subunits incorporate significantly into the subcomplex only when they are co-expressed together with GCN5. The last observation is partially supported by the fact that yAda2 plays a critical role in the formation of the HAT module and its association with the overall SAGA complex.36
The interaction between CX-MS and molecular modeling is very promising. The data generated by CX-MS will provide associations and restraints information that will help to eliminate inconsistent theoretical models. In combination with complementary techniques, CX-MS is moving to integrate a general pipeline that aim to iteratively improve the accuracy of the proposed structural model with a final objective of determining the closest one to the real state of the complex at a particular moment of its life. Large, heterogeneous or dynamic complexes would benefit from such an alternative approach since traditional structural biology methods are often difficult to carry through.
Materials and Methods
SAGA HAT expression and purification
The constructs for the expression of the HAT module of SAGA (hGCN5, hADA2B, mADA3, hSGF29) were generated using baculovirus Multibac system.41 Briefly, hGCN5 with TEV-cleavable 6xHis-tag on N-terminus was cloned into pFL acceptor plasmid, the other three genes encoding hADA2B, mADA3, and hSGF29 were cloned into donor plasmids (pIDS, pIDC and pIDK respectively), which were subsequently combined via Cre-Lox recombination. The total construct was integrated via Tn7 transposition into a bacmid with YFP at the backbone as an expression level marker. The bacmid was isolated and used for infection of 1 L Sf21 insect cells (160 mL of virus for 1 L of SF21 insect cells in Sf900II serum-free media, MOI 15–20). YFP fluorescence was used to monitor overall expression levels after the day of infection. Cells were harvested in ice cold PBS with 10% glycerol when YFP levels reached a plateau (72 h). All further purification steps were done at 4°C.
Cell pellet from 1 L of culture was dissolved in 40 mL of lysis buffer (20 mM HEPES-KOH pH 8.0, 500 mM NaCl, 10% glycerol, Protease Inhibitor Cocktail (Roche)) and mildly sonicated on ice for 3 min. Cell extract was further cleared by ultracentrifugation for 1 h at 50,000 g, HAT subcomplexes were purified by His-tag using HiTrap Chelating HP 5 mL column (GE Healthcare), previously loaded with nickel. After washing steps with increasing concentration of imidazole, HAT subcomplexes were eluted at 250 mM imidazole as confirmed by 10% SDS-PAGE. Peak elutions were pooled and further purified on Superdex S200 16/60 GL (GE Healthcare) gel filtration column. Complexes were eluted in a similar buffer (20 mM HEPES-KOH pH 8.0, 500 mM NaCl, 10% glycerol, 1 mM DTT, 0.1 mM EDTA) and analyzed by 10% SDS-PAGE. Peak fractions were pooled, concentrated on Amicon 30 kDa column, then flash frozen in liquid nitrogen and stored at −80°C.
During purification steps, protein concentrations were controlled by Bradford assay,59 their quality by SDS-PAGE60 and the identity of the subunits by Western Blotting.61
Pull-down assays
Constructs for expression of different subunit combinations were generated using Multibac system and expressed in insect cells as described before. Small scale purifications using histidine-tag on GCN5 were performed in batch and eluates were analyzed on 10% SDS-PAGE.
Cross-linking and MALDI-MS data acquisition
Before cross-linking reaction, the complex was subjected to buffer exchange to 20 mM HEPES, 100 mM NaCl in 4°C to eliminate glycerol (Micro Bio-Spin chromatography column, exclusion limit 6 kDa). An equimolar mixture of the BS3 cross-linking reagent (Thermo Scientific) in the normal form (d0) and isotopically labeled form (d4) was prepared by dissolving in water. Cross-linking reactions were carried out on 30 µL of a 2 mg/mL protein complex at various protein to cross-linker molar ratios namely 1:50, 1:75, 1:200 at two incubation times (30 min, 2 h). From these assays, the optimal conditions for cross-linking reaction were fixed at a ratio protein:cross-linker 1:75 (equivalent to a lysine:crosslinker molar ratio of 1:0.5 since SAGA HAT subcomplex contains 164 lysine residues) for 30 min at room temperature. The reaction was quenched with Tris 25 mM final concentration at pH 7.5. The intact and cross-linked complexes were analyzed by MALDI-MS (Autoflex II TOF/TOF, Bruker) equipped with a HM1 high mass detector (CovalX, Switzerland). Sinapinic acid (SA) matrix at 10 mg/mL in H2O/ACN/TFA (50/50/0.3) and a dried drop spotting method were chosen. The analyses were performed in a linear acquisition mode and the MALDI calibration was achieved with a solution of BSA at 5 µM using the monocharged ions of the monomer and dimer of BSA (Sigma-Aldrich).
LC-MS/MS data acquisition
After cross-linking, the protein complex was digested with trypsin (Sequencing Grade Modified, Promega) at a 1:5 enzyme to substrate molar ratio and incubated for 3 h at 37°C. The reaction was quenched with addition of TFA at final concentration of 0.1%. MALDI analysis was performed as a control after digestion, in order to ensure that there was no more signal corresponding to the entire complex. LC-MS/MS data were acquired on an LTQ Orbitrap Elite mass spectrometer (Thermo Scientific) equipped with a nano electrospray ionization source in positive ion mode coupled with a Rapid Separation LC system (nanoRSLC U3000, Thermo Scientific), using HCD fragmentation mode. The isolation window of precursor ion was fixed at 2 Da, and the HCD collision energy at 30% for the fragmentation. A full-scan survey MS spectrum (300–1200 m/z) was carried out with resolution of 240,000 at m/z 400, then the fifteen most abundant ions detected were submitted to a MS/MS experiment in Orbitrap at resolution 15,000.
MS data analysis
Two search engines, dedicated to cross-linked peptides xQuest (v2.1.1, http://proteomics.ethz.ch/cgi-bin/xquest2_cgi/index.cgi) and pLink (v1.15, http://pfind.ict.ac.cn/software/pLink), were used. In the xQuest searches, the precursor mass tolerance was set at 10 ppm as well as the fragment mass tolerance for common- and cross-linked ions. In pLink, the tolerance for MS1 matching was fixed at 10 ppm and the filter for peptide tolerance at 10 ppm. Each data set was produced using a FPR of 5%. All spectra of putative cross-linked peptides were manually controlled before positive identification. The bridged peptides were confidently identified when the majority of the observed fragment ions were assigned and when more than three consecutive fragment ions were matching for both linked peptides. The interaction maps between subunits were drawn via xiNET-Crosslink Viewer (http://crosslinkviewer.org), developed in Rappsilber laboratory.
SAGA HAT sequence analysis and structural modeling
Multisequence alignment of SAGA HAT subunits from different species allowed to identify the conserved structural domains. Homology modeling for the domains without known structure was used to predict the atomic models, otherwise the available crystal structures were found in PDB database. Intramolecular cross-linking data provided the distance restraints for further improving the homology models of each domain. Complete models of GCN5, ADA2B, and ADA3 were generated using rigid-body fitting with imposed cross-linking restraints (maximum distance between cross-linked lysines was set to 30 Å). The quality of the final models was verified using several bioinformatics algorithms, all models received good to fair scores (Supporting Information Table 4). The best predicted atomic models of all subunits were positioned and oriented according to the intersubunit cross-linking network and avoiding structural overlap, thus resulting into the 3-D model of the SAGA HAT module.
Disclosure: The authors declare no competing financial interest and no conflict of interest.
Acknowledgments
N-T. N-H. is supported by a PhD Scholarship from the French MESR (Ministère de l'Enseignement Supérieur et de la Recherche). The authors would like to thank the Proteomic Platform of IGBMC where the purchase of the LTQ Orbitrap Elite mass spectrometer was supported by the ARC Foundation, and the Proteomic Platform of IBMC (Institut de Biologie Moléculaire et Cellulaire) in Strasbourg, France, for their contribution to this project.
Glossary
- amu
atomic mass units
- BSA
bovine serum albumin
- CX
chemical cross-linking
- DOPE
discrete optimized protein energy
- EM
electron microscopy
- ESI-MS
electrospray ionization mass spectrometry
- H/D exchange
hydrogen/deuterium exchange
- HCD
higher-energy collisional dissociation
- IM
ion mobility
- IMAC
immobilized metal affinity chromatography
- LC-MS/MS
liquid chromatography coupled with mass spectrometry in tandem
- MALDI-MS
matrix assisted laser desorption/ionization mass spectrometry
- MOI
multiplicity of infection
- NMR
nuclear magnetic resonance
- PBS
phosphate buffered saline
- SDS-PAGE
sodium dodecyl sulfate polyacrylamide gel electrophoresis
- SEC
size exclusion chromatography
- TFA
trifluoroacetic acid
- XRD
X-ray diffraction.
Supporting Information
Additional Supporting Information may be found in the online version of this article.
Supplementary Information
Supplementary Information Figure 1.
Supplementary Information Figure 2.
Supplementary Information Figure 3.
Supplementary Information Figure 4.
Supplementary Information Table 1.
Supplementary Information Table 2.
Supplementary Information Table 3.
Supplementary Information Table 4.
References
- Purdy MD, Bennett BC, McIntire WE, Khan AK, Kasson PM, Yeager M. Function and dynamics of macromolecular complexes explored by integrative structural and computational biology. Curr Opin Struct Biol. 2014;27:138–148. doi: 10.1016/j.sbi.2014.08.006. [DOI] [PMC free article] [PubMed] [Google Scholar]
- Göbl C, Madl T, Simon B, Sattler M. NMR approaches for structural analysis of multidomain proteins and complexes in solution. Prog Nucl Magn Reson Spectrosc. 2014;80:26–63. doi: 10.1016/j.pnmrs.2014.05.003. [DOI] [PubMed] [Google Scholar]
- Rodrigues JPGLM, Bonvin AMJJ. Integrative computational modeling of protein interactions. FEBS J. 2014;281:1988–2003. doi: 10.1111/febs.12771. [DOI] [PubMed] [Google Scholar]
- Heck AJR. Native mass spectrometry: a bridge between interactomics and structural biology. Nat Methods. 2008;5:927–933. doi: 10.1038/nmeth.1265. [DOI] [PubMed] [Google Scholar]
- Lanucara F, Holman SW, Gray CJ, Eyers CE. The power of ion mobility-mass spectrometry for structural characterization and the study of conformational dynamics. Nat Chem. 2014;6:281–294. doi: 10.1038/nchem.1889. [DOI] [PubMed] [Google Scholar]
- Konermann L, Tong X, Pan Y. Protein structure and dynamics studied by mass spectrometry: H/D exchange, hydroxyl radical labeling, and related approaches. J Mass Spectrom. 2008;43:1021–1036. doi: 10.1002/jms.1435. [DOI] [PubMed] [Google Scholar]
- Merkley ED, Cort JR, Adkins JN. Cross-linking and mass spectrometry methodologies to facilitate structural biology: finding a path through the maze. J Struct Funct Genomics. 2013;14:77–90. doi: 10.1007/s10969-013-9160-z. [DOI] [PMC free article] [PubMed] [Google Scholar]
- Stengel F, Aebersold R, Robinson CV. Joining Forces: Integrating Proteomics and Cross-linking with the Mass Spectrometry of Intact Complexes. Mol Cell Proteomics. 2012;11 doi: 10.1074/mcp.R111.014027. :R111.014027. [DOI] [PMC free article] [PubMed] [Google Scholar]
- Singh P, Panchaud A, Goodlett DR. Chemical Cross-Linking and Mass Spectrometry As a Low-Resolution Protein Structure Determination Technique. Anal Chem. 2010;82:2636–2642. doi: 10.1021/ac1000724. [DOI] [PubMed] [Google Scholar]
- Leitner A, Walzthoeni T, Kahraman A, Herzog F, Rinner O, Beck M, Aebersold R. Probing Native Protein Structures by Chemical Cross-linking, Mass Spectrometry, and Bioinformatics. Mol Cell Proteomics. 2010;9:1634–1649. doi: 10.1074/mcp.R000001-MCP201. [DOI] [PMC free article] [PubMed] [Google Scholar]
- Rappsilber J. The beginning of a beautiful friendship: Cross-linking/mass spectrometry and modelling of proteins and multi-protein complexes. J Struct Biol. 2011;173:530–540. doi: 10.1016/j.jsb.2010.10.014. [DOI] [PMC free article] [PubMed] [Google Scholar]
- Murakami K, Elmlund H, Kalisman N, Bushnell DA, Adams CM, Azubel M, Elmlund D, Levi-Kalisman Y, Liu X, Gibbons BJ, Levitt M, Kornberg RD. Architecture of an RNA polymerase II transcription pre-initiation complex. Science. 2013;342:1238724. doi: 10.1126/science.1238724. [DOI] [PMC free article] [PubMed] [Google Scholar]
- Müller MQ, Sinz A. Chemical cross-linking and high-resolution mass spectrometry to study protein–drug interactions. Methods Mol Biol. 2012;803:205–218. doi: 10.1007/978-1-61779-364-6_14. [DOI] [PubMed] [Google Scholar]
- Kalisman N, Adams CM, Levitt M. Subunit order of eukaryotic TRiC/CCT chaperonin by cross-linking, mass spectrometry, and combinatorial homology modeling. Proc Natl Acad Sci. 2012;109:2884–2889. doi: 10.1073/pnas.1119472109. [DOI] [PMC free article] [PubMed] [Google Scholar]
- Lössl P, Kölbel K, Tänzler D, Nannemann D, Ihling CH, Keller MV, Schneider M, Zaucke F, Meiler J, Sinz A. Analysis of nidogen-1/laminin γ1 interaction by cross-linking, mass spectrometry, and computational modeling reveals multiple binding modes. PLoS ONE. 2014;9:e112886. doi: 10.1371/journal.pone.0112886. [DOI] [PMC free article] [PubMed] [Google Scholar]
- Thierbach K, von Appen A, Thoms M, Beck M, Flemming D, Hurt E. Protein Interfaces of the Conserved Nup84 Complex from Chaetomium thermophilum Shown by Crosslinking Mass Spectrometry and Electron Microscopy. Structure. 2013;21:1672–1682. doi: 10.1016/j.str.2013.07.004. [DOI] [PubMed] [Google Scholar]
- Kim SJ, Fernandez-Martinez J, Sampathkumar P, Martel A, Matsui T, Tsuruta H, Weiss TM, Shi Y, Markina-Inarrairaegui A, Bonanno JB, Sauder JM, Burley SK, Chait BT, Almo SC, Rout MP, Sali A. Integrative Structure–Function Mapping of the Nucleoporin Nup133 Suggests a Conserved Mechanism for Membrane Anchoring of the Nuclear Pore Complex. Mol. Cell. Proteomics. 2014;13:2911–2926. doi: 10.1074/mcp.M114.040915. [DOI] [PMC free article] [PubMed] [Google Scholar]
- Paramelle D, Miralles G, Subra G, Martinez J. Chemical cross-linkers for protein structure studies by mass spectrometry. Proteomics. 2013;13:438–456. doi: 10.1002/pmic.201200305. [DOI] [PubMed] [Google Scholar]
- Sutherland BW, Toews J, Kast J. Utility of formaldehyde cross-linking and mass spectrometry in the study of protein–protein interactions. J Mass Spectrom. 2008;43:699–715. doi: 10.1002/jms.1415. [DOI] [PubMed] [Google Scholar]
- Rhode BM, Hartmuth K, Urlaub H, Lührmann R. Analysis of site-specific protein-RNA cross-links in isolated RNP complexes, combining affinity selection and mass spectrometry. RNA. 2003;9:1542–1551. doi: 10.1261/rna.5175703. [DOI] [PMC free article] [PubMed] [Google Scholar]
- Fritzsche R, Ihling CH, Götze M, Sinz A. Optimizing the enrichment of cross-linked products for mass spectrometric protein analysis. Rapid Commun Mass Spectrom. 2012;26:653–658. doi: 10.1002/rcm.6150. [DOI] [PubMed] [Google Scholar]
- Lascoux D, Paramelle D, Subra G, Heymann M, Geourjon C, Martinez J, Forest E. Discrimination and selective enhancement of signals in the MALDI mass spectrum of a protein by combining a matrix-based label for lysine residues with a neutral matrix. Angew Chem Int Ed. 2007;46:5594–5597. doi: 10.1002/anie.200700811. [DOI] [PubMed] [Google Scholar]
- Paramelle D, Cantel S, Enjalbal C, Amblard M, Forest E, Heymann M, Geourjon C, Martinez J, Subra G. A new generation of cross-linkers for selective detection by MALDI MS. Proteomics. 2009;9:5384–5388. doi: 10.1002/pmic.200900562. [DOI] [PubMed] [Google Scholar]
- Götze M, Pettelkau J, Schaks S, Bosse K, Ihling CH, Krauth F, Fritzsche R, Kühn U, Sinz A. StavroX—A Software for Analyzing Crosslinked Products in Protein Interaction Studies. J Am Soc Mass Spectrom. 2011;23:76–87. doi: 10.1007/s13361-011-0261-2. [DOI] [PubMed] [Google Scholar]
- Rasmussen MI, Refsgaard JC, Peng L, Houen G, Højrup P. CrossWork: Software-assisted identification of cross-linked peptides. J Proteomics. 2011;74:1871–1883. doi: 10.1016/j.jprot.2011.04.019. [DOI] [PubMed] [Google Scholar]
- Yang B, Wu YJ, Zhu M, Fan SB, Lin J, Zhang K, Li S, Chi H, Li YX, Chen HF, Luo SK, Ding YH, Wang LH, Hao Z, Xiu LY, Chen S, Ye K, He SM, Dong MQ. Identification of cross-linked peptides from complex samples. Nat Methods. 2012;9:904–906. doi: 10.1038/nmeth.2099. [DOI] [PubMed] [Google Scholar]
- Rinner O, Seebacher J, Walzthoeni T, Mueller L, Beck M, Schmidt A, Mueller M, Aebersold R. Identification of cross-linked peptides from large sequence databases. Nat Methods. 2008;5:315–318. doi: 10.1038/nmeth.1192. [DOI] [PMC free article] [PubMed] [Google Scholar]
- Grant PA, Duggan L, Côté J, Roberts SM, Brownell JE, Candau R, Ohba R, Owen-Hughes T, Allis CD, Winston F. Yeast Gcn5 functions in two multisubunit complexes to acetylate nucleosomal histones: characterization of an Ada complex and the SAGA (Spt/Ada) complex. Genes Dev. 1997;11:1640–1650. doi: 10.1101/gad.11.13.1640. , Berger SL, Workman JL ( [DOI] [PubMed] [Google Scholar]
- Grünberg S, Hahn S. Structural insights into transcription initiation by RNA polymerase II. Trends Biochem Sci. 2013;38:603–611. doi: 10.1016/j.tibs.2013.09.002. [DOI] [PMC free article] [PubMed] [Google Scholar]
- Hahn S, Young ET. Transcriptional regulation in Saccharomyces cerevisiae: transcription factor regulation and function, mechanisms of initiation, and roles of activators and coactivators. Genetics. 2011;189:705–736. doi: 10.1534/genetics.111.127019. [DOI] [PMC free article] [PubMed] [Google Scholar]
- Nagy Z, Tora L. Distinct GCN5/PCAF-containing complexes function as co-activators and are involved in transcription factor and global histone acetylation. Oncogene. 2007;26:5341–5357. doi: 10.1038/sj.onc.1210604. [DOI] [PubMed] [Google Scholar]
- Spedale G, Timmers HTM, Pijnappel WWMP. ATAC-king the complexity of SAGA during evolution. Genes Dev. 2012;26:527–541. doi: 10.1101/gad.184705.111. [DOI] [PMC free article] [PubMed] [Google Scholar]
- Eisenmann DM, Chapon C, Roberts SM, Dollard C, Winston F. The Saccharomyces cerevisiae SPT8 gene encodes a very acidic protein that is functionally related to SPT3 and TATA-binding protein. Genetics. 1994;137:647–657. doi: 10.1093/genetics/137.3.647. [DOI] [PMC free article] [PubMed] [Google Scholar]
- Brand M, Leurent C, Mallouh V, Tora L, Schultz P. Three-dimensional structures of the TAFII-containing complexes TFIID and TFTC. Science. 1999;286:2151–2153. doi: 10.1126/science.286.5447.2151. [DOI] [PubMed] [Google Scholar]
- Wu P-YJ, Ruhlmann C, Winston F, Schultz P. Molecular Architecture of the S. cerevisiae SAGA Complex. Mol Cell. 2004;15:199–208. doi: 10.1016/j.molcel.2004.06.005. [DOI] [PubMed] [Google Scholar]
- Lee KK, Sardiu ME, Swanson SK, Gilmore JM, Torok M, Grant PA, Florens L, Workman JL, Washburn MP. Combinatorial depletion analysis to assemble the network architecture of the SAGA and ADA chromatin remodeling complexes. Mol Syst Biol. 2011;7:503. doi: 10.1038/msb.2011.40. [DOI] [PMC free article] [PubMed] [Google Scholar]
- Bian C, Xu C, Ruan J, Lee KK, Burke TL, Tempel W, Barsyte D, Li J, Wu M, Zhou BO, Fleharty BE, Paulson A, Allali-Hassani A, Zhou JQ, Mer G, Grant PA, Workman JL, Zang J, Min J. Sgf29 binds histone H3K4me2/3 and is required for SAGA complex recruitment and histone H3 acetylation. EMBO J. 2011;30:2829–2842. doi: 10.1038/emboj.2011.193. [DOI] [PMC free article] [PubMed] [Google Scholar]
- Durant M, Pugh BF. Genome-wide relationships between TAF1 and histone acetyltransferases in Saccharomyces cerevisiae. Mol Cell Biol. 2006;26:2791–2802. doi: 10.1128/MCB.26.7.2791-2802.2006. [DOI] [PMC free article] [PubMed] [Google Scholar]
- Hassan AH, Prochasson P, Neely KE, Galasinski SC, Chandy M, Carrozza MJ, Workman JL. Function and selectivity of bromodomains in anchoring chromatin-modifying complexes to promoter nucleosomes. Cell. 2002;111:369–379. doi: 10.1016/s0092-8674(02)01005-x. [DOI] [PubMed] [Google Scholar]
- Vermeulen M, Eberl HC, Matarese F, Marks H, Denissov S, Butter F, Lee KK, Olsen JV, Hyman AA, Stunnenberg HG, Mann M. Quantitative interaction proteomics and genome-wide profiling of epigenetic histone marks and their readers. Cell. 2010;142:967–980. doi: 10.1016/j.cell.2010.08.020. [DOI] [PubMed] [Google Scholar]
- Trowitzsch S, Bieniossek C, Nie Y, Garzoni F, Berger I. New baculovirus expression tools for recombinant protein complex production. J Struct Biol. 2010;172:45–54. doi: 10.1016/j.jsb.2010.02.010. [DOI] [PubMed] [Google Scholar]
- Lee YJ, Lackner LL, Nunnari JM, Phinney BS. Shotgun Cross-Linking Analysis for Studying Quaternary and Tertiary Protein Structures. J Proteome Res. 2007;6:3908–3917. doi: 10.1021/pr070234i. [DOI] [PubMed] [Google Scholar]
- Wenzel R, Röhling U, Nazabal A, Hillenkamp F. A detector device for high mass ion detection, a method for analyzing ions of high mass and a device for selection between ion detectors. 2009. Available from: Patent WO/2009/086642.
- Müller DR, Schindler P, Towbin H, Wirth U, Voshol H, Hoving S, Steinmetz MO. Isotope-tagged cross-linking reagents. A new tool in mass spectrometric protein interaction analysis. Anal Chem. 2001;73:1927–1934. doi: 10.1021/ac001379a. [DOI] [PubMed] [Google Scholar]
- Gaucher SP, Hadi MZ, Young MM. Influence of crosslinker identity and position on gas-phase dissociation of Lys–Lys crosslinked peptides. J Am Soc Mass Spectrom. 2006;17:395–405. doi: 10.1016/j.jasms.2005.11.023. [DOI] [PubMed] [Google Scholar]
- Hilton GR, Benesch JLP. Two decades of studying non-covalent biomolecular assemblies by means of electrospray ionization mass spectrometry. J R Soc Interface. 2012;9:801–816. doi: 10.1098/rsif.2011.0823. [DOI] [PMC free article] [PubMed] [Google Scholar]
- Mann M, Hendrickson RC, Pandey A. Analysis of proteins and proteomes by mass spectrometry. Annu Rev Biochem. 2001;70:437–473. doi: 10.1146/annurev.biochem.70.1.437. [DOI] [PubMed] [Google Scholar]
- Schubert P, Hoffman MD, Sniatynski MJ, Kast J. Advances in the analysis of dynamic protein complexes by proteomics and data processing. Anal Bioanal Chem. 2006;386:482–493. doi: 10.1007/s00216-006-0609-9. [DOI] [PubMed] [Google Scholar]
- Candau R, Berger SL. Structural and functional analysis of yeast putative adaptors. Evidence for an adaptor complex in vivo. J Biol Chem. 1996;271:5237–5245. doi: 10.1074/jbc.271.9.5237. [DOI] [PubMed] [Google Scholar]
- Kurabe N, Katagiri K, Komiya Y, Ito R, Sugiyama A, Kawasaki Y, Tashiro F. Deregulated expression of a novel component of TFTC/STAGA histone acetyltransferase complexes, rat SGF29, in hepatocellular carcinoma: Possible implication for the oncogenic potential of c-Myc. Oncogene. 2007;26:5626–5634. doi: 10.1038/sj.onc.1210349. [DOI] [PubMed] [Google Scholar]
- Ito T, Chiba T, Ozawa R, Yoshida M, Hattori M, Sakaki Y. A comprehensive two-hybrid analysis to explore the yeast protein interactome. Proc Natl Acad Sci U S A. 2001;98:4569–4574. doi: 10.1073/pnas.061034498. [DOI] [PMC free article] [PubMed] [Google Scholar]
- Rolland T, Taşan M, Charloteaux B, Pevzner SJ, Zhong Q, Sahni N, Yi S, Lemmens I, Fontanillo C, Mosca R, Kamburov A, Ghiassian SD, Yang X, Ghamsari L, Balcha D, Begg BE, Braun P, Brehme M, Broly MP, Carvunis AR, Convery-Zupan D, Corominas R, Coulombe-Huntington J, Dann E, Dreze M, Dricot A, Fan C, Franzosa E, Gebreab F, Gutierrez BJ, Hardy MF, Jin M, Kang S, Kiros R, Lin GN, Luck K, MacWilliams A, Menche J, Murray RR, Palagi A, Poulin MM, Rambout X, Rasla J, Reichert P, Romero V, Ruyssinck E, Sahalie JM, Scholz A, Shah AA, Sharma A, Shen Y, Spirohn K, Tam S, Tejeda AO, Trigg SA, Twizere JC, Vega K, Walsh J, Cusick ME, Xia Y, Barabási AL, Iakoucheva LM, Aloy P, De Las Rivas J, Tavernier J, Calderwood MA, Hill DE, Hao T, Roth FP, Vidal M. A proteome-scale map of the human interactome network. Cell. 2014;159:1212–1226. doi: 10.1016/j.cell.2014.10.050. [DOI] [PMC free article] [PubMed] [Google Scholar]
- Rual J-F, Venkatesan K, Hao T, Hirozane-Kishikawa T, Dricot A, Li N, Berriz GF, Gibbons FD, Dreze M, Ayivi-Guedehoussou N, Klitgord N, Simon C, Boxem M, Milstein S, Rosenberg J, Goldberg DS, Zhang LV, Wong SL, Franklin G, Li S, Albala JS, Lim J, Fraughton C, Llamosas E, Cevik S, Bex C, Lamesch P, Sikorski RS, Vandenhaute J, Zoghbi HY, Smolyar A, Bosak S, Sequerra R, Doucette-Stamm L, Cusick ME, Hill DE, Roth FP, Vidal M. Towards a proteome-scale map of the human protein–protein interaction network. Nature. 2005;437:1173–1178. doi: 10.1038/nature04209. [DOI] [PubMed] [Google Scholar]
- Fischer L, Chen ZA, Rappsilber J. Quantitative cross-linking/mass spectrometry using isotope-labelled cross-linkers. J Proteomics. 2013;88:120–128. doi: 10.1016/j.jprot.2013.03.005. [DOI] [PMC free article] [PubMed] [Google Scholar]
- Merkley ED, Rysavy S, Kahraman A, Hafen RP, Daggett V, Adkins JN. Distance restraints from crosslinking mass spectrometry: Mining a molecular dynamics simulation database to evaluate lysine–lysine distances. Protein Sci. 2014;23:747–759. doi: 10.1002/pro.2458. [DOI] [PMC free article] [PubMed] [Google Scholar]
- Gamper AM, Kim J, Roeder RG. The STAGA subunit ADA2b is an important regulator of human GCN5 catalysis. Mol Cell Biol. 2009;29:266–280. doi: 10.1128/MCB.00315-08. [DOI] [PMC free article] [PubMed] [Google Scholar]
- Han Y, Luo J, Ranish J, Hahn S. Architecture of the Saccharomyces cerevisiae SAGA transcription coactivator complex. EMBO J. 2014;33:2534–2546. doi: 10.15252/embj.201488638. [DOI] [PMC free article] [PubMed] [Google Scholar]
- Costanzo M, Baryshnikova A, Bellay J, Kim Y, Spear ED, Sevier CS, Ding H, Koh JL, Toufighi K, Mostafavi S, Prinz J, St Onge RP, VanderSluis B, Makhnevych T, Vizeacoumar FJ, Alizadeh S, Bahr S, Brost RL, Chen Y, Cokol M, Deshpande R, Li Z, Lin ZY, Liang W, Marback M, Paw J, San Luis BJ, Shuteriqi E, Tong AH, van Dyk N, Wallace IM, Whitney JA, Weirauch MT, Zhong G, Zhu H, Houry WA, Brudno M, Ragibizadeh S, Papp B, Pál C, Roth FP, Giaever G, Nislow C, Troyanskaya OG, Bussey H, Bader GD, Gingras AC, Morris QD, Kim PM, Kaiser CA, Myers CL, Andrews BJ, Boone C. The genetic landscape of a cell. Science. 2010;327:425–431. doi: 10.1126/science.1180823. [DOI] [PMC free article] [PubMed] [Google Scholar]
- Bradford MM. A rapid and sensitive method for the quantitation of microgram quantities of protein utilizing the principle of protein–dye binding. Anal Biochem. 1976;72:248–254. doi: 10.1016/0003-2697(76)90527-3. [DOI] [PubMed] [Google Scholar]
- Laemmli UK. Cleavage of Structural Proteins during the Assembly of the Head of Bacteriophage T4. Nature. 1970;227:680–685. doi: 10.1038/227680a0. [DOI] [PubMed] [Google Scholar]
- Burnette WN. “Western Blotting”: Electrophoretic transfer of proteins from sodium dodecyl sulfate-polyacrylamide gels to unmodified nitrocellulose and radiographic detection with antibody and radioiodinated protein A. Anal Biochem. 1981;112:195–203. doi: 10.1016/0003-2697(81)90281-5. [DOI] [PubMed] [Google Scholar]
Associated Data
This section collects any data citations, data availability statements, or supplementary materials included in this article.
Supplementary Materials
Supplementary Information
Supplementary Information Figure 1.
Supplementary Information Figure 2.
Supplementary Information Figure 3.
Supplementary Information Figure 4.
Supplementary Information Table 1.
Supplementary Information Table 2.
Supplementary Information Table 3.
Supplementary Information Table 4.