Abstract
Gas/water interfaces (such as air bubbles or foam) are detrimental to the stability of proteins, often causing aggregation. This represents a potential problem for industrial processes, for example, the production and handling of protein drugs. Proteins possess surfactant-like properties, resulting in a high affinity for gas/water interfaces. The tendency of previously buried nonpolar residues to maximize contact with the gas phase can cause significant structural distortion. Most earlier studies in this area employed spectroscopic tools that could only provide limited information. Here we use hydrogen/deuterium exchange (HDX) mass spectrometry (MS) for probing the conformational dynamics of the model protein myoglobin (Mb) in the presence of N2 bubbles. HDX/MS relies on the principle that unfolded and/or highly dynamic regions undergo faster deuteration than tightly folded segments. In bubble-free solution Mb displays EX2 behavior, reflecting the occurrence of short-lived excursions to partially unfolded conformers. A dramatically different behavior is seen in the presence of N2 bubbles; EX2 dynamics still take place, but in addition the protein shows EX1 behavior. The latter results from interconversion of the native state with conformers that are globally unfolded and long-lived. These unfolded species likely correspond to Mb that is adsorbed to the surface of gas bubbles. N2 sparging also induces aggregation. To explain the observed behavior we propose a simple model, that is, “semi-unfolded” ↔ “native” ↔ “globally unfolded” → “aggregated”. This model quantitatively reproduces the experimentally observed kinetics. To the best of our knowledge, the current study marks the first exploration of surface denaturation phenomena by HDX/MS.
Keywords: protein dynamics, protein aggregation, EX1, EX2, surface adsorption
Introduction
Under physiological conditions most globular proteins adopt a highly ordered conformation, comprising a hydrophobic core and a hydrophilic exterior.1 This native state can be destabilized by exposure to extremes of pH, high or low temperature, and denaturants such as urea.2–4 These physical and chemical agents can result in various degrees of unfolding, from semi-structured molten globules all the way to the random coil state.5–7 Non-native conformers formed in this way are often prone to aggregation.8,9
Proteins have become a valuable commodity—not only as enzymes for industrial processes but also as vaccines and therapeutic agents. Protein drugs such as monoclonal antibodies and antibody-drug conjugates have a rapidly growing market share.10,11 The formulation, processing, and packaging of these proteins may induce various degradation processes.12,13 In other words, structural changes and/or aggregation may take place even if the proteins are never exposed to any of the “classical” denaturing agents mentioned above.14–16 Especially for protein drugs these issues are of concern because degradation may affect their efficacy and immunogenicity.16 Early investigations considered shear stress experienced during pumping and stirring to be a major cause of degradation.17 Recent studies found shear effects on proteins to be negligible,13,18–20 although shear can certainly damage protein-producing cells in stirred-tank reactors.11,21,22
It has now been established that a key factor associated with the degradation of proteins during processing is the presence of gas/water interfaces in the form of bubbles or foam.14,15,23–27 Proteins exhibit a high affinity for these interfaces. Protein-induced foaming in bioreactors can lead to overflow and other problems during large-scale industrial operations.28 On the other hand, foam stabilization via protein adsorption is beneficial for many food and beverage formulations, exemplified by the frothy appearance of whisked egg-white and the foaming of beer.25,29 The texture and shelf life of aerated food products greatly depends on the capability of proteins to prevent the coalescence of gas bubbles.30 Similar considerations apply to the interaction of proteins with oil/water interfaces, a factor that is important for the stabilization of emulsions such as milk.31
The affinity of proteins for gas/water interfaces is related to the amphiphilic nature of the polypeptide chains. In a manner that is reminiscent of low molecular-weight surfactants, hydrophobic residues tend to orient themselves towards the gas phase, whereas hydrophilic moieties will remain solvated by water. The tendency of previously buried hydrophobic sites to maximize interactions with the gaseous side of the interface often forces adsorbed proteins to adopt non-native conformations14,25,28,29 that readily aggregate.14,15,23–27
Despite the considerable interest in surface denaturation phenomena, the exact nature of protein structure and dynamics at gas/water interfaces remains poorly understood. Previous work in this area employed probes such as CD, fluorescence, or FTIR spectroscopy, light and small-angle X-ray scattering, as well as surface tension measurements.14,15,25,31 Protein losses due to aggregation have been quantified by UV-Vis absorbance measurements14,27 and radioactivity assays.26
Hydrogen/deuterium exchange (HDX) mass spectrometry (MS) has emerged as a versatile tool for examining protein structural features and conformational fluctuations under a wide range of conditions.32–40 This technique relies on the fact that exposure of a protein to D2O will induce the replacement of amide backbone hydrogens with deuterium.41–43 Limited proteolysis of the labeled protein with subsequent LC separation and mass analysis of the resulting peptides allows HDX kinetics to be measured in a spatially resolved manner.
In near-neutral solution unstructured protein regions undergo rapid HDX with a “chemical” rate constant kch that is on the order of 650 min−1.43 Deuteration in folded segments proceeds much more slowly, mediated by structural fluctuations that transiently disrupt N-H....O=C hydrogen bonds while providing solvent access to amide backbone sites.44 These thermally activated dynamics cause each protein to constantly cycle through all of its Boltzmann-accessible conformations.44 Although the steady-state concentration of most excited conformers is low, the measured HDX behavior is largely governed by these conformational dynamics. The opening and closing rate constants associated with HDX-relevant structural fluctuations are referred to as kop and kcl, respectively. Two different regimes can be distinguished. Under most conditions the open states have a relatively short lifetime (kcl >> kch), such that numerous opening/closing events are required before all NH groups associated with a given structural transition are deuterated. This so-called EX2 limit is recognizable in HDX/MS as a continuous shift of the peak envelopes to higher mass, with an overall deuteration rate constant45–48
| 1 |
Alternatively, proteins may undergo cooperative dynamics where the open state is quite long-lived (kcl << kch) such that complete deuteration of the corresponding NH sites will take place during the first opening event. These “EX1” dynamics give rise to bimodal distributions where the relative intensity of the high mass component increases with time, and where45–48
| 2 |
Using met-myoglobin (Mb) as model system, the current work employs HDX/MS to examine protein structure and dynamics at the gas/water interface. Mb is an archetypical globular protein49 with a native state that comprises eight helices. Most nonpolar side chains are sequestered in a well-developed hydrophobic core. The protein binds heme in a nonpolar pocket, with Fe3+ ligation by the proximal His93. The choice of Mb for the experiments of this study is based on previous work that revealed Mb to be highly susceptible to the presence of gas/water interfaces.27 By conducting comparative experiments on Mb solutions with and without N2 sparging we obtain detailed insights into the mechanism by which gas/water interfaces promote unfolding and aggregation. We develop a kinetic model that is capable of quantitatively describing the experimentally observed interplay between aggregation and EX1/EX2 conformational fluctuations. It appears that this study marks the first use of HDX/MS as a tool for exploring surface denaturation effects.
Results and Discussion
Protein aggregation in the presence of gas bubbles
Sparging of Mb solutions with N2 bubbles results in the formation of insoluble aggregates. The assay used for examining this process involves precipitate removal by centrifugation, followed by LC/MS analysis of the supernatant. The loss of soluble protein in the presence of N2 bubbles can be approximated as an exponential decay with an apparent rate constant of kagg = 0.054 min−1. In contrast, the protein concentration in bubble-free control samples remains constant (Fig. 1).
Figure 1.
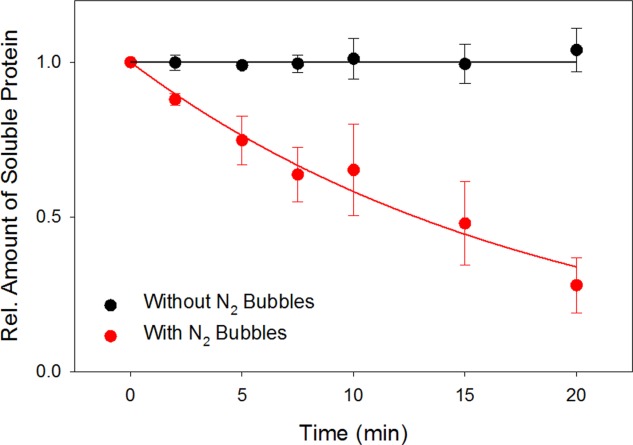
Relative amount of soluble protein in the presence and absence of N2 bubbles, as monitored by ESI-MS signal intensity measurements. Protein loss in the presence of bubbles is attributed to aggregation. The red curve is an exponential fit with an apparent rate constant of 0.054 min−1.
The occurrence of Mb aggregation under the conditions of our experiments is consistent with earlier observations on other proteins.15,23–27 In particular, it has been noted14 that sparging is characterized by a nascent interface area that continuously renews itself. These conditions are much more effective in causing aggregation than the “static” surface of regular protein samples.14 A likely explanation for this difference is that the surface of regular samples is decorated with a metastable thin film of adsorbed protein. This film prevents bulk solution proteins from coming into direct contact with the air/water interface. Sparging, on the other hand, continuously produces bare air/water interface that will readily adsorb proteins. Bubbles rise until they burst, leaving previously adsorbed proteins in non-native conformations that are prone to aggregation. Alternatively, aggregation may begin already while proteins are still in contact with the bubble surface.
Intact protein HDX/MS
Mb conformational dynamics in the absence and in the presence of N2 bubbles were probed using HDX/MS. As a first step the Mb behavior was monitored at the intact protein level. In agreement with previous reports,40,50 bubble-free control samples display EX2 kinetics with mass distributions that gradually shift to higher m/z [Fig. 2(A)]. A drastically different behavior was observed in the presence of N2 bubbles, with spectra that are bimodal for t > 2 min [Fig. 2(B)]. The decreasing relative intensity of the low mass component and the increasing intensity of the high mass component represent the hallmark of EX1 exchange.45,46 In addition, a gradual shift of the low mass component is apparent in Figure 2(B) which reveals that the protein also undergoes EX2 deuteration. The spectra in Figure 2(B) are normalized such that each time point has the same integrated area. This representation is helpful for recognizing the occurrence of combined EX1/EX2 dynamics45 in the sparged samples, but it masks the ongoing loss of soluble protein due to aggregation (as discussed above, Fig. 1). A more realistic view of the protein behavior is provided in Figure 2(C), where the HDX mass spectra of the sparged samples are displayed using actual signal intensities such that aggregation effects become easily recognizable.
Figure 2.
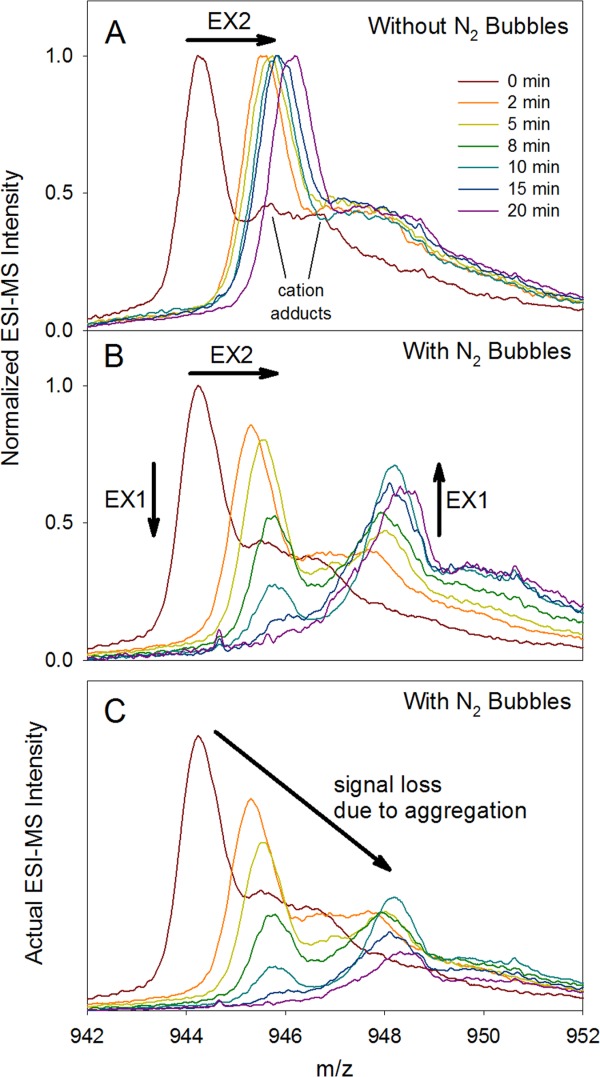
Mb mass spectra recorded at different HDX time points in the absence (A) and in the presence (B), (C) of N2 bubbles. The data shown here correspond to the 18+ charge state. Time-dependent shifts in peak maxima (EX2 behavior) are highlighted in panels A, B using arrows. In addition, for panel B time-dependent changes in the relative intensity of high mass vs. low mass component (EX1 behavior) are emphasized. The spectra in (B) were normalized such that each time point represents the same integrated intensity. (C) The same data as in panel B, but with actual intensities that reflect the time-dependent decrease in overall signal due to aggregation. Unresolved cation adducts are highlighted for the t = 0 spectrum in panel A.
By tracking the low mass peak maxima in Figure 2 it is found that the EX2 kinetics without and with bubble sparging are quite similar. Both EX2 deuteration profiles approach a maximum level around 55%, with kHDXEX2 values of 0.79 min−1 and 0.56 min−1, respectively [Fig. 3(A)]. For EX1 analyses one has to determine the signal intensities associated with the high mass and the low mass components, that is, Ihigh and Ilow. The kinetics can then be determined by using the relationship51
| 3 |
Figure 3.
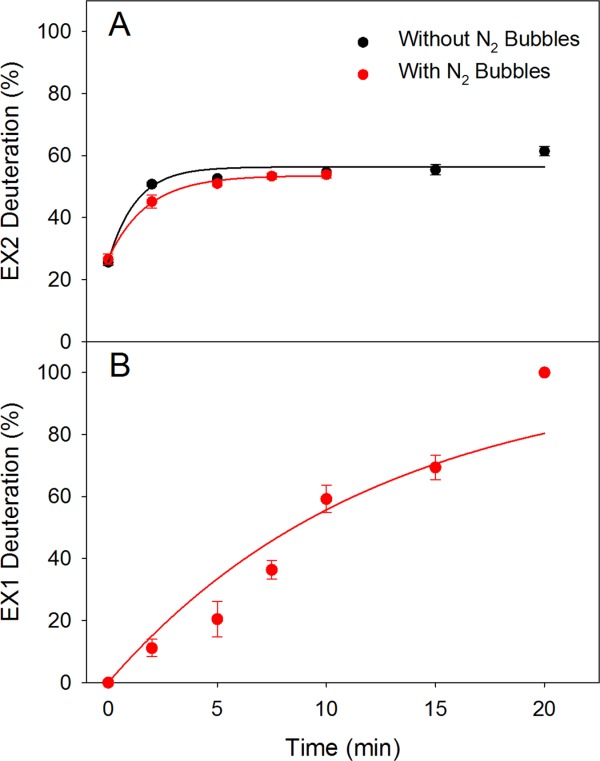
Intact Mb HDX profiles extracted from the data of Figure 2. (A) EX2 kinetics in the absence and in the presence of N2 bubbles. Curves are exponential fits with kHDXEX2 = 0.79 min−1 and 0.56 min−1, respectively. The “red” profile shows fewer data points because the EX2 component becomes indiscernible for t > 10 min in the presence of N2 bubbles. (B) EX1 kinetics observed in the presence of bubbles. The exponential fit has kHDXEX1 = 0.084 min−1.
Figure 2 reveals the occurrence of peak tailing due to cation adduction.52 This type of artifact is common in intact protein HDX/MS.53 Cation adduction is observed regardless of experimental conditions [see for example Fig. 2(A)]. Overlap of adduct signals with the high mass EX1 component renders the data analysis somewhat difficult. The EX1 data of Figure 2(B) were therefore analyzed in a semi-quantitative fashion by assuming that both components can be described using the peak shape of the t = 0 profiles, subject to the appropriate mass shifts. On the basis of Eq. 3, these data were then converted to an EX1 profile [Fig. 3(B)]. These data can be described by an exponential curve with kHDXEX1 = 0.084 min−1. The scatter in the experimental data points is attributed to the challenges outlined above.
Summarizing the intact protein data of Figures 3 it can be stated that the exposure of Mb to N2 bubbles results in a combination of EX1 and EX2 conformational dynamics, in conjunction with aggregation. Without sparging only EX2 behavior is observed.
Proteolytic digestion HDX/MS
For gaining additional insights into the Mb behavior in the presence of N2 bubbles we analyzed the HDX/MS behavior of the protein at the peptide level. For short peptides it is difficult to differentiate between EX1 and EX2 behavior. Our attention was therefore focused on relatively large segments that comprised 15 to 35 residues. In the presence of N2 bubbles all of these peptides display bimodal mass distributions, as exemplified in Figure 4. This finding implies the EX1 structural dynamics correspond to global opening/closing transitions that affect the entire Mb structure, not just individual parts of the protein. Gaussian decomposition allows a determination of EX1 kinetic profiles on the basis of Eq. 3. The resulting kinetic plots confirm that the EX1 dynamics for all peptides are very similar, as would be expected for global conformational fluctuations [Fig. 5(A)]. Global analysis of this data set results in kHDXEX1 = 0.089 min−1, close to the value obtained from the intact protein data of Figure 3B.
Figure 4.
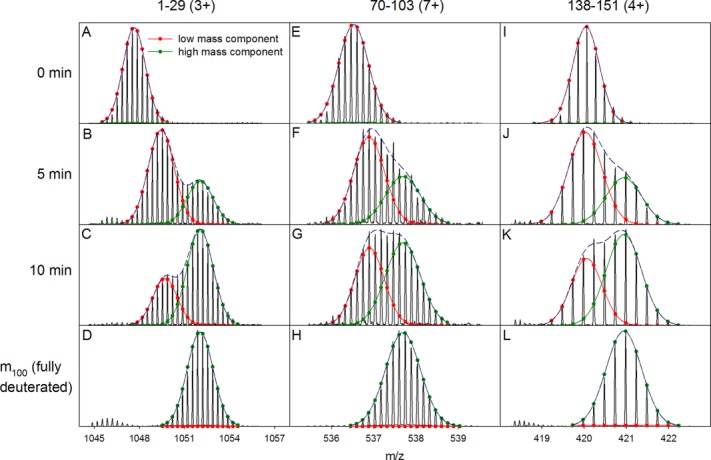
HDX mass spectra of three representative Mb peptides recorded at different time points in the presence of N2 bubbles. EX1/EX2 kinetics were analyzed using two-component Gaussian decompositions. The analysis was performed using Microsoft Excel Solver for global fitting that required the peak position and fwhm to be the same for the high mass component of each peptide for all time points.
Figure 5.
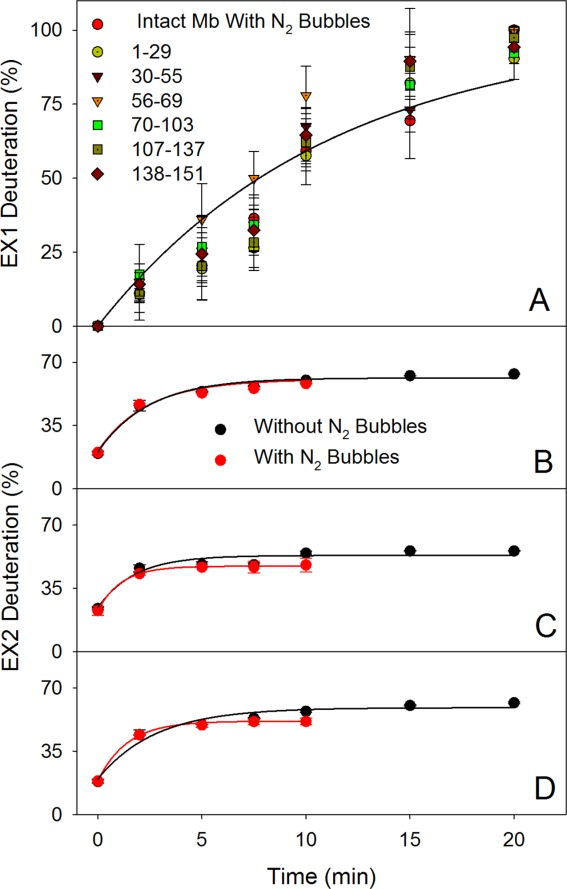
(A) EX1 kinetics of Mb peptic fragments in the presence of N2 bubbles. The solid line represents a global fit to the combined data, with kHDXEX1 = 0.089 min−1. Intact protein data are included as well. Panels B–D show a comparison of EX2 kinetic profiles recorded in the absence and in the presence of N2 bubbles. (B) Residues 1–29, kHDXEX2 = 0.41 and 0.42 min−1; (C) residues 70–103, kHDXEX2 = 0.57 and 0.88 min−1; (D) residues 138–151, kHDXEX2 = 0.36 and 0.71 min−1.
By tracking the maxima of the low mass Gaussian component for each peptide it is possible to monitor the EX2 kinetics of the protein. Data for three representative segments are depicted in Figure 5(B–D) (residues 1–29, 70–103, and 138–151). The EX2 kinetics for all three peptides are well described by kHDXEX2 values on the order of 0.5 min−1, both in the presence and in the absence of N2 sparging (see caption of Fig. 5 for details).
Mb at the gas/water interface: a simple kinetic model
The data presented in the preceding sections demonstrate that Mb in the presence of N2 bubbles undergoes both EX2 and EX1 fluctuations, as well as aggregation. We will now devise a model that is capable of describing these processes in a quantitative fashion. It is not our aim to provide an atomistic framework, rather we strive to come up with the simplest possible description of the Mb behavior.
In bubble-free solution ∼55% of backbone amides are involved in rapid sub-global fluctuations that give rise to EX2 kinetics [Fig. 3(A)]. Earlier work has revealed that the corresponding sites are located in the N-terminal region of helix A, as well as helices B, C, D, and the C-terminal half of helix H.40 We make the simplifying assumption that all of these sites participate in a single type of opening/closing transition, corresponding to “foldon” fluctuations44 between a semi-unfolded species and the native state. These dynamics may be described using the notation OC ↔ CC, where the first letter designates the status (“O” open, or “C” closed) of the 55% of amides that participates in the EX2 dynamics. The second letter signifies the residual 45% that do not participate in the EX2 dynamics.
Upon exposure to gas bubbles the EX2 kinetics do not change very much [Fig. 3(A)]. However, N2 sparging gives rise to additional EX1 conformational transitions that expose all amides to the solvent [Fig. 5(A)], implying the involvement of surface-adsorbed conformers that are globally unfolded (“OO”). Inclusion of this species extends the model to OC ↔ CC ↔ OO. As a final step, aggregation has to be considered. The lack of protein loss in bubble-free solution suggests that neither OC nor CC are particularly susceptible to aggregation. This leaves OO as the most likely aggregation-prone species. OO can either refold to CC, or it can form aggregates. This kinetic competition can be incorporated by modifying the model to
OC ↔ CC ↔ OO → aggregated [see Fig. 6(A) for a complete description that includes rate constants]. A cartoon representation of the four kinetic species is provided in Figure 6(B), emphasizing their different degrees of “openness”, as well as the interaction of nonpolar residues (orange) with the gas/water interface14,15,23–29 in the OO state.
Figure 6.
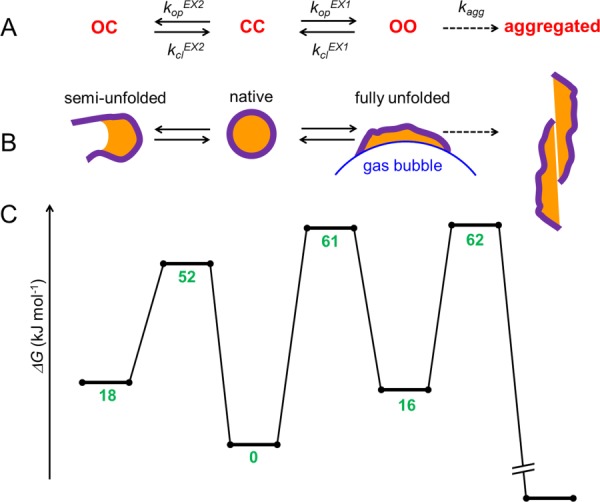
Kinetic model of the protein dynamics in the presence of N2 bubbles. Backbone amides are conceptually divided into two groups, each of which can either be open (“O”) or closed (“C”). (A) The CC native state undergoes EX2 fluctuations to the semi-unfolded conformer OC. Alternatively, CC can undergo EX1 fluctuations to the fully unfolded species OO which is adsorbed to the gas/water interface. The latter can either refold or aggregate. (B) The same model as in panel A, with cartoon representations for each of the four species. Orange color represents hydrophobic residues. (C) Free energy profile of the protein. Numbers indicate ΔG (in kJ mol−1) relative to the CC native state.
The appropriateness of the model can be scrutinized by testing whether it is capable of reproducing the experimental HDX and aggregation kinetics. We previously developed a procedure for simulating deuteration processes that are associated with the interconversion of different conformers.45 That method iteratively tracks the behavior of a population of bit strings (proteins), where each position (backbone amide site) is occupied by either 0 (hydrogen) or 1 (deuterium). Opening/closing dynamics of user-defined protein regions take place with probabilities governed by the corresponding kop and kcl values. Open sites undergo 0 → 1 conversion (deuteration) with a probability that depends on kch. The mass shift distribution of the population is analyzed at selected time points by adding the number of 1s in each of the proteins. It was already demonstrated that a OC ↔ CC ↔ OO model is capable of describing the simultaneous occurrence of EX1 and EX2 kinetics (see Fig. 5 in ref.45). For the current work we extend this framework by incorporating an aggregation step, as envisioned in Figure 6. This is achieved by implementing a reaction path that removes OO with a probability W that is given by
| 4 |
where kagg is the aggregation rate constant and Δτ is the iteration time step.45
Given the minimalist nature of the model, a number of simplifications are required. We assume that chemical exchange proceeds with kch = 650 min−1 at all sites, representing the amino acid-averaged value at neutral pH.43 For EX2 deuteration (kcl >> kch) it is assumed that kclEX2 = 6500 min−1. Conversely, for EX1 kinetics (kcl << kch) we use kclEX1 = 65 min−1. The experimentally measured kHDXEX2 = 0.56 min−1 [Fig. 3(A)] then corresponds to kopEX2 = 5.6 min−1, as dictated by Eq. 1. For a “pure” EX1 scenario the fitted rate constant of Figure 3B would suggest that kopEX1 = kHDXEX1 = 0.084 min−1 [Eq. 2]. However, the kinetic competition between kclEX1 and kagg renders Eq. 2 inadequate for the reaction scheme of Figure 6(A). To address this point we empirically settled on a slightly higher value of kopEX1 = 0.12 min−1. Aggregation of OO was approximated as a first-order process with kagg = 44 min−1. Figure 7 demonstrates that this choice of parameters results in excellent agreement between the experimental data (red) and the simulated kinetics (blue).
Figure 7.
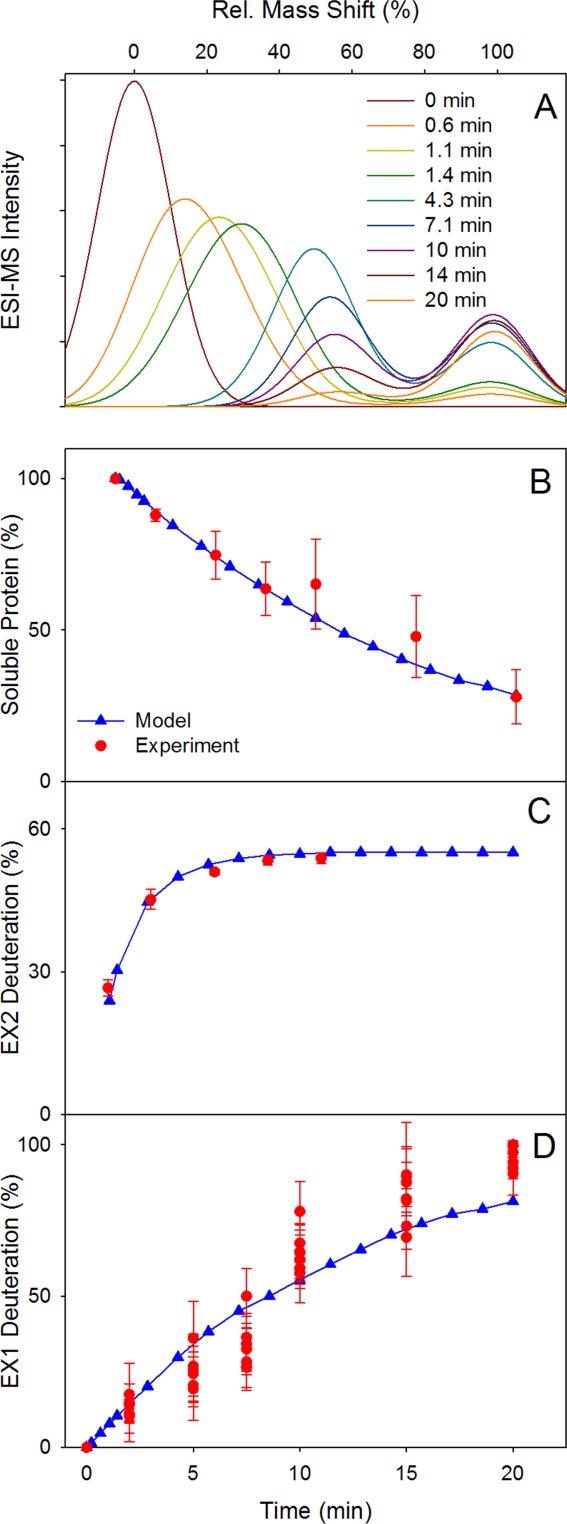
Simulation results, using the model of Figure 6 for describing the HDX and aggregation kinetics. (A) Intact protein mass shift distributions, (B) aggregation kinetics, (C) EX2 kinetics, (D) EX1 kinetics. Simulation results in panels B–D are displayed in blue, whereas experimental data (from Figs. 1, 3A, 5A) are shown in red. Simulations were conducted using the method of Ref.45 for 5000 proteins with rate constants as defined in the text.
The agreement between modeled and experimental kinetics (Fig. 7) suggests that the framework of Figure 6 provides a reasonable approximation of the protein dynamics in the presence of N2 bubbles. We do not claim that this model is unique; alternative scenarios such as CC ↔ OC ↔ OO → aggregated might fit the data equally well. However, from our experiments there is no evidence that OC is an obligatory intermediate for the formation of OO. It was therefore decided to put forward the model of Figure 6, which does not involve a direct OC ↔ OO transition.
Free energy landscape of Mb at the gas/water interface
Having determined the rate constants associated with the model, one can proceed to outline the energy landscape of the protein in the presence of N2 bubbles [summarized in Fig. 6(C)]. The free energy of OC and OO relative to the CC ground state is given by44,45
| 5 |
yielding values of 18 and 16 kJ mol−1, respectively. At first sight, it might seem surprising that OC and OO possess almost the same free energy, considering that they represent very different degrees of unfolding. This apparent contradiction is resolved when considering that the globally unfolded conformer OO is stabilized by adsorption to the gas/water interface.
For estimating the height of the activation barriers (ΔG#) that separate the protein conformers we use the Kramers equation54–58
| 6 |
with a pre-exponential factor of C ≈ 6 × 10⁹ min−1.59 The resulting activation barrier heights for OC ← CC and CC → OO are 52 kJ mol−1 and 61 kJ mol−1, respectively. These numbers suggest that the transition state for global unfolding is much more unfavorable than that leading to the semi-unfolded state. Hence, while OO is strongly stabilized by adsorption to the gas/water interface, this stabilization is not fully developed in the CC → OO transition state.
By switching kop to kagg one can use eq. 6 to estimate the kinetic barrier for aggregation of OO. This approach yields an activation barrier height of 46 kJ mol−1, corresponding to a transition state energy that is (16 + 46) kJ mol−1 = 62 kJ mol−1 above CC. Aggregation can be considered to be quasi-irreversible,60 implying that the free energy of aggregated Mb in our model is far below that of the metastable CC state [Fig. 6(C)].
Conclusions
The experiments and kinetic simulations of this work provide insights into the conformational dynamics of a model protein (Mb) under conditions where interactions with gas/water interfaces are promoted by N2 sparging. Our results highlight the destabilizing effects of gas bubbles, as well as the propensity of the protein to aggregate under these conditions. Analysis of the HDX/MS data strongly suggests the involvement of globally unfolded conformers that are adsorbed to the surface of gas bubbles via interactions with previously buried nonpolar residues. This OO species represents a kinetic branching point from which the protein can either aggregate, or refold to the native state.
The kinetic framework of Figure 6 describes the experimental data well (Fig. 7), but readers are reminded of the minimalist nature of our model. Many aspects are not considered in detail. For example, it seems possible that bubble-adsorbed OO is quite stable, and that the kinetic competition between refolding and aggregation only commences after this conformer is released into solution upon bubble bursting. Also, modeling aggregation as a first-order process with fixed rate constant glosses over many of the complexities associated with this process. Similarly, describing EX2 dynamics via a single semi-unfolded state certainly represents an oversimplification.40,44 Despite these limitations, we feel that the model of Figure 6 provides a useful approximation of the protein dynamics in the presence of gas bubbles.
HDX measurements clearly represent an interesting approach for exploring the properties of proteins at interfaces.61 This technology can provide insights that go beyond those obtainable from commonly used bulk spectroscopic methods.14,15,25–27,31 It is hoped that the approach introduced in this study will be useful for exploring protein dynamics and aggregation in industrial processes, where bubble-related degradation phenomena are commonly encountered.14,15,23–27
Methods
Materials
Equine skeletal muscle Mb was purchased from Sigma (St. Louis, MO). HCl, Na2HPO4 and NaH2PO4 were obtained from Caledon (Georgetown, ON, Canada). D2O was procured from Aldrich (St. Louis, MO). LC-MS grade H2O was purchased from Optima (Fair Lawn, NJ). All protein solutions were prepared in 50 mM phosphate buffer. pH values were measured using a Fisher (Waltham, MA) AB15 pH meter. All experiments were carried out at a pH meter reading of 7.1, without correction for isotope effects.
Gas/water interface exposure and HDX
200 μL aliquots of 5 μM Mb in 90% D2O were placed in Eppendorf tubes. N2 was bubbled through these solutions at 5 L h−1 using a syringe needle with an inner diameter of 0.8 mm. This procedure was carried out at room temperature (23 ± 1°C). After various deuteration time periods ranging from 1 to 20 minutes the gas flow was stopped. Insoluble aggregates formed during this treatment were removed by centrifugation at 10,000 rpm for 30 s. HDX was quenched by adding HCl to the supernatant, resulting in a pH meter reading of 2.4. Subsequently, samples were flash frozen in liquid nitrogen until further analysis. Times reported in the text above refer to the bubble-exposure period, not including of the ∼60 s required for centrifugation, centrifuge deceleration, and sample handling prior to freezing. Measurements for quantifying protein loss due to aggregation were conducted using non-deuterated buffer solutions. Control samples for all measurements were prepared exactly as described above, but without N2 bubbling.
Mass spectrometry
Frozen deuterated samples were rapidly thawed to ∼0°C. Intact protein HDX/MS employed a reversed-phase column for desalting (BEH C4, 1.7 µm, 2.1 × 50 mm, Waters, Milford, MA) with a 10 min water/acetonitrile gradient at 200 µL min−1 in the presence of 0.1% formic acid. The sample loop had a 20 µL volume and the amount of Mb per injection was 100 pmol. The column, injector and solvent lines were kept in ice for maintaining a temperature close to 0°C to minimize H/D back exchange. The column outlet was connected to a Waters Synapt HDMS quadrupole time-of-flight mass spectrometer. Intact protein analyses focused on the 18+ charge state which exhibited the highest S/N ratio.
Peptide-level deuteration measurements were conducted using a nanoACQUITY UPLC with HDX technology (Waters)62 Online digestion was performed using a 2.1 mm × 30 mm POROS pepsin column (Life Technologies/Applied Biosystems, Carlsbad, CA) at 15°C. A 20 min water/acetonitrile (0.1% formic acid) gradient was used for desalting and peptide separation at 0°C. Peptide mass analysis was performed on a Waters Synapt G2 mass spectrometer. The identity of each peptide was confirmed by tandem MS on non-deuterated samples based on the known Mb sequence.49 Peptide mass spectra were recorded with an electrospray capillary voltage of +2.8 kV, 30 V cone voltage and a desolvation temperature of 250°C. Mass calibration was performed using 2 µg µL−1 NaI in 50:50 water: isopropanol at a capillary voltage of 1.2 kV. Deuteration percentages were calculated as (m − m0)/(m100 − m0). Zero-time-point controls (m0) were prepared by exposing the protein to 90% D2O buffer under quench conditions. Fully exchanged control samples (m100) were prepared by incubating Mb in 90% D2O at pD 2.4/37°C for 12 h. All experiments were carried out in triplicate. Error bars represent standard deviations.
Acknowledgments
The authors thank Modupeola A. Sowole for experimental assistance during the early stages of this project.
Glossary
- CD
circular dichroism
- FTIR
Fourier transform infrared
- HDX
hydrogen deuterium exchange
- LC
liquid chromatography
- Mb
myoglobin
- MS
mass spectrometry
References
- Farber PJ, Mittermaier A. Side chain burial and hydrophobic core packing in protein folding transition states. Protein Sci. 2008;17:644–651. doi: 10.1110/ps.073105408. [DOI] [PMC free article] [PubMed] [Google Scholar]
- Lim WK, Rosgen J, Englander SW. Urea, but not guanidinium, destabilizes proteins by forming hydrogen bonds to the peptide group. Proc Natl Acad Sci USA. 2009;106:2595–2600. doi: 10.1073/pnas.0812588106. [DOI] [PMC free article] [PubMed] [Google Scholar]
- England JL, Pande VS, Haran G. Chemical denaturants inhibit the onset of dewetting. J Am Chem Soc. 2008;130:11854–11855. doi: 10.1021/ja803972g. [DOI] [PMC free article] [PubMed] [Google Scholar]
- Zangi R, Zhou RH, Berne BJ. Urea's action on hydrophobic interactions. J Am Chem Soc. 2009;131:1535–1541. doi: 10.1021/ja807887g. [DOI] [PubMed] [Google Scholar]
- Lindorff-Larsen K, Trbovic N, Maragakis P, Piana S, Shaw DE. Structure and dynamics of an unfolded protein examined by molecular dynamics simulation. J Am Chem Soc. 2012;134:3787–3791. doi: 10.1021/ja209931w. [DOI] [PubMed] [Google Scholar]
- Jha AK, Colubri A, Freed KF, Sosnick TR. Statistical coil model of the unfolded state: resolving the reconciliation problem. Proc Natl Acad Sci USA. 2005;102:13099–13104. doi: 10.1073/pnas.0506078102. [DOI] [PMC free article] [PubMed] [Google Scholar]
- Curnow P, Booth PJ. Combined kinetic and thermodynamic analysis of α-helical membrane protein unfolding. Proc Natl Acad Sci USA. 2007;104:18970–18975. doi: 10.1073/pnas.0705067104. [DOI] [PMC free article] [PubMed] [Google Scholar]
- Hartl FU, Hayer-Hartl M. Converging concepts of protein folding in vitro and in vivo. Nat Struct Mol Biol. 2009;16:574–581. doi: 10.1038/nsmb.1591. [DOI] [PubMed] [Google Scholar]
- Cohen SIA, Vendruscolo M, Dobson CM, Knowles TPJ. From macroscopic measurements to microscopic mechanisms of protein aggregation. J Mol Biol. 2012;421:160–171. doi: 10.1016/j.jmb.2012.02.031. [DOI] [PubMed] [Google Scholar]
- Kimchi-Sarfaty C, Schiller T, Hamasaki-Katagiri N, Khan MA, Yanover C, Sauna ZE. Building better drugs: developing and regulating engineered therapeutic proteins. Trends Pharmacol Sci. 2013;34:534–548. doi: 10.1016/j.tips.2013.08.005. [DOI] [PubMed] [Google Scholar]
- Chu L, Robinson DK. Industrial choices for protein production by large-scale cell culture. Curr Opin Biotechnol. 2001;12:180–187. doi: 10.1016/s0958-1669(00)00197-x. [DOI] [PubMed] [Google Scholar]
- Bye JW, Platts L, Falconer RJ. Biopharmaceutical liquid formulation: a review of the science of protein stability and solubility in aqueous environments. Biotechnol Lett. 2014;36:869–875. doi: 10.1007/s10529-013-1445-6. [DOI] [PubMed] [Google Scholar]
- Thomas CR, Geer D. Effects of shear on proteins in solution. Biotechnol Lett. 2011;33:443–456. doi: 10.1007/s10529-010-0469-4. [DOI] [PubMed] [Google Scholar]
- Wiesbauer J, Prassl R, Nidetzky B. Renewal of the air-water interface as a critical system parameter of protein stability: aggregation of the human growth hormone and its prevention by surface-active compounds. Langmuir. 2013;29:15240–15250. doi: 10.1021/la4028223. [DOI] [PubMed] [Google Scholar]
- Rudiuk S, Cohen-Tannoudji L, Huille S, Tribet C. Importance of the dynamics of adsorption and of a transient interfacial stress on the formation of aggregates of igg antibodies. Soft Matter. 2012;8:2651–2661. [Google Scholar]
- Philo JS, Arakawa T. Mechanisms of protein aggregation. Curr Pharm Biotechnol. 2009;10:348–351. doi: 10.2174/138920109788488932. [DOI] [PubMed] [Google Scholar]
- Tirrell M, Middleman S. Shear modification of enzyme kinetics. Biotechnol Bioeng. 1975;17:299–303. [Google Scholar]
- Thomas CR, Nienow AW, Dunnill P. Action of shear on enzymes: studies with alcohol dehydrogenase. Biotechnol Bioeng. 1979;21:2263–2278. doi: 10.1002/bit.260211208. [DOI] [PubMed] [Google Scholar]
- Jaspe J, Hagen SJ. Do protein molecules unfold in a simple shear flow? Biophys J. 2006;91:3415–3424. doi: 10.1529/biophysj.106.089367. [DOI] [PMC free article] [PubMed] [Google Scholar]
- Bee JS, Stevenson JL, Mehta B, Svitel J, Pollastrini J, Platz R, Freund E, Carpenter JF, Randolph TW. Response of a concentrated monoclonal antibody formulation to high shear. Biotech Bioeng. 2009;103:936–943. doi: 10.1002/bit.22336. [DOI] [PMC free article] [PubMed] [Google Scholar]
- Taticek RA, Lee CWT, Shuler ML. Large-scale insect and plant cell culture. Curr Opin Biotechnol. 1994;5:165–174. doi: 10.1016/s0958-1669(05)80031-x. [DOI] [PubMed] [Google Scholar]
- Joshi JB, Elias CB, Patole MS. Role of hydrodynamic shear in the cultivation of animal, plant and microbial cells. Chem Eng J. 1996;62:121–141. [Google Scholar]
- Graham DE, Phillips MC. Proteins at liquid interfaces .1. Kinetics of adsorption and surface denaturation. J Colloid Interface Sci. 1979;70:403–414. [Google Scholar]
- Donaldson TL, Boonstra EF, Hammond JM. Kinetics of protein denaturation at gas-liquid interfaces. J Colloid Interface Sci. 1980;74:441–450. [Google Scholar]
- Clarkson JR, Cui ZF, Darton RC, Clarkson JR. Protein denaturation in foam—I. Mechanism study. J Colloid Interface Sci. 1999;215:323–332. doi: 10.1006/jcis.1999.6255. [DOI] [PubMed] [Google Scholar]
- Cornec M, Cho D, Narsimhan G. Adsorption dynamics of alpha-lactalbumin and beta-lactoglobulin at air-water interfaces. J Colloid Interface Sci. 1999;214:129–142. doi: 10.1006/jcis.1999.6230. [DOI] [PubMed] [Google Scholar]
- Hedges JB, Vahidi S, Yue X, Konermann L. Effects of ammonium bicarbonate on the electrospray mass spectra of proteins: evidence for bubble-induced unfolding. Anal Chem. 2013;85:6469–6476. doi: 10.1021/ac401020s. [DOI] [PubMed] [Google Scholar]
- Prins A, van't Riet K. Proteins and surface effects in fermentation: foam, antifoam and mass transfer. Trends Biotechnol. 1987;5:296–301. [Google Scholar]
- Wilde PJ. Interfaces: their role in foam and emulsion behaviour. Curr Opin Colloid Interface Sci. 2000;5:176–181. [Google Scholar]
- Narsimhan G. Analysis of creaming and formation of foam layer in aerated liquid. J Colloid Interface Sci. 2010;345:566–572. doi: 10.1016/j.jcis.2010.02.003. [DOI] [PubMed] [Google Scholar]
- Zhai JL, Day L, Aguilar MI, Wooster TJ. Protein folding at emulsion oil/water interfaces. Curr Opin Colloid Interface Sci. 2013;18:257–271. [Google Scholar]
- Marciano DP, Dharmarajan V, Griffin PR. Hdx-ms guided drug discovery: small molecules and biopharmaceuticals. Curr Opin Struct Biol. 2014:105–111. doi: 10.1016/j.sbi.2014.08.007. [DOI] [PMC free article] [PubMed] [Google Scholar]
- Kaltashov IA, Bobst CE, Abzalimov RR. Mass spectrometry-based methods to study protein architecture and dynamics. Protein Sci. 2013;22:530–544. doi: 10.1002/pro.2238. [DOI] [PMC free article] [PubMed] [Google Scholar]
- Percy AJ, Rey M, Burns KM, Schriemer DC. Probing protein interactions with hydrogen/deuterium exchange and mass spectrometry-a review. Anal Chim Acta. 2012;721:7–21. doi: 10.1016/j.aca.2012.01.037. [DOI] [PubMed] [Google Scholar]
- Iacob RE, Engen JR. Hydrogen exchange mass spectrometry: are we out of the quicksand? J Am Soc Mass Spectrom. 2012;23:1003–1010. doi: 10.1007/s13361-012-0377-z. [DOI] [PMC free article] [PubMed] [Google Scholar]
- Englander SW. Hydrogen exchange and mass spectrometry: a historical perspective. J Am Soc Mass Spectrom. 2006;17:1481–1489. doi: 10.1016/j.jasms.2006.06.006. [DOI] [PMC free article] [PubMed] [Google Scholar]
- Rand KD, Zehl M, Jensen ON, Jørgensen TJD. Protein hydrogen exchange measured at single-residue resolution by electron transfer dissociation mass spectrometry. Anal Chem. 2009;81:5577–5584. doi: 10.1021/ac9008447. [DOI] [PubMed] [Google Scholar]
- Rob T, Liuni P, Gill PK, Zhu SL, Balachandran N, Berti PJ, Wilson DJ. Measuring dynamics in weakly structured regions of proteins using microfluidics-enabled subsecond h/d exchange mass spectrometry. Anal Chem. 2012;84:3771–3779. doi: 10.1021/ac300365u. [DOI] [PubMed] [Google Scholar]
- Sperry JB, Smith CL, Caparon MG, Ellenberger T, Gross ML. Mapping the protein–protein interface between a toxin and its cognate antitoxin from the bacterial pathogen streptococcus pyogenes. Biochemistry. 2011;50:4038–4045. doi: 10.1021/bi200244k. [DOI] [PMC free article] [PubMed] [Google Scholar]
- Sowole MA, Konermann L. Effects of protein-ligand interactions on hydrogen/deuterium exchange kinetics: canonical and non-canonical scenarios. Anal Chem. 2014;86:6715–6722. doi: 10.1021/ac501849n. [DOI] [PubMed] [Google Scholar]
- Baldwin RL. Early days of protein hydrogen exchange: 1954–1972. Proteins. 2011;79:2021–2026. doi: 10.1002/prot.23039. [DOI] [PubMed] [Google Scholar]
- Jaswal SS, Miranker AD. Scope and utility of hydrogen exchange as a tool for mapping landscapes. Protein Sci. 2007;16:2378–2390. doi: 10.1110/ps.072994207. [DOI] [PMC free article] [PubMed] [Google Scholar]
- Bai Y, Milne JS, Mayne L, Englander SW. Primary structure effects on peptide group hydrogen exchange. Proteins: struct, Funct, Genet. 1993;17:75–86. doi: 10.1002/prot.340170110. [DOI] [PMC free article] [PubMed] [Google Scholar]
- Englander SW, Mayne L, Krishna MMG. Protein folding and misfolding: mechanism and principles. Quart Rev Biophys. 2007;40:287–326. doi: 10.1017/S0033583508004654. [DOI] [PMC free article] [PubMed] [Google Scholar]
- Konermann L, Tong X, Pan Y. Protein structure and dynamics studied by mass spectrometry: H/d exchange, hydroxyl radical labeling, and related approaches. J Mass Spectrom. 2008;43:1021–1036. doi: 10.1002/jms.1435. [DOI] [PubMed] [Google Scholar]
- Miranker A, Robinson CV, Radford SE, Dobson CM. Investigation of protein folding by mass spectrometry. FASEB J. 1996;10:93–101. doi: 10.1096/fasebj.10.1.8566553. [DOI] [PubMed] [Google Scholar]
- Weis DD, Wales TE, Engen JR, Hotchko M, Ten Eyck LF. Identification and characterization of ex1 kinetics in h/d exchange mass spectrometry by peak width analysis. J Am Soc Mass Spectrom. 2006;17:1498–1509. doi: 10.1016/j.jasms.2006.05.014. [DOI] [PubMed] [Google Scholar]
- Hui X, Hoerner JK, Eyles SJ, Dobo A, Voigtman E, Mel'Cuk AI, Kaltashov IA. Mapping protein energy landscapes with amide hydrogen exchange and mass spectrometry: I. A generalized model for a two-state protein and comparison with experiment. Protein Sci. 2005;14:543–557. doi: 10.1110/ps.041001705. [DOI] [PMC free article] [PubMed] [Google Scholar]
- Maurus R, Overall CM, Bogumil R, Luo Y, Mauk AG, Smith M, Brayer GD. A myoglobin variant with a polar substitution in a conserved hydrophobic cluster in the heme binding pocket. Biochim Biophys Acta. 1997;1341:1–13. doi: 10.1016/s0167-4838(97)00064-2. [DOI] [PubMed] [Google Scholar]
- Johnson RS, Walsh KA. Mass spectrometric measurement of protein amide hydrogen exchange rates of apo- and holo-myoglobin. Protein Sci. 1994;3:2411–2418. doi: 10.1002/pro.5560031224. [DOI] [PMC free article] [PubMed] [Google Scholar]
- Maier CS, Schimerlik MI, Deinzer ML. Thermal denaturation of escherichia coli thioredoxin studied by hydrogen/deuterium exchange and electrospray ionization mass spectrometry: monitoring a two-state protein unfolding transition. Biochemistry. 1999;38:1136–1143. doi: 10.1021/bi981938w. [DOI] [PubMed] [Google Scholar]
- Verkerk UH, Kebarle P. Ion-ion and ion-molecule reactions at the surface of proteins produced by nanospray. Information on the number of acidic residues and control of the number of ionized acidic and basic residues. J Am Soc Mass Spectrom. 2005;16:1325–1341. doi: 10.1016/j.jasms.2005.03.018. [DOI] [PubMed] [Google Scholar]
- Tsui V, Garcia C, Cavagnero S, Siuzdak G, Dyson HJ, Wright PE. Quench-flow experiments combined with mass spectrometry show apomyoglobin folds through an obligatory intermediate. Protein Sci. 1999;8:45–49. doi: 10.1110/ps.8.1.45. [DOI] [PMC free article] [PubMed] [Google Scholar]
- Kramers HA. Brownian motion in a field of force and the diffusion model of chemical reactions. Physica. 1940;7:284–304. [Google Scholar]
- Hanggi P, Talkner P, Borkovec M. Reaction-rate theory: fifty years after kramers. Rev Mod Phys. 1990;62:251–342. [Google Scholar]
- Chung HS, Eaton WA. Single-molecule fluorescence probes dynamics of barrier crossing. Nature. 2013;502:685–688. doi: 10.1038/nature12649. [DOI] [PMC free article] [PubMed] [Google Scholar]
- Klimov DK, Thirumalai D. Viscosity dependence of the folding rates of proteins. Phys Rev Lett. 1997;79:317–320. [Google Scholar]
- Jacob M, Geeves M, Holtermann G, Schmid FX. Diffusional barrier crossing in a two-state protein folding reaction. Nat Struct Biol. 1999;6:923–926. doi: 10.1038/13289. [DOI] [PubMed] [Google Scholar]
- Bieri O, Wirz J, Hellrung B, Schutkowski M, Drewello M, Kiefhaber T. The speed limit for protein folding measured by triplet-triplet energy transfer. Proc Natl Acad Sci USA. 1999;96:9597–9601. doi: 10.1073/pnas.96.17.9597. [DOI] [PMC free article] [PubMed] [Google Scholar]
- Vendruscolo M. Proteome folding and aggregation. Curr Opin Struct Biol. 2012;22:138–143. doi: 10.1016/j.sbi.2012.01.005. [DOI] [PubMed] [Google Scholar]
- Wang AL, Vo T, V, Le Fitzkee NC. Using hydrogen-deuterium exchange to monitor protein structure in the presence of gold nanoparticles. J Phys Chem B. 2014;118:14148–14156. doi: 10.1021/jp506506p. [DOI] [PubMed] [Google Scholar]
- Wales TE, Fadgen KE, Gerhardt GC, Engen JR. High-speed and high-resolution uplc separation at zero degree celsius. Anal Chem. 2008;80:6815–6820. doi: 10.1021/ac8008862. [DOI] [PMC free article] [PubMed] [Google Scholar]


