Significance
Drug development for Alzheimer’s disease (AD) has been largely unsuccessful to date. Although numerous agents are reportedly effective in vitro, only an inadequate number of them have been tested in vivo, partially because of the lack of reliable and cost-efficient imaging methods to monitor their in vivo therapeutic effectiveness. Several amyloid beta (Aβ)-specific PET tracers have been used for clinical studies. However, their application for monitoring drug treatment in small animals is limited. Near-infrared fluorescence (NIRF) molecular imaging is a cheap, easy-to-use, and widely available technology for small animal studies. In this report we demonstrate, for the first time to our knowledge, that NIRF imaging can be used to monitor the loading changes of Aβs in an AD mouse model.
Keywords: Alzheimer's, amyloid, imaging, fluorescence, curcumin
Abstract
Near-infrared fluorescence (NIRF) molecular imaging has been widely applied to monitoring therapy of cancer and other diseases in preclinical studies; however, this technology has not been applied successfully to monitoring therapy for Alzheimer’s disease (AD). Although several NIRF probes for detecting amyloid beta (Aβ) species of AD have been reported, none of these probes has been used to monitor changes of Aβs during therapy. In this article, we demonstrated that CRANAD-3, a curcumin analog, is capable of detecting both soluble and insoluble Aβ species. In vivo imaging showed that the NIRF signal of CRANAD-3 from 4-mo-old transgenic AD (APP/PS1) mice was 2.29-fold higher than that from age-matched wild-type mice, indicating that CRANAD-3 is capable of detecting early molecular pathology. To verify the feasibility of CRANAD-3 for monitoring therapy, we first used the fast Aβ-lowering drug LY2811376, a well-characterized beta-amyloid cleaving enzyme-1 inhibitor, to treat APP/PS1 mice. Imaging data suggested that CRANAD-3 could monitor the decrease in Aβs after drug treatment. To validate the imaging capacity of CRANAD-3 further, we used it to monitor the therapeutic effect of CRANAD-17, a curcumin analog for inhibition of Aβ cross-linking. The imaging data indicated that the fluorescence signal in the CRANAD-17–treated group was significantly lower than that in the control group, and the result correlated with ELISA analysis of brain extraction and Aβ plaque counting. It was the first time, to our knowledge, that NIRF was used to monitor AD therapy, and we believe that our imaging technology has the potential to have a high impact on AD drug development.
Alzheimer’s disease (AD) has been considered incurable, because none of the clinically tested drugs have shown significant effectiveness (1–4). Therefore, seeking effective therapeutics and imaging probes capable of assisting drug development is highly desirable. The amyloid hypothesis, in which various Aβ species are believed to be neurotoxic and one of the leading causes of AD, has been considered controversial in recent years because of the failures of amyloid beta (Aβ)-based drug development (1, 3, 5–8). However, no compelling data can prove that this hypothesis is wrong (2, 5), and no other theories indicate a clear path for AD drug development (4). Thus the amyloid hypothesis is still an important framework for AD drug development (1–5, 9–14). Additionally, Kim and colleagues (15) recently reported that a 3D cell-culture model of human neural cells could recapture AD pathology. In this study, their finding that the accumulation of Aβs could drive tau pathology provided strong support for the amyloid hypothesis (15).
It is well known that Aβ species, including soluble monomers, dimers, oligomers, and insoluble fibrils/aggregates and plaques, play a central role in the neuropathology of AD (2, 5). Initially, it was thought that insoluble deposits/plaques formed by the Aβ peptides in an AD brain cause neurodegeneration. However, studies have shown that soluble dimeric and oligomeric Aβ species are more neurotoxic than insoluble deposits (16–21). Furthermore, it has been shown that soluble and insoluble species coexist during disease progression. The initial stage of pathology is represented by an excessive accumulation of Aβ monomers resulting from imbalanced Aβ clearance (22, 23). The early predominance of soluble species gradually shifts with the progression of AD to a majority of insoluble species (24, 25). Therefore imaging probes capable of detecting both soluble and insoluble Aβs are needed to monitor the full spectrum of amyloidosis pathology in AD.
Thus far, three Aβ PET tracers have been approved by the Food and Drug Administration (FDA) for clinical applications. However, they are not approved for positive diagnosis of AD; rather, they are recommended for excluding the likelihood of AD. The fundamental limitation of these three tracers and others under development is that they bind primarily to insoluble Aβs, not the more toxic soluble Aβs (26–32). Clearly, work remains to be done in developing imaging probes based on Aβs, and imaging probes capable of diagnosing AD positively are undeniably needed.
Numerous agents reportedly are capable of inhibiting the generation and aggregation of Aβs in vitro; however, only few have been tested in vivo. Partially, this lack of testing arises from the lack of reliable imaging methods that can monitor the agents’ therapeutic effectiveness in vivo. PET tracers, such as 11C-Pittsburgh compound B (11C-PiB) and 18F-AV-45, recently have been adapted to evaluate the efficacy of experimental AD drugs in clinical trials (33). However, they are rarely used to monitor drug treatment in small animals (30–32), likely because of the insensitivity of the tracers for Aβ species [particularly for soluble species (34–36)], complicated experimental procedures and data analysis in small animals, the high cost of PET probe synthesis and scanning, and the use of radioactive material. Therefore, a great demand for imaging agents that could be used in preclinical drug development to monitor therapeutic effectiveness in small animals remains unmet.
Because of its low cost, simple operation, and easy data analysis, near infrared fluorescence (NIRF) imaging is generally more suitable than PET imaging for animal studies. Several NIRF probes for insoluble Aβs have been reported (37–45). It has been almost 10 y since the first report of NIRF imaging of Aβs by Hintersteiner et al. in 2005 (41). However, to the best of our knowledge, successful application of NIRF probes for monitoring therapeutic efficacy has not yet been reported. Our group recently has designed asymmetrical CRANAD-58 to match the hydrophobic (LVFF) and hydrophilic (HHQK) segments of Aβ peptides and demonstrated its applicability for the detection of both insoluble and soluble Aβs in vitro and in vivo (46). In this report, CRANAD-3 was designed to enhance the interaction with Aβs by replacing the phenyl rings of curcumin with pyridyls to introduce potential hydrogen bonds. Additionally, we demonstrated, for the first time to our knowledge, that the curcumin analog CRANAD-3 could be used as an NIRF imaging probe to monitor the Aβ-lowering effectiveness of therapeutics.
Results
Design and Synthesis of CRANAD-3.
In our previous studies, we showed that CRANAD-2, a curcumin-based NIRF imaging probe, can differentiate between 19-mo-old wild-type and transgenic mice by in vivo NIRF imaging (47). CRANAD-2 could be considered a “smart” probe because it displayed a significant increase in fluorescence intensity, an emission blue shift, a lifetime change, and quantum yield improvement upon interacting with insoluble Aβ aggregates (47). However, we found that CRANAD-2 was not able to detect soluble Aβ species (46).
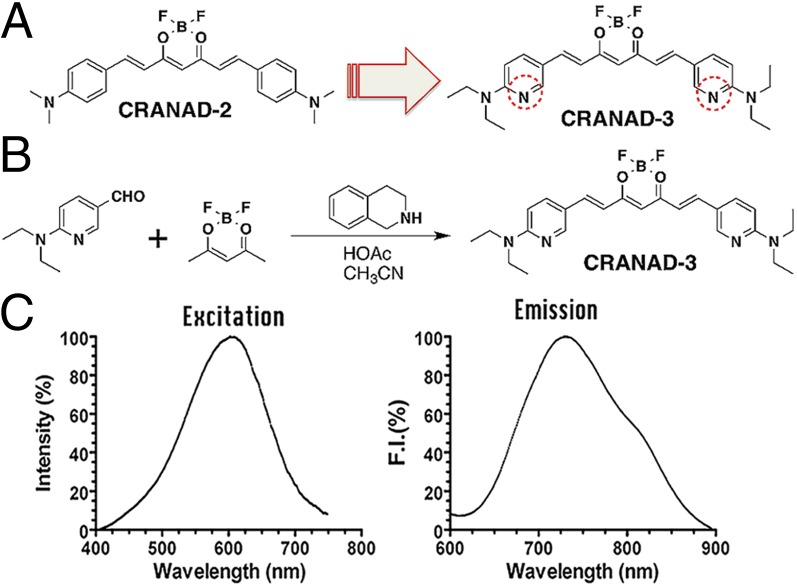
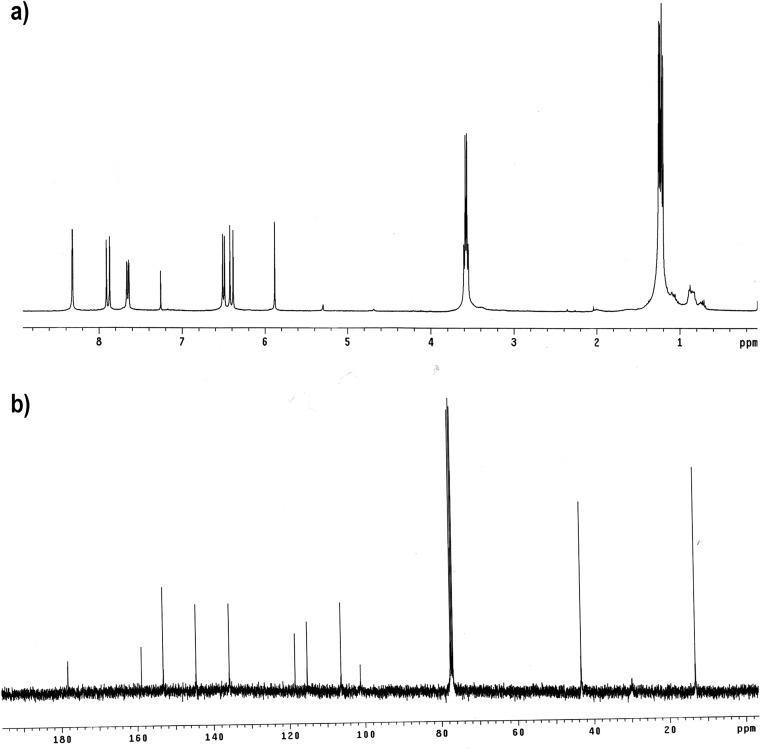
Because CRANAD-2 showed a significant fluorescence response to Aβ aggregates/fibrils but not to monomeric Aβ, we speculated that the interaction between monomeric Aβ40 and CRANAD-2 was most likely weak. We reasoned that this weak interaction could be enhanced by replacing the two phenyl rings with pyridyls to introduce hydrogen bonding between the engaged Aβ fragment and the nitrogen atoms of the pyridines (48, 49). To this end, we designed CRANAD-3, which was synthesized by a procedure similar to that used for CRANAD-2 (Fig. 1 A and B); its structure was confirmed by 1H, 13C, and 19F NMR/MS spectra (Fig. S1).
Fig. 1.
Design and synthesis of CRANAD-3. (A) The design of CRANAD-3 is based on CRANAD-2. (B) Synthetic route for CRANAD-3. (C) The excitation and emission spectra of CRANAD-3 (250 nM in PBS, pH 7.4).
Fig. S1.
1H NMR and 13C NMR of CRANAD-3.
In Vitro Characterization of CRANAD-3.
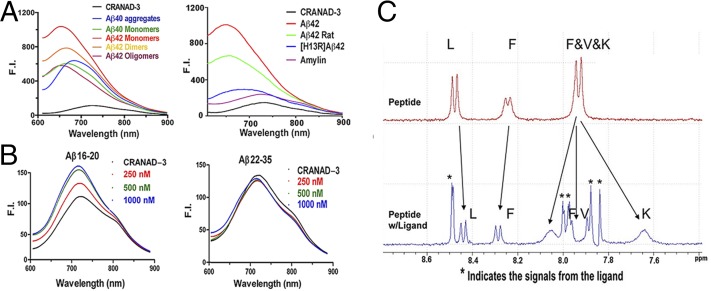
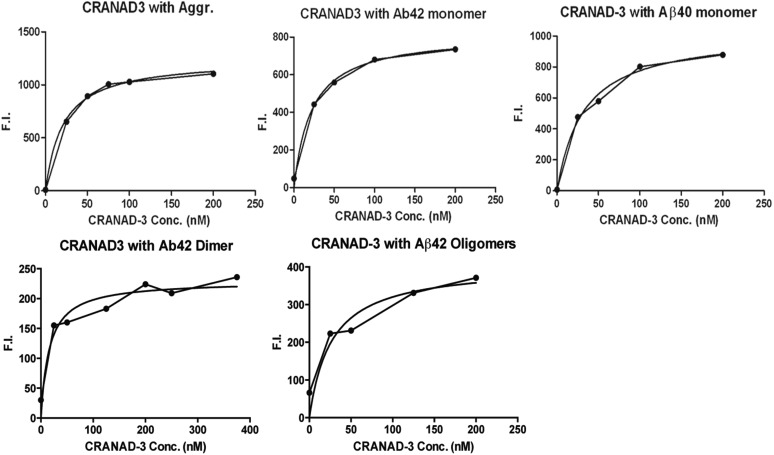
As expected, CRANAD-3 displayed an emission peak around 730 nm (Fig. 1C) in PBS and showed an excellent fluorescence response toward soluble species such as Aβ monomers, dimers, and oligomers (Fig. 2A). It displayed 12.3-, 39.5-, 16.3-, and 16.1-fold increases in fluorescence intensity at 670, 650, 670, and 650 nm for Aβ40 monomers, Aβ42 monomers, Aβ42 dimers, and Aβ42 oligomers, respectively. CRANAD-3 also showed a significant emission wavelength shift upon mixing with these soluble species (Fig. 2A). We found that CRANAD-3 exhibited strong binding with Aβ40/42 monomers, dimers, and oligomers (Kd = 24 ± 5.7 nM, 23 ± 1.6 nM, 16 ± 6.7 nM, and 27 ± 15.8 nM, respectively) (Fig. S2).
Fig. 2.
Fluorescence spectra and NMR testing of CRANAD-3 with various Aβs and fragments. (A) Fluorescence spectra of CRANAD-3 with soluble and insoluble Aβs (Left) and with amylin, rat Aβs, and mutated Aβs (Right). (B) Fluorescence spectra of CRANAD-3 with core fragment Aβ16–20 (KLVFF) (Left) and noncore fragment Aβ22–35 (Right). (C) 1H NMR spectra of KLVFF without (Upper) and with (Lower) CRANAD-3. Asterisks indicate peaks from CRANAD-3.
Fig. S2.
Titration curve of CRANAD-3 plotted against 500-nM Aβ40 aggregates (Kd = 21 ± 2.3 nM), Aβ42 monomers (Kd = 24 ± 1.6 nM), Aβ40 monomers (Kd = 23 ± 5.7nM), Aβ42 dimers (Kd = 16 ± 6.7 nM), and Aβ42 oligomers (Kd = 27 ± 15.8 nM) for calculation of the Kd constant. F.I., fluorescence intensity.
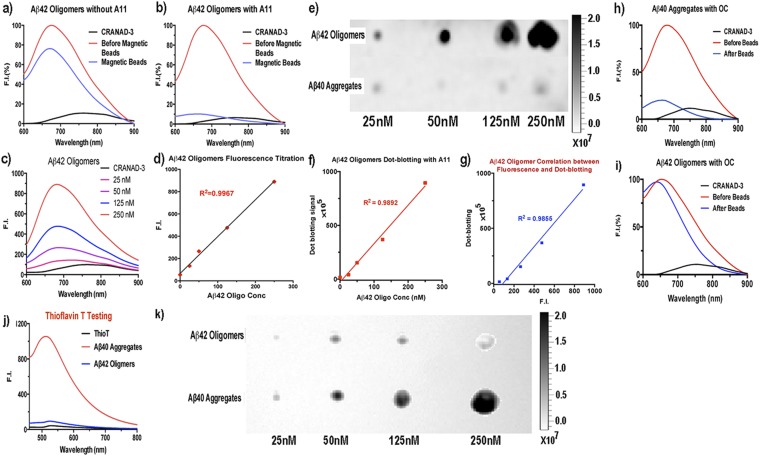
Because Aβ oligomers (AβO) have been considered the highly neurotoxic species in AD pathology (16–21), we conducted further comprehensive validation confirming that the fluorescence changes in CRANAD-3 originated from the interaction with AβO. First, we performed immunoprecipitation investigations with AβO-specific antibody A11 (50). We compared the fluorescence changes in two Aβ42O solutions, A and B, before and after immunoprecipitation. Solution A, which contained CRANAD-3 and Aβ42O, was used as control. In solution B, CRANAD-3, Aβ42O, and A11 antibody were mixed. We observed a 92% decrease in fluorescence intensity in solution B after precipitation with magnetic beads but only a 26% decrease in the control solution A (Fig. S3 A and B). These data strongly indicated that Aβ42O is the primary species contributing to the changes in fluorescence intensity. Second, we conducted titration experiments with CRANAD-3 and various concentrations of Aβ42O and achieved an excellent linear regression fit (Fig. S3 C and D). Third, we performed dot blotting for various concentrations of Aβ42O with A11 antibody (Fig. S3 E and F) and examined the correlation between the fluorescence signal and the signal from dot blotting. An excellent correlation was achieved between the two groups of signals (Fig. S3G), indicating that the fluorescence intensity can be used to reflect the content of Aβ42O. Moreover, we also conducted immunoprecipitation with fibril-specific OC antibody (51, 52) and observed a significant decrease in signal with Aβ40 aggregates (Fig. S3H). As expected, no significant decrease was observed for Aβ42O (Fig. S3I), indicating the absence of any significant amount of fibrillar Aβs in the tested Aβ42O solution. In addition, thioflavin-T testing, which is sensitive for insoluble fibrillar Aβs but not soluble oligomers, confirmed that the majority of the tested Aβ42O are nonfibrillar Aβs (Fig. S3J). This result was validated further by dot blotting with OC antibody (Fig. S3K).
Fig. S3.
Fluorescence testing and dot blotting of Aβ42 oligomers and aggregates with oligomer-specific A11 antibody and fibril-specific OC antibody. (A and B) Normalized changes in fluorescence intensity before (red trace) and after (blue trace) immunoprecipitation without (A) and with (B) A11 antibody. The significant decrease in fluorescence intensity in B indicated that the majority of the species in the solution were oligomeric Aβs. (C and D) Concentration titration of Aβ42 oligomers (C) and a linear regression fitting with emission intensity of CRANAD-3 at 680 nm (D). (E and F) Dot blotting for Aβ42 oligomers and aggregates (E) and a linear regression fitting with the signals from the dots of Aβ42 oligomers (F). (G) Correlation between the fluorescence intensity in C and D and dot signals in E and F. (H and I) Normalized changes in fluorescence intensity before (red traces) and after (blue traces) immunoprecipitation of Aβ40 aggregates (H) and Aβ42 oligomers (I) with fibril-specific OC antibody. (J) thioflavin-T testing with Aβ42 oligomers and Aβ40 aggregates. (K) Dot blotting for Aβ42 oligomers and aggregates with OC antibody.
Studies showed that pyroglutamate Aβ [AβN3(pE)] contributed substantially to AD pathology because of its high neurotoxicity and abundance in AD brains (53, 54). To investigate whether CRANAD-3 can interact with AβN3(pE), we performed fluorescence spectral testing similar to experiments with other Aβs. We found that the fluorescence intensity of CRANAD-3 increased significantly upon mixing with AβN3(pE) (Fig. S4A), indicating that CRANAD-3 is sensitive for AβN3(pE). In addition, CRANAD-3 displayed a significant increase in intensity and wavelength shift upon interaction with insoluble Aβ40 aggregates (Fig. 2A), suggesting that CRANAD-3 can detect both insoluble and soluble Aβs.
Fig. S4.
Fluorescence spectra of CRANAD-3 with pyroglutamate Aβ42 (A), α-synuclein and Tau441 proteins (B), and different concentrations of KLVLL (C).
To investigate the specificity of CRANAD-3 for Aβ species, amylin [an aggregation-prone 37-residue peptide secreted together with insulin by pancreatic B cells (55)] was incubated with CRANAD-3. No significant fluorescence property changes were observed (Fig. 2A), suggesting CRANAD-3’s excellent selectivity toward Aβ species. We also tested the interaction of CRANAD-3 with other amyloidogenic proteins, such as Tau 441 and α-synuclein, and observed no significant increase in fluorescence (Fig. S4B). In addition, we investigated the specificity of CRANAD-3 toward rat Aβ (the differences from human Aβ are R5G, Y10F, and H13R) and mutated (H13R) Aβ and found a significant decrease in fluorescence intensity (Fig. 2A), suggesting that these probes are highly specific toward human Aβs.
We also investigated whether CRANAD-3 could interact with the core fragment KLVFF (Aβ16–20) of Aβs. In vitro tests showed that the fluorescence intensities increased with the concentrations of KLVFF fragment (Fig. 2B). This result was consistent with our 1H NMR data, in which apparent changes in the chemical shift of amide protons were observed when CRANAD-3 was incubated with the fragment (Fig. 2C). Therefore, both fluorescence and NMR data suggested that CRANAD-3 interacts with the core fragment. In addition, no significant change in fluorescence property was observed when CRANAD-3 was mixed with a noncore fragment, Aβ22–35 (Fig. 2B). We also investigated whether this interaction was sequence dependent. In this regard, we tested the changes in the fluorescence intensity of CRANAD-3 with KLVLL, in which two phenylalanines were replaced by hydrophobic leucine. No significant changes in intensity were found (Fig. S4C), indicating that the interaction is sequence dependent and that phenylalanine residues are critical for the binding. Although we believe that CRANAD-3 interactions with Aβ species are sequence specific, conformational dependency also is possible. However, this hypothesis needs a separate investigation, which would be outside of the scope of the present study.
Two-Photon Imaging of Aβ Deposits with CRANAD-3.
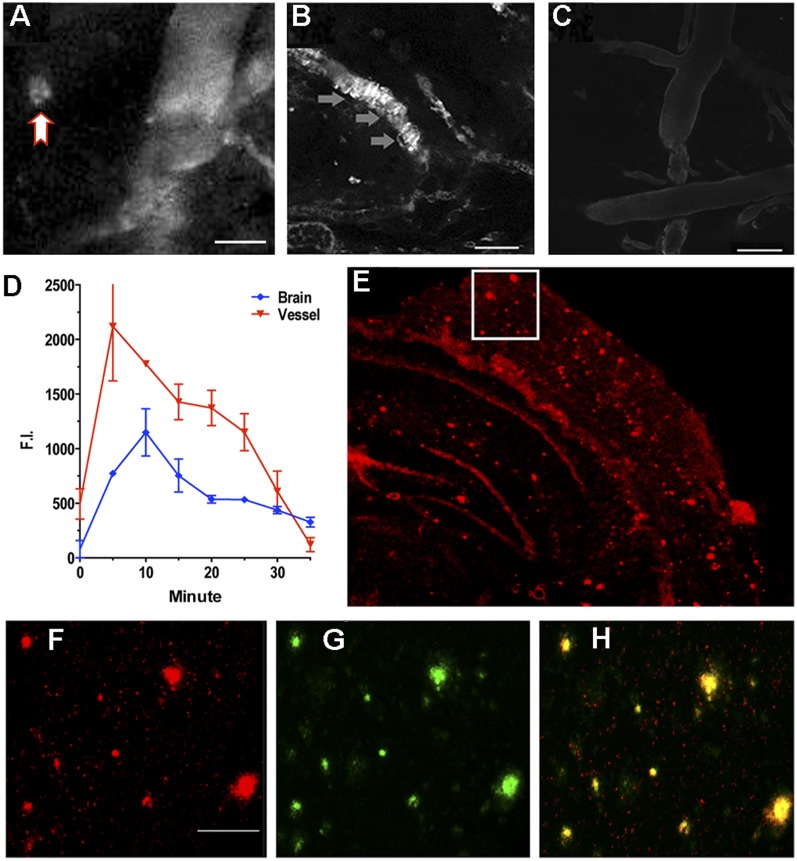
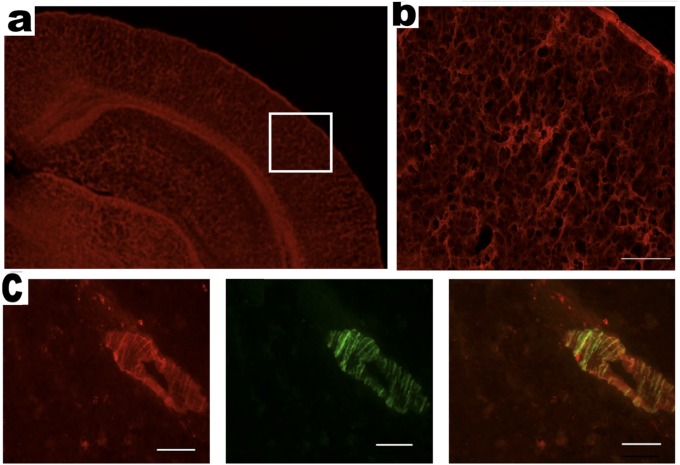
As a brain-imaging probe, CRANAD-3 must meet several requirements that include proper lipophilicity (log P) and reasonable penetration of the brain–blood barrier (BBB) (47). We found that log P for CRANAD-3 was 2.50, which is reasonable for brain imaging. To investigate whether CRANAD-3 is capable of penetrating the BBB, we used two-photon imaging to test its accumulation in the brain. Two-photon imaging is a microscopic technology that has been used widely for visualizing Aβ plaques in live mice (56, 57). As expected, two-photon images from transgenic AD mice indicated that CRANAD-3 is able to label Aβ plaques and cerebral amyloid angiopathies [CAAs, i.e., Aβ deposits at the exterior of brain blood vessels (58, 59)] (Fig. 3 A–C), suggesting that this probe can cross the BBB and specifically label Aβ species in vivo. In addition, the probe accumulated gradually in the brain and reached its peak around 10 min after injection, followed by a slow washout (Fig. 3D). Ex vivo histology confirmed that CRANAD-3 clearly labeled Aβ plaques in brain sections, further indicating its ability penetrate the BBB (Fig. 3 E–H and Fig. S5) and its specificity for Aβ species. No apparent plaques were observed in the age-matched wild-type mice by two-photon imaging and ex vivo histology (Fig. 3C and Fig. S5).
Fig. 3.
(A–C) Representative two-photon microscopic images with CRANAD-3 in a 14-mo-old APP/PS1 mouse (A and B) and in a wild-type control mouse (C). The red arrow in A indicates plaque. The gray arrow in B indicates CAA labeling. (Scale bars: 100 μm.) (D) Quantitative analysis of fluorescence intensity in blood vessels and in brain. Five or six ROIs were averaged. (E) Ex vivo histology of a mouse brain slice obtained after the two-photon imaging with CRANAD-3. (F) Magnified image of the boxed area in E. (Scale bar: 50 μm.) (G) Thioflavin-S–costained image. (H) Merged image of F and G.
Fig. S5.
Ex vivo histology of brain slices from a 14-mo-old APP/PS1 mouse and an age-matched wild-type mouse after injection of CRANAD-3. (A) Cortex and hippocampus area of an age-matched wild-type mouse. (B) Enlarged view of the boxed area in A. (C, Left) CAAs labeled with CRANAD-3. (Center) CAA costained with thioflavin-T. (Right) Merged image. (Scale bar: 50 μm.)
In Vivo NIRF Imaging of APP/PS1 Transgenic Mice with CRANAD-3.
APP/PS1 mice, the most studied transgenic AD mouse model (24, 56), were used to test the utility of CRANAD-3 for in vivo NIRF imaging. This mouse model possesses double humanized APP/PS1 genes and constantly produces considerable amounts of “human” Aβs. Previous studies indicate that APP/PS1 mice have no significant Aβ deposits or any noticeable behavioral abnormalities before 6 mo of age. It is believed that the majority of Aβ species in mice younger than 6 mo are soluble (24, 56). To test whether CRANAD-3 was able to detect soluble species in vivo by NIRF imaging, we used 4-mo-old APP/PS1 mice. We found that after i.v. injection the fluorescence signal from the brain of APP/PS1 mice was significantly higher than that from the age-matched wild-type mice at all time points used (Fig. 4). The signals from APP/PS1 mice were 2.29-, 2.04-, 1.98-, 1.60-, and 1.54-fold higher than the signals from wild-type controls at 5, 10, 30, 60, and 120 min after injection (Fig. 4), suggesting that CRANAD-3 indeed is capable of detecting soluble Aβ species in vivo.
Fig. 4.
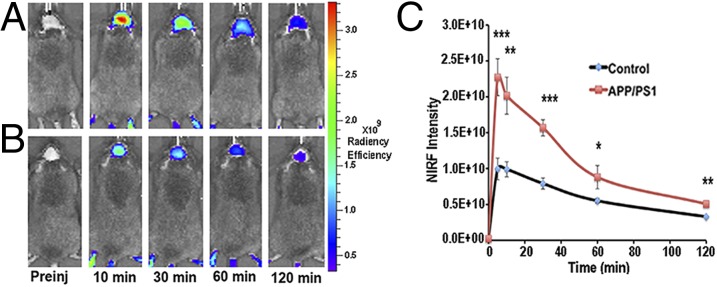
Representative images of APP/PS1 and wild-type control mice at different time points before and after i.v. injection of 0.5 mg/kg of CRANAD-3. (A and B) Images from a 4-mo-old APP-PS1 mouse (A) and a 4-mo-old control mouse (B). (C) Quantitative analysis of fluorescence signals from transgenic APP/PS1 mice and control mice (n = 3 or 4) at preinjection and 5, 10, 30, 60, and 120 min after i.v. injection. The signals were significantly higher in 4-mo-old APP/PS1 mice than in the age-matched control mice. *P < 0.05, **P < 0.01, ***P < 0.005.
Proof-of-Concept Application of CRANAD-3 for Therapy Monitoring.
Our two-photon microscopic imaging and NIRF imaging indicated that CRANAD-3 is able to penetrate the BBB and is specific toward Aβ species. These results encouraged us to investigate CRANAD-3′s capacity for monitoring therapy. To this end, we used two experimental drugs to conduct proof-of-concept experiments.
Monitoring the rapid Aβ-lowering effect of inhibiting beta-amyloid cleaving enzyme-1.
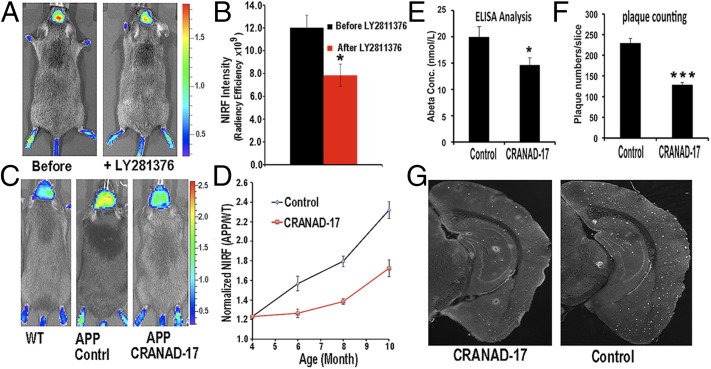
Developing beta-amyloid cleaving enzyme-1 (BACE-1) inhibitors is one of the current mainstream approaches for AD drug discovery, and several drug candidates have advanced into clinical trials. Although none of the BACE-1 inhibitors is presently approved by the FDA for clinical use, several inhibitors show consistent efficacy in lowering soluble Aβ species in transgenic mice in a short period of treatment. Because our imaging probe can detect soluble Aβs, we conducted NIRF imaging to investigate whether CRANAD-3 can monitor the rapid reduction of soluble Aβs. We first tested the capacity of CRANAD-3 with the well-characterized BACE-1 inhibitor LY2811376, which could lead to a 60% decrease in the soluble Aβs in mouse cortex after a single oral dose (30 mg/kg) (60). As expected, the fluorescence signal of CRANAD-3 from APP/PS1 mice (n = 4) after LY2811376 treatment was 33% lower than the signal from the same mice before treatment (Fig. 5 A and B). The difference detected by our near-infrared (NIR) imaging was smaller than that reported from ELISA with brain extracts (33% vs. 60%), very likely because an Aβ antibody-based ELISA is more specific than our NIRF small molecule.
Fig. 5.
Application of CRANAD-3 for monitoring therapeutic effects of drug treatments. (A) In vivo imaging of APP/PS1 mice with CRANAD-3 before and after treatment with the BACE-1 inhibitor LY2811376. (B) Quantitative analysis of the imaging in A (n = 4). (C) Representative images of 4-mo-old APP/PS1 mice after 6 mo of treatment with CRANAD-17. (Left) Age-matched WT mouse. (Center) Control APP/PS1 mouse. (Right) CRANAD-17–treated APP/PS1 mouse. Note that the NIRF signal from the CRANAD-17–treated APP/PS1 mouse (Right) is lower than the signal from the nontreated control APP/PS1 mouse (Center). (D) Quantitative analysis of the imaging in C (n = 5). (E) ELISA analysis of total Aβ40 from brain extracts. (F) Analysis of plaque counting. (G) Representative histological staining with thioflavin S. (Left) CRANAD-17–treated mouse. (Right) Control. *P < 0.05, **P < 0.01, ***P < 0.005.
Monitoring long-term therapy with CRANAD-17.
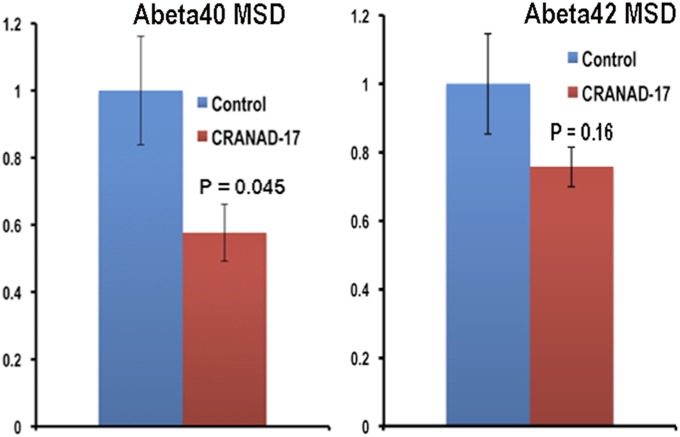
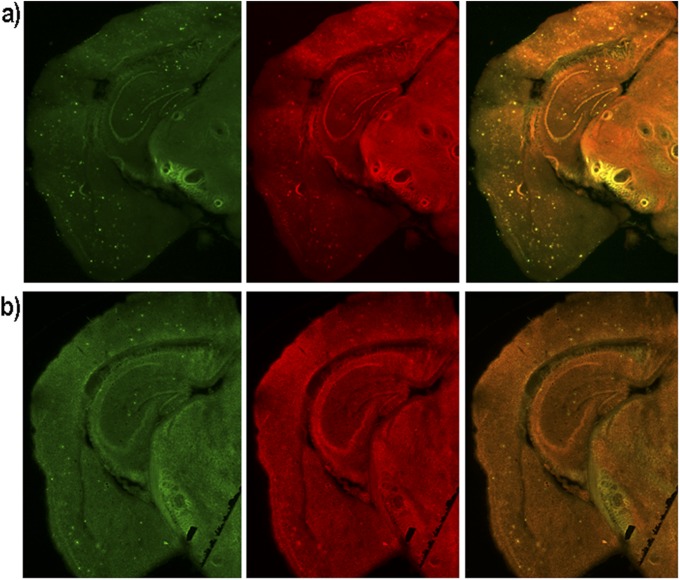
In our previous studies, we designed the imidazole-containing curcumin analog CRANAD-17, which could compete specifically with the H13, H14 of Aβ peptides and lead to a reduction of copper-induced Aβ cross-linking in vitro (46). We performed a preliminary in vivo therapeutic treatment of 4-mo-old APP/PS1 mice with CRANAD-17 for 6 mo. We treated mice (n = 5) with an i.p. injection of CRANAD-17 (2 mg/kg) twice a week, and the control APP/PS1 group (n = 5) was injected with the same volume of saline. After a 6-mo treatment, NIRF imaging with CRANAD-3 indicated that the CRANAD-17–treated group showed significantly lower NIRF signals (25%) than the nontreated group (Fig. 5 C and D). This result was consistent with the ELISA analysis showing a 36% reduction in Aβ40 in the brain extracts (Fig. 5E). Our ELISA results were confirmed further by Meso Scale Discovery (MSD) analysis (Fig. S6A) (61–63). We also observed a 25% decrease in Aβ42 in the CRANAD-17–treated group by MSD analysis, although the difference between the two groups did not reach statistical significance (Fig. S6B). In addition, our NIR imaging result was consistent with plaque counting in brain slices stained with thioflavin-S, which showed a 56% reduction with CRANAD-17 treatment (Fig. 5 F and G). Interestingly, a comparison of the brain slices from the two groups showed that the number of dimly fluorescent and diffused plaques apparently was lower in the treated group than in the control group (Fig. 5G and Fig. S7), probably because of the anti–cross-linking capability of CRANAD-17.
Fig. S6.
MSD measurements of brain extracts from APP/PS1 mice without (n = 5) and with (n = 5) CRANAD-17 treatment.
Fig. S7.
Representative histological costaining with thioflavin-S (green) and CRANAD-3 (red). (A) Control. (B) CRANAD-17.
Our data from both short and chronic treatment studies strongly suggest that CRANAD-3 could be used to monitor the therapeutic effectiveness of drug treatment. Further protocol optimization is ongoing in Ran's group.
Discussion
Fluorescence molecular imaging technologies have advanced very rapidly in the past decade, particularly for peripheral diseases such as cancer and cardiovascular disease. However, its development and applications for CNS diseases has progressed sluggishly. PET imaging has been used widely for CNS diseases; however, its applications in preclinical studies have been limited because of the use of radioisotopes, the short lifetime of the imaging probes, its high cost, and facility requirements. Fluorescence molecular imaging is appealing for small animal studies because of its low cost, easy operation, and stable imaging probes. In the past decade, the development of fluorescent imaging probes for AD has been actively pursued, and several probes showed capacity for imaging Aβs (37–45) and Tau tangles (64) in mice. Nonetheless, none has been used to monitor the effectiveness of drug therapy.
Recent evidence shows that soluble Aβs, such as dimers and oligomers, are more neurotoxic than insoluble deposits and thus potentially could serve as biomarkers for presymptomatic stages of AD (2, 21). In the past decades, drug-development strategies using insoluble Aβ deposits as biomarkers for evaluation of AD have failed; this failure has led to a shift in research toward the targeting of soluble Aβs and to more clinical trials being conducted at the early/presymptomatic stage of AD (14). Imaging probes capable of detecting soluble Aβs are needed both for clinical trials and for preclinical evaluation.
Although both PET and NIRF probes for imaging Aβs are available, they have a fundamental limitation: they primarily detect insoluble Aβs, not the more toxic soluble Aβs. In our previous studies, we designed and tested the NIRF probe CRANAD-58, a curcumin analog, for detecting both soluble and insoluble Aβs (46). However, its sensitivity for in vivo imaging of Aβs is lower than that of CRANAD-3 (the ratios of NIRF signal F(APP/PS1)/F(WT) are 2.29 vs. 1.71, 2.04 vs. 1.61, and 1.98 vs. 1.82 at 5-, 10- and 30-min, respectively, after the probe injection) (46). Therefore, we decided to use CRANAD-3 to monitor therapeutic effectiveness in the proof-of-concept studies in this report.
The most remarkable advantage of CRANAD-3, compared with other NIRF imaging probes for Aβs, is its ability to detect both soluble and insoluble Aβs, making CRANAD-3 suitable for monitoring the rapid Aβ-lowering effect of BACE-1 inhibitors and other fast-acting drug candidates [i.e., bexarotene (63, 65–69) and citalopram (70)]. This ability is very important, because our imaging method would enable a quick evaluation of the efficacy of some categories of drug candidates, such as BACE-1 inhibitors, gamma-secretase inhibitors/modulators, and others (62, 71).
Our data indicate that CRANAD-3 is suitable for monitoring short-term and chronic treatments. However, more rigorous optimization is needed to make the protocol easily reproducible in other laboratories. Our optimization will focus on formulation, imaging procedure, and data analysis.
Two-photon microscopic imaging has been an important tool for studying amyloidosis of AD (57, 72–74). However, most of the fluorescent probes have short emission, which can limit imaging depth significantly. Although we did not intend to investigate the maximal imaging depth of CRANAD-3 in this report, we believe its NIR emission has the potential to enable deep two-photon imaging of Aβ plaques and CAAs.
Available transgenic AD models have different pathological features, with APP23, Tg2576, PSAPP (APPSwe/PS1M146L), and APP/PS1 mice being the models most often used (75, 76). Snellman et al. (77) recently reported that different mouse models have different retention capability for 11C-PiB. Among the tested AD models, only APP23 mice showed substantial 11C-PiB binding at the age of 18 mo. This result is consistent with data reported by Maeda et al. (78) and Mori et al. (79). Unlike previous PET imaging studies with PiB (30–32), these studies suggested that 11C-PiB with highly specific radioactivity could be used for mouse imaging, particularly for APP23 mice. Both studies attributed the differences to pyroglutamate Aβ, which contributes significantly to the Aβ deposits in old APP23 mice and probably plays an important role in the plaque binding with PiB (77–79). Our fluorescence data indicate that CRANAD-3 is responsive to pyroglutamate Aβs, suggesting that it could be used as an imaging probe with other AD models such as APP23 mice.
In this report, we demonstrated that CRANAD-3 is capable of detecting soluble Aβ both in vitro and in vivo. We believe that CRANAD-3 may be a potential probe for monitoring β-amyloid species at an early/presymptomatic stage of AD. However, the present limitations of fluorescence imaging in human subjects are clearly major obstacles to the clinical use of CRANAD-3. Recently, at least two emerging technologies have shown considerable promise for overcoming the practical difficulties of using CRANAD-3 in humans. First, rapid advances in fluorescence molecular tomography indicate that suitable scanners with penetrating capabilities up to 10 cm may be readily available soon (80, 81). Second, it is likely that the incorporation of isotopes into CRANAD-3 molecules will facilitate the use of the probe for PET imaging, which is a widely used clinical modality. These studies are currently under way in the C.R. laboratory.
Materials and Methods
Reagents used for the synthesis of CRANAD-3 were purchased from Aldrich and were used without further purification. All animal experiments were performed in compliance with institutional guidelines and were approved by the Institutional Animal Care and Use Committee at the Massachusetts General Hospital.
Full descriptions of methods used are available in SI Materials and Methods.
Testing of CRANAD-3 with Aβ40/42 Monomers, Aβ42 Dimers, Aβ42 Oligomers, and Aβ40 Aggregates.
To test interactions of CRANAD-3 with Aβ species, we use the following three-step procedure. In step 1, 1.0 mL of double-distilled water was added to a quartz cuvette as a blank control, and its fluorescence was recorded with the same parameters as for CRANAD-3. In step 2, fluorescence of a CRANAD-3 solution (1.0 mL, 250 nM) was recorded with excitation at 580 nm and emission from 610–900 nm. In step 3, to the above CRANAD-3 solution, 10 μL of Aβ species [25-μM stock solution in 30% (vol/vol) trifluoroethanol or hexafluoroisopropanol (HFIP) for monomers and dimers and 25-μM stock solution in PBS buffer for Aβ40 aggregates] was added to make the final Aβ concentration 250 nM. Fluorescence readings from this solution were recorded as described in step 2. A blank control from step 1 was used to correct the final spectra from steps 2 and 3.
In Vivo NIRF Imaging.
The IVIS Spectrum animal imaging system (PerkinElmer) was used to perform In vivo NIR imaging. Images were acquired with a 605-nm excitation filter and a 680-nm emission filter. Living Image 4.2 software (PerkinElmer) was used for data analysis.
Mice (n = 3 or 4 female transgenic APP-PS1 mice and n = 3 or 4 age-matched female wild-type control mice) were shaved before background imaging and were i.v. injected with freshly prepared CRANAD-3 [0.5 mg/kg, 15% (vol/vol) DMSO, 15% (vol/vol) cremophor, and 70% (vol/vol) PBS]. Fluorescence signals from the brain were recorded before and 5, 10, 30, 60, 120, and 180 min after i.v. injection of the probe. To evaluate our imaging results, a region of interest (ROI) was drawn around the brain region. Student t-test was used to calculate P values.
SI Materials and Methods
Reagents used for the synthesis of CRANAD-3 were purchased from Aldrich and used without further purification. Column chromatography was performed on a glass column slurry-packed with silica gel (60 Å, 40–63 mm; SiliCycle Inc.). Synthetic Aβ peptide (1-40/42), scrambled Aβ40, and amylin were purchased from rPeptide (Bogart; 30622). Aggregates for in vitro studies were generated by slow stirring of Aβ40 in PBS buffer for 3 d at room temperature. CRANAD-3 was dissolved in DMSO to prepare a 25.0-μM stock solution. 1H and 13C NMR spectra were recorded at 500 MHz and 125 MHz, respectively, and were reported in parts per million downfield from tetramethylsilane. For fluorescence measurements, we used an F-4500 Fluorescence Spectrophotometer (Hitachi). Mass spectra were obtained at the Harvard University Department of Chemistry Instrumentation Facility. Transgenic female APP-PS1 mice and age-matched wild-type female mice were purchased from Jackson Laboratory.
Synthesis of CRANAD-3.
The synthesis of 2,2-difluoro-1,3-dioxaboryl-pentadione was performed according to a protocol modified from our previously reported procedure (47). The 2,2-difluoro-1,3-dioxaboryl-pentadione crystals (0.15 g, 1.0 mmol) were dissolved in acetonitrile (3.0 mL), followed by the addition of acetic acid (0.2 mL), tetrahydroisoquinoline (0.04 mL, 0.3 mmol), and 6-N,N’-diethyl-3-pyridylaldehyde (0.36 g, 2.0 mmol). The resulted solution was stirred at 60 °C overnight. A black residue obtained after removing the solvent was subjected to flash column chromatography with methylene chloride to yield a black powder (63.0 mg, yield: 15.0%). 1H NMR (CDCl3) δ(ppm) 1.24 (t, 12H, J = 7.2 Hz), 3.58 (q, 8H, J = 7.2, 14.0 Hz), 5.89 (s, 1H), 6.42 (d, 2H, J = 16.0 Hz), 6.51 (d, 2H, J = 9.0 Hz), 7.66 (dd, 2H, J = 2.4, 9.0 Hz), 7.92 (d, 2H, J = 16.0 Hz), 8.34 (d, 2H, J = 5.0 Hz); 13C NMR (CDCl3) δ(ppm) 18.8, 42.7, 101.6, 106.3, 115.9, 118.6, 136.0, 144.2, 153.4, 159.8, 178.2; 19F NMR (CDCl3) δ(ppm) 141.99, 142.05; ESI-MS (M+H) m/z = 468.30.
Aβ40/42 Monomer Preparation.
Aβ40/42 monomers were prepared according to our previously reported procedure (45, 46, 82).
Preparation of Dimeric and Oligomeric Aβ42.
Dimeric and oligomeric Aβ42 were prepared according to our previously reported procedure (45, 46, 82).
Aβ40 Aggregate Preparation.
To prepare Aβ40 aggregates, we resuspended Aβ40 peptide (1.0 mg) in 1% ammonia hydroxyl solution (1.0 mL). Then 100 μL of the resulting solution was diluted 10-fold with PBS buffer (pH 7.4) and stirred at room temperature for 3 d. Transmission electron microscopy confirmed the formation of aggregates (47). This solution was kept at 4 °C for storage.
Testing of CRANAD-3 with Aβ40/42 Monomers, Aβ42 Dimers, Aβ42 Oligomers, and Aβ40 Aggregates.
To test interactions of CRANAD-3 with Aβ species, we used the following three-step procedure. In step 1, 1.0 mL of double-distilled water was added to a quartz cuvette as a blank control, and its fluorescence was recorded with the same parameters used for CRANAD-3. In step 2, the fluorescence of a CRANAD-3 solution (1.0 mL, 250 nM) was recorded with excitation at 580 nm and emission from 610–900 nm. In step 3, to the above CRANAD-3 solution, 10 μL of Aβ species (25 μM stock solution in 30% trifluoroethanol or HFIP for monomers and dimers and 25 μM stock solution in PBS buffer for Aβ40 aggregates) were added to make the final Aβ concentration 250 nM. Fluorescence readings from this solution were recorded as described in step 2. A blank control from step 1 was used to correct the final spectra from steps 2 and 3.
Immunoprecipitation with Antibody A11.
Two solutions (A and B), both containing Aβ42 oligomers (250 nM) and CRANAD-3 (250 nM) in PBS buffer, were subjected to fluorescence spectra recording before the immunoprecipitation. After the recording, 10 μL of A11 antibody (1:100 dilution) was added to solution B, and the resulting mixture was shaken gently for 30 min. After the incubation period, 30 μL prewashed magnetic beads (Dynabeads Protein G; Life Technologies, catalog no. 10004D) were added to solutions A and B, and the solutions were shaken gently for 10 min. After separation with a magnetic bar, the supernatants from both solutions were subjected again to fluorescence spectra recording. The fluorescence spectra were normalized as percent fluorescence intensity [F.I. (%)] by using the highest reading from the first fluorescence recording as 100%.
Concentration Titration with Aβ42 Oligomers.
A series of solutions containing 250 nM CRANAD-3 and various concentrations of Aβ42 oligomers (25, 50, 125, and 250 nM) were subjected to fluorescence spectral recording. The emission readings at 680 nm were used for a linear regression fit.
Dot Blotting with A11 Antibody.
For dot blotting the amounts of Aβ42 oligomers used in the above titration experiments were applied to a nitrocellulose membrane, and the same amounts of Aβ40 aggregates were applied as controls. The treated membrane was blocked with 5% BSA for 1 h and then was incubated overnight at 4 °C with A11 antibody (1:1,000) in a solution of 5% BSA, Tris-buffered saline, and Tween 20. The membrane then was washed, incubated with a second antibody solution (HRP-goat anti-mouse; Invitrogen), and visualized with a standard protocol.
Immunoprecipitation and Dot Blotting with OC Antibody.
The procedures for immunoprecipitation and dot blotting with OC antibody are similar to the protocols with A11 antibody described above.
Two-Photon Imaging.
A 14-mo-old APP/PS1 female mouse was anesthetized with Ketamine/xylazine (70 mg/kg), and a cranial imaging window was surgically prepared as described (83). A bolus i.v. injection of CRANAD-3 (0.5 mg/kg in a fresh solution of 15% cremophor, 15% DMSO, and 70% PBS) was administered at time 0 min during image acquisition. Two-photon fluorescence excitation was accomplished with a 900-nm laser (Prairie Ultima). For imaging we used a two-photon microscope (Olympus BX-51) equipped with a 20× water-immersion objective (0.45 numerical aperture; Olympus) (57). Images using a 512 × 512 μm matrix were collected at 15 s per frame for 45 min. Image analysis was performed with ImageJ software with five or six ROIs for each data group.
In Vivo NIRF Imaging.
The IVIS Spectrum animal imaging system (PerkinElmer) was used for in vivo NIR imaging. Images were acquired with a 605-nm excitation filter and a 680-nm emission filter. Living Image 4.2 software (PerkinElmer) was used for data analysis.
Mice (n = 3 or 4 female transgenic APP-PS1 mice and n = 3 or 4 age-matched female wild-type control mice) were shaved before background imaging and were i.v. injected with freshly prepared CRANAD-3 [0.5 mg/kg, 15% (vol/vol) DMSO, 15% (vol/vol) cremophor, and 70% (vol/vol) PBS]. Fluorescence signals from the brain were recorded before and 5, 10, 30, 60, 120, and 180 min after i.v. injection of the probe. To evaluate our imaging results, an ROI was drawn around the brain region. Student t-test was used to calculate P values.
CRANAD-3 for Therapy Monitoring.
BACE-1 treatment.
Four-month-old APP/PS1 mice (n = 4) were imaged with CRANAD-3 before LY2811376 treatment. Images were captured at 10, 30, and 60 min after i.v. injection of CRANAD-3 (0.5 mg/kg). The next day, the mice were treated with LY2811376. The treatment protocol was modified from reference 60. Briefly, each mouse was i.v. injected with LY2811376 (10 mg/kg) once each day for 3 d. At the end of the third day, the mice were imaged again with the same imaging protocol. Quantification analysis was based on the signal of CRANAD-3 at 30 min after i.v. injection.
CRANAD-17 treatment.
APP/PS1 mice (4-mo-old, n = 10) were divided into two groups (n = 5 per group), and one group was i.p. injected twice a week with 100 µL of CRANAD-17 (4 mg/kg, formulated with 10% cremophor, 10% DMSO, and 80% PBS). NIRF imaging monitoring with CRANAD-3 (excitation = 605 nm, emission = 680 nm) was performed at 0, 2, 4, and 6 months after the treatment. In the imaging experiment, CRANAD-3 (0.5 mg/kg) was i.v. injected, and images were captured 60 min after probe injection for the CRANAD-17–treated group, control APP/PS1 group, and age-matched wild-type group. After 6 mo of treatment, the mice were killed, and the brain of each mouse was excised. Each brain was divided in two equal halves. One half was subjected to extraction and then to ELISA analysis following the protocols suggested by Wako (Human/Rat beta amyloid-40 ELISA kit, catalog no. 294-64701) and the procedure reported by Borchelt (84). The other half of the brain was embedded in optimum cutting temperature (OCT, PSL Lab Supplies, Vista, CA) compound and sliced into 25-μm slices; then the slices were stained with thioflavin S. Eight slices from the hippocampus area of each mouse were subjected to Aβ plaque counting by ImageJ.
MSD Analysis.
The procedures for detecting the levels of Aβ peptides in MSD analysis followed the protocols suggested by the manufacturer (Meso Scale Diagnostics LLC) and previously reported (61–63). In short, MSD is an electrochemiluminescence-based multiarray method on the Quickplex SQ 120 system platform (Meso Scale Diagnostics LLC). We used 4G8 Aβ 3-Plex Ultra-Sensitive Kits, which detect Aβ40 and Aβ42 peptides in a 96-well–based assay system. The samples first were prepared in the appropriate protein lysis buffer and then were resuspended in the diluents provided by the manufacturer. The mixed solution was placed on a shaker for 2 h, followed by washing and incubation with detection antibodies for another 2 h. Next, we used the MESO QuickPlex SQ 120 system (Meso Scale Diagnostics LLC) to capture the electrochemiluminescence signals. Finally, we used the protein concentrations from the provided standards to analyze the protein concentrations in the samples.
Ex Vivo Histological Study.
Animals used for two-photon imaging with CRANAD-3 were killed and perfused 2 h after the injection. Brains were excised, embedded in OCT, then sliced into 25-μm slices, costained with 1% thioflavin S (ethanol solution), and covered with VectaShield mounting medium (Vector Laboratories). Florescence images were observed with a Nikon Eclipse 50i microscope.
Acknowledgments
We thank Pamela Pantazopoulos for proofreading the manuscript. This work was supported by Award K25AG036760 from NIH (to C.R.).
Footnotes
The authors declare no conflict of interest.
This article is a PNAS Direct Submission.
This article contains supporting information online at www.pnas.org/lookup/suppl/doi:10.1073/pnas.1505420112/-/DCSupplemental.
References
- 1.Giacobini E, Gold G. Alzheimer disease therapy--moving from amyloid-β to tau. Nat Rev Neurol. 2013;9(12):677–686. doi: 10.1038/nrneurol.2013.223. [DOI] [PubMed] [Google Scholar]
- 2.Selkoe DJ. Resolving controversies on the path to Alzheimer’s therapeutics. Nat Med. 2011;17(9):1060–1065. doi: 10.1038/nm.2460. [DOI] [PubMed] [Google Scholar]
- 3.Abbott A. Neuroscience: The plaque plan. Nature. 2008;456(7219):161–164. doi: 10.1038/456161a. [DOI] [PubMed] [Google Scholar]
- 4.Buckholtz NS, Ryan LM, Petanceska S, Refolo LM. NIA commentary: Translational issues in Alzheimer’s disease drug development. Neuropsychopharmacology. 2012;37(1):284–286. doi: 10.1038/npp.2011.116. [DOI] [PMC free article] [PubMed] [Google Scholar]
- 5.Jonsson T, et al. A mutation in APP protects against Alzheimer’s disease and age-related cognitive decline. Nature. 2012;488(7409):96–99. doi: 10.1038/nature11283. [DOI] [PubMed] [Google Scholar]
- 6.Castellani RJ, et al. Reexamining Alzheimer’s disease: Evidence for a protective role for amyloid-beta protein precursor and amyloid-beta. J Alzheimers Dis. 2009;18(2):447–452. doi: 10.3233/JAD-2009-1151. [DOI] [PMC free article] [PubMed] [Google Scholar]
- 7.Kim T, et al. Human LilrB2 is a β-amyloid receptor and its murine homolog PirB regulates synaptic plasticity in an Alzheimer’s model. Science. 2013;341(6152):1399–1404. doi: 10.1126/science.1242077. [DOI] [PMC free article] [PubMed] [Google Scholar]
- 8.John V, editor. BACE: Lead Target for Orchestrated Therapy of Alzheimer’s Disease. Wiley; Hoboken, NJ: 2010. [Google Scholar]
- 9.Faux NG, et al. PBT2 rapidly improves cognition in Alzheimer’s Disease: Additional phase II analyses. J Alzheimers Dis. 2010;20(2):509–516. doi: 10.3233/JAD-2010-1390. [DOI] [PubMed] [Google Scholar]
- 10.Monceaux CJ, et al. Triazole-linked reduced amide isosteres: An approach for the fragment-based drug discovery of anti-Alzheimer’s BACE1 inhibitors. Bioorg Med Chem Lett. 2011;21(13):3992–3996. doi: 10.1016/j.bmcl.2011.05.007. [DOI] [PubMed] [Google Scholar]
- 11.Lee J, et al. Identification of presenilin 1-selective γ-secretase inhibitors with reconstituted γ-secretase complexes. Biochemistry. 2011;50(22):4973–4980. doi: 10.1021/bi200026m. [DOI] [PubMed] [Google Scholar]
- 12.Barrow JC, et al. Discovery and X-ray crystallographic analysis of a spiropiperidine iminohydantoin inhibitor of beta-secretase. J Med Chem. 2008;51(20):6259–6262. doi: 10.1021/jm800914n. [DOI] [PubMed] [Google Scholar]
- 13.Zhang MR, et al. Synthesis and evaluation of N-(5-fluoro-2-phenoxyphenyl)-N-(2-[(18)F]fluoromethoxy-d(2)-5-methoxybenzyl)acetamide: A deuterium-substituted radioligand for peripheral benzodiazepine receptor. Bioorg Med Chem. 2005;13(5):1811–1818. doi: 10.1016/j.bmc.2004.11.058. [DOI] [PubMed] [Google Scholar]
- 14.Sperling RA, et al. The A4 study: Stopping AD before symptoms begin? Sci Transl Med. 2014;6(228):228fs13. doi: 10.1126/scitranslmed.3007941. [DOI] [PMC free article] [PubMed] [Google Scholar]
- 15.Choi SH, et al. A three-dimensional human neural cell culture model of Alzheimer’s disease. Nature. 2014;515(7526):274–278. doi: 10.1038/nature13800. [DOI] [PMC free article] [PubMed] [Google Scholar]
- 16.McLean CA, et al. Soluble pool of Abeta amyloid as a determinant of severity of neurodegeneration in Alzheimer’s disease. Ann Neurol. 1999;46(6):860–866. doi: 10.1002/1531-8249(199912)46:6<860::aid-ana8>3.0.co;2-m. [DOI] [PubMed] [Google Scholar]
- 17.Lue LF, et al. Soluble amyloid beta peptide concentration as a predictor of synaptic change in Alzheimer’s disease. Am J Pathol. 1999;155(3):853–862. doi: 10.1016/s0002-9440(10)65184-x. [DOI] [PMC free article] [PubMed] [Google Scholar]
- 18.Terry RD, et al. Physical basis of cognitive alterations in Alzheimer’s disease: Synapse loss is the major correlate of cognitive impairment. Ann Neurol. 1991;30(4):572–580. doi: 10.1002/ana.410300410. [DOI] [PubMed] [Google Scholar]
- 19.Townsend M, Mehta T, Selkoe DJ. Soluble Abeta inhibits specific signal transduction cascades common to the insulin receptor pathway. J Biol Chem. 2007;282(46):33305–33312. doi: 10.1074/jbc.M610390200. [DOI] [PubMed] [Google Scholar]
- 20.Walsh DM, Selkoe DJ. A beta oligomers - a decade of discovery. J Neurochem. 2007;101(5):1172–1184. doi: 10.1111/j.1471-4159.2006.04426.x. [DOI] [PubMed] [Google Scholar]
- 21.Shankar GM, et al. Amyloid-beta protein dimers isolated directly from Alzheimer’s brains impair synaptic plasticity and memory. Nat Med. 2008;14(8):837–842. doi: 10.1038/nm1782. [DOI] [PMC free article] [PubMed] [Google Scholar]
- 22.Hardy J, Selkoe DJ. The amyloid hypothesis of Alzheimer’s disease: Progress and problems on the road to therapeutics. Science. 2002;297(5580):353–356. doi: 10.1126/science.1072994. [DOI] [PubMed] [Google Scholar]
- 23.Mawuenyega KG, et al. Decreased clearance of CNS beta-amyloid in Alzheimer’s disease. Science. 2010;330(6012):1774–1776. doi: 10.1126/science.1197623. [DOI] [PMC free article] [PubMed] [Google Scholar]
- 24.Hsiao K, et al. Correlative memory deficits, Abeta elevation, and amyloid plaques in transgenic mice. Science. 1996;274(5284):99–102. doi: 10.1126/science.274.5284.99. [DOI] [PubMed] [Google Scholar]
- 25.Cao D, Lu H, Lewis TL, Li L. Intake of sucrose-sweetened water induces insulin resistance and exacerbates memory deficits and amyloidosis in a transgenic mouse model of Alzheimer disease. J Biol Chem. 2007;282(50):36275–36282. doi: 10.1074/jbc.M703561200. [DOI] [PubMed] [Google Scholar]
- 26.Kantarci K, et al. Antemortem amyloid imaging and β-amyloid pathology in a case with dementia with Lewy bodies. Neurobiol Aging. 2012;33(5):878–885. doi: 10.1016/j.neurobiolaging.2010.08.007. [DOI] [PMC free article] [PubMed] [Google Scholar]
- 27.Ikonomovic MD, et al. Post-mortem correlates of in vivo PiB-PET amyloid imaging in a typical case of Alzheimer’s disease. Brain. 2008;131(Pt 6):1630–1645. doi: 10.1093/brain/awn016. [DOI] [PMC free article] [PubMed] [Google Scholar]
- 28.Kalaitzakis ME, Pearce RK. Beyond the limits of detection: Failure of PiB imaging to capture true Aβ burden. Mov Disord. 2013;28(3):406. doi: 10.1002/mds.25307. [DOI] [PubMed] [Google Scholar]
- 29.Gomperts SN, Johnson KA, Growdon J. Reply: Beyond the limits of detection: Failure of PiB imaging to capture true Aβ burden. Mov Disord. 2013;28(3):407. doi: 10.1002/mds.25309. [DOI] [PMC free article] [PubMed] [Google Scholar]
- 30.Mathis CA, Mason NS, Lopresti BJ, Klunk WE. Development of positron emission tomography β-amyloid plaque imaging agents. Semin Nucl Med. 2012;42(6):423–432. doi: 10.1053/j.semnuclmed.2012.07.001. [DOI] [PMC free article] [PubMed] [Google Scholar]
- 31.Zhang L, Chang RC, Chu LW, Mak HK. Current neuroimaging techniques in Alzheimer’s disease and applications in animal models. Am J Nucl Med Mol Imaging. 2012;2(3):386–404. [PMC free article] [PubMed] [Google Scholar]
- 32.Kuntner C, et al. Limitations of small animal PET imaging with [18F]FDDNP and FDG for quantitative studies in a transgenic mouse model of Alzheimer’s disease. Mol Imaging Biol. 2009;11(4):236–240. doi: 10.1007/s11307-009-0198-z. [DOI] [PubMed] [Google Scholar]
- 33.Nordberg A. Molecular imaging in Alzheimer’s disease: New perspectives on biomarkers for early diagnosis and drug development. Alzheimers Res Ther. 2011;3(6):34. doi: 10.1186/alzrt96. [DOI] [PMC free article] [PubMed] [Google Scholar]
- 34.Jack CR, Jr, et al. In vivo visualization of Alzheimer’s amyloid plaques by magnetic resonance imaging in transgenic mice without a contrast agent. Magn Reson Med. 2004;52(6):1263–1271. doi: 10.1002/mrm.20266. [DOI] [PMC free article] [PubMed] [Google Scholar]
- 35.Klunk WE, et al. Imaging brain amyloid in Alzheimer’s disease with Pittsburgh Compound-B. Ann Neurol. 2004;55(3):306–319. doi: 10.1002/ana.20009. [DOI] [PubMed] [Google Scholar]
- 36.Nordberg A, Rinne JO, Kadir A, Långström B. The use of PET in Alzheimer disease. Nat Rev Neurol. 2010;6(2):78–87. doi: 10.1038/nrneurol.2009.217. [DOI] [PubMed] [Google Scholar]
- 37.Jakob-Roetne R, Jacobsen H. Alzheimer’s disease: From pathology to therapeutic approaches. Angew Chem Int Ed Engl. 2009;48(17):3030–3059. doi: 10.1002/anie.200802808. [DOI] [PubMed] [Google Scholar]
- 38.Chang WM, et al. ANCA: A family of fluorescent probes that bind and stain amyloid plaques in human tissue. ACS Chem Neurosci. 2011;2(5):249–255. doi: 10.1021/cn200018v. [DOI] [PMC free article] [PubMed] [Google Scholar]
- 39.Choi SR, et al. Preclinical properties of 18F-AV-45: A PET agent for Abeta plaques in the brain. J Nucl Med. 2009;50(11):1887–1894. doi: 10.2967/jnumed.109.065284. [DOI] [PMC free article] [PubMed] [Google Scholar]
- 40.Li Q, et al. Solid-phase synthesis of styryl dyes and their application as amyloid sensors. Angew Chem Int Ed Engl. 2004;43(46):6331–6335. doi: 10.1002/anie.200461600. [DOI] [PubMed] [Google Scholar]
- 41.Hintersteiner M, et al. In vivo detection of amyloid-beta deposits by near-infrared imaging using an oxazine-derivative probe. Nat Biotechnol. 2005;23(5):577–583. doi: 10.1038/nbt1085. [DOI] [PubMed] [Google Scholar]
- 42.Cui M, Ono M, Kimura H, Liu B, Saji H. Synthesis and structure-affinity relationships of novel dibenzylideneacetone derivatives as probes for β-amyloid plaques. J Med Chem. 2011;54(7):2225–2240. doi: 10.1021/jm101404k. [DOI] [PubMed] [Google Scholar]
- 43.Cui M, et al. Smart near-infrared fluorescence probes with donor-acceptor structure for in vivo detection of β-amyloid deposits. J Am Chem Soc. 2014;136(9):3388–3394. doi: 10.1021/ja4052922. [DOI] [PubMed] [Google Scholar]
- 44.Ono M, Watanabe H, Kimura H, Saji H. BODIPY-based molecular probe for imaging of cerebral β-amyloid plaques. ACS Chem Neurosci. 2012;3(4):319–324. doi: 10.1021/cn3000058. [DOI] [PMC free article] [PubMed] [Google Scholar]
- 45.Ran C, Zhao W, Moir RD, Moore A. Non-conjugated small molecule FRET for differentiating monomers from higher molecular weight amyloid beta species. PLoS One. 2011;6(4):e19362. doi: 10.1371/journal.pone.0019362. [DOI] [PMC free article] [PubMed] [Google Scholar]
- 46.Zhang X, et al. Design and synthesis of curcumin analogues for in vivo fluorescence imaging and inhibiting copper-induced cross-linking of amyloid beta species in Alzheimer’s disease. J Am Chem Soc. 2013;135(44):16397–16409. doi: 10.1021/ja405239v. [DOI] [PMC free article] [PubMed] [Google Scholar]
- 47.Ran C, et al. Design, synthesis, and testing of difluoroboron-derivatized curcumins as near-infrared probes for in vivo detection of amyloid-beta deposits. J Am Chem Soc. 2009;131(42):15257–15261. doi: 10.1021/ja9047043. [DOI] [PMC free article] [PubMed] [Google Scholar]
- 48.Hanyu M, et al. Studies on intramolecular hydrogen bonding between the pyridine nitrogen and the amide hydrogen of the peptide: Synthesis and conformational analysis of tripeptides containing novel amino acids with a pyridine ring. J Pept Sci. 2005;11(8):491–498. doi: 10.1002/psc.647. [DOI] [PubMed] [Google Scholar]
- 49.Rzepecki P, Schrader T. beta-Sheet ligands in action: KLVFF recognition by aminopyrazole hybrid receptors in water. J Am Chem Soc. 2005;127(9):3016–3025. doi: 10.1021/ja045558b. [DOI] [PubMed] [Google Scholar]
- 50.Kayed R, et al. Common structure of soluble amyloid oligomers implies common mechanism of pathogenesis. Science. 2003;300(5618):486–489. doi: 10.1126/science.1079469. [DOI] [PubMed] [Google Scholar]
- 51.Wu JW, et al. Fibrillar oligomers nucleate the oligomerization of monomeric amyloid beta but do not seed fibril formation. J Biol Chem. 2010;285(9):6071–6079. doi: 10.1074/jbc.M109.069542. [DOI] [PMC free article] [PubMed] [Google Scholar]
- 52.Kayed R, et al. Fibril specific, conformation dependent antibodies recognize a generic epitope common to amyloid fibrils and fibrillar oligomers that is absent in prefibrillar oligomers. Mol Neurodegener. 2007;2:18. doi: 10.1186/1750-1326-2-18. [DOI] [PMC free article] [PubMed] [Google Scholar]
- 53.Schilling S, et al. On the seeding and oligomerization of pGlu-amyloid peptides (in vitro) Biochemistry. 2006;45(41):12393–12399. doi: 10.1021/bi0612667. [DOI] [PubMed] [Google Scholar]
- 54.Mori H, Takio K, Ogawara M, Selkoe DJ. Mass spectrometry of purified amyloid beta protein in Alzheimer’s disease. J Biol Chem. 1992;267(24):17082–17086. [PubMed] [Google Scholar]
- 55.Marshall KE, Serpell LC. Structural integrity of beta-sheet assembly. Biochem Soc Trans. 2009;37(Pt 4):671–676. doi: 10.1042/BST0370671. [DOI] [PubMed] [Google Scholar]
- 56.Garcia-Alloza M, et al. Characterization of amyloid deposition in the APPswe/PS1dE9 mouse model of Alzheimer disease. Neurobiol Dis. 2006;24(3):516–524. doi: 10.1016/j.nbd.2006.08.017. [DOI] [PubMed] [Google Scholar]
- 57.Zhang X, et al. A bifunctional curcumin analogue for two-photon imaging and inhibiting crosslinking of amyloid beta in Alzheimer’s disease. Chem Commun (Camb) 2014;50(78):11550–11553. doi: 10.1039/c4cc03731f. [DOI] [PMC free article] [PubMed] [Google Scholar]
- 58.Smith EE, Greenberg SM. Beta-amyloid, blood vessels, and brain function. Stroke. 2009;40(7):2601–2606. doi: 10.1161/STROKEAHA.108.536839. [DOI] [PMC free article] [PubMed] [Google Scholar]
- 59.de la Torre JC. Is Alzheimer’s disease a neurodegenerative or a vascular disorder? Data, dogma, and dialectics. Lancet Neurol. 2004;3(3):184–190. doi: 10.1016/S1474-4422(04)00683-0. [DOI] [PubMed] [Google Scholar]
- 60.May PC, et al. Robust central reduction of amyloid-β in humans with an orally available, non-peptidic β-secretase inhibitor. J Neurosci. 2011;31(46):16507–16516. doi: 10.1523/JNEUROSCI.3647-11.2011. [DOI] [PMC free article] [PubMed] [Google Scholar]
- 61.Zhang C, Browne A, Child D, Tanzi RE. Curcumin decreases amyloid-beta peptide levels by attenuating the maturation of amyloid-beta precursor protein. J Biol Chem. 2010;285(37):28472–28480. doi: 10.1074/jbc.M110.133520. [DOI] [PMC free article] [PubMed] [Google Scholar]
- 62.Wagner SL, et al. Soluble γ-secretase modulators selectively inhibit the production of the 42-amino acid amyloid β peptide variant and augment the production of multiple carboxy-truncated amyloid β species. Biochemistry. 2014;53(4):702–713. doi: 10.1021/bi401537v. [DOI] [PMC free article] [PubMed] [Google Scholar]
- 63.Veeraraghavalu K, et al. Comment on “ApoE-directed therapeutics rapidly clear beta-amyloid and reverse deficits in AD mouse models”. Science. 2013;340(6135):924-f. doi: 10.1126/science.1235505. [DOI] [PubMed] [Google Scholar]
- 64.Maruyama M, et al. Imaging of tau pathology in a tauopathy mouse model and in Alzheimer patients compared to normal controls. Neuron. 2013;79(6):1094–1108. doi: 10.1016/j.neuron.2013.07.037. [DOI] [PMC free article] [PubMed] [Google Scholar]
- 65.Landreth GE, et al. Response to comments on “ApoE-directed therapeutics rapidly clear beta-amyloid and reverse deficits in AD mouse models”. Science. 2013;340(6135):924-g. doi: 10.1126/science.1234114. [DOI] [PMC free article] [PubMed] [Google Scholar]
- 66.Tesseur I, et al. Comment on “ApoE-directed therapeutics rapidly clear beta-amyloid and reverse deficits in AD mouse models”. Science. 2013;340(6135):924-e. doi: 10.1126/science.1233937. [DOI] [PubMed] [Google Scholar]
- 67.Price AR, et al. Comment on “ApoE-directed therapeutics rapidly clear beta-amyloid and reverse deficits in AD mouse models”. Science. 2013;340(6135):924-d. doi: 10.1126/science.1234089. [DOI] [PubMed] [Google Scholar]
- 68.Fitz NF, Cronican AA, Lefterov I, Koldamova R. Comment on “ApoE-directed therapeutics rapidly clear β-amyloid and reverse deficits in AD mouse models”. Science. 2013;340(6135):924-c. doi: 10.1126/science.1235809. [DOI] [PMC free article] [PubMed] [Google Scholar]
- 69.Cramer PE, et al. ApoE-directed therapeutics rapidly clear β-amyloid and reverse deficits in AD mouse models. Science. 2012;335(6075):1503–1506. doi: 10.1126/science.1217697. [DOI] [PMC free article] [PubMed] [Google Scholar]
- 70.Sheline YI, et al. An antidepressant decreases CSF Aβ production in healthy individuals and in transgenic AD mice. Sci Transl Med. 2014;6(236):236re4. doi: 10.1126/scitranslmed.3008169. [DOI] [PMC free article] [PubMed] [Google Scholar]
- 71.Kounnas MZ, et al. Modulation of gamma-secretase reduces beta-amyloid deposition in a transgenic mouse model of Alzheimer’s disease. Neuron. 2010;67(5):769–780. doi: 10.1016/j.neuron.2010.08.018. [DOI] [PMC free article] [PubMed] [Google Scholar]
- 72.Bacskai BJ, et al. Four-dimensional multiphoton imaging of brain entry, amyloid binding, and clearance of an amyloid-beta ligand in transgenic mice. Proc Natl Acad Sci USA. 2003;100(21):12462–12467. doi: 10.1073/pnas.2034101100. [DOI] [PMC free article] [PubMed] [Google Scholar]
- 73.Nesterov EE, et al. In vivo optical imaging of amyloid aggregates in brain: Design of fluorescent markers. Angew Chem Int Ed Engl. 2005;44(34):5452–5456. doi: 10.1002/anie.200500845. [DOI] [PubMed] [Google Scholar]
- 74.Grutzendler J, Yang G, Pan F, Parkhurst CN, Gan WB. Transcranial two-photon imaging of the living mouse brain. Cold Spring Harb Protoc. 2011;2011(9):pdb.prot065474. doi: 10.1101/pdb.prot065474. [DOI] [PMC free article] [PubMed] [Google Scholar]
- 75.Ashe KH, Zahs KR. Probing the biology of Alzheimer’s disease in mice. Neuron. 2010;66(5):631–645. doi: 10.1016/j.neuron.2010.04.031. [DOI] [PMC free article] [PubMed] [Google Scholar]
- 76.Howlett DR. APP transgenic mice and their application to drug discovery. Histol Histopathol. 2011;26(12):1611–1632. doi: 10.14670/HH-26.1611. [DOI] [PubMed] [Google Scholar]
- 77.Snellman A, et al. Longitudinal amyloid imaging in mouse brain with 11C-PIB: Comparison of APP23, Tg2576, and APPswe-PS1dE9 mouse models of Alzheimer disease. J Nucl Med. 2013;54(8):1434–1441. doi: 10.2967/jnumed.112.110163. [DOI] [PubMed] [Google Scholar]
- 78.Maeda J, et al. Longitudinal, quantitative assessment of amyloid, neuroinflammation, and anti-amyloid treatment in a living mouse model of Alzheimer’s disease enabled by positron emission tomography. J Neurosci. 2007;27(41):10957–10968. doi: 10.1523/JNEUROSCI.0673-07.2007. [DOI] [PMC free article] [PubMed] [Google Scholar]
- 79.Mori T, et al. Molecular imaging of dementia. Psychogeriatrics. 2012;12(2):106–114. doi: 10.1111/j.1479-8301.2012.00409.x. [DOI] [PubMed] [Google Scholar]
- 80.Weissleder R, Pittet MJ. Imaging in the era of molecular oncology. Nature. 2008;452(7187):580–589. doi: 10.1038/nature06917. [DOI] [PMC free article] [PubMed] [Google Scholar]
- 81.Luker GD, Luker KE. Optical imaging: Current applications and future directions. J Nucl Med. 2008;49(1):1–4. doi: 10.2967/jnumed.107.045799. [DOI] [PubMed] [Google Scholar]
- 82.Moir RD, et al. Autoantibodies to redox-modified oligomeric Abeta are attenuated in the plasma of Alzheimer’s disease patients. J Biol Chem. 2005;280(17):17458–17463. doi: 10.1074/jbc.M414176200. [DOI] [PubMed] [Google Scholar]
- 83.Mostany R, Portera-Cailliau C. A craniotomy surgery procedure for chronic brain imaging. J Vis Exp. 2008;(12):pii680. doi: 10.3791/680. [DOI] [PMC free article] [PubMed] [Google Scholar]
- 84.Borchelt DR, et al. Familial Alzheimer’s disease-linked presenilin 1 variants elevate Abeta1-42/1-40 ratio in vitro and in vivo. Neuron. 1996;17(5):1005–1013. doi: 10.1016/s0896-6273(00)80230-5. [DOI] [PubMed] [Google Scholar]


