

Significance
Intrinsically disordered proteins play a central role in cellular signaling and regulatory networks. Many regulatory proteins contain disordered recognition motifs that fold upon binding to their cellular targets, by mechanisms that are poorly understood. Here we show that the disordered transactivation domain of the transcription factor c-Myb binds to the KIX domain of the transcriptional coactivator cAMP-response element binding (CREB-binding) protein (CBP) by a mechanism that involves elements of conformational selection and induced fit. In contrast, the phosphorylated kinase-inducible activation domain of CREB binds to the same site on KIX by an induced-fit mechanism. The intrinsic secondary structure propensities of these two disordered proteins determine their binding mechanisms, consistent with their functions as inducible and constitutive transcriptional activators.
Keywords: intrinsically disordered protein, coupled folding and binding, NMR relaxation, transcriptional coactivator CBP, transcriptional activator c-Myb
Abstract
Intrinsically disordered proteins (IDPs) frequently function in protein interaction networks that regulate crucial cellular signaling pathways. Many IDPs undergo transitions from disordered conformational ensembles to folded structures upon binding to their cellular targets. Several possible binding mechanisms for coupled folding and binding have been identified: folding of the IDP after association with the target (“induced fit”), or binding of a prefolded state in the conformational ensemble of the IDP to the target protein (“conformational selection”), or some combination of these two extremes. The interaction of the intrinsically disordered phosphorylated kinase-inducible domain (pKID) of the cAMP-response element binding (CREB) protein with the KIX domain of a general transcriptional coactivator CREB-binding protein (CBP) provides an example of the induced-fit mechanism. Here we show by NMR relaxation dispersion experiments that a different intrinsically disordered ligand, the transactivation domain of the transcription factor c-Myb, interacts with KIX at the same site as pKID but via a different binding mechanism that involves elements of conformational selection and induced fit. In contrast to pKID, the c-Myb activation domain has a strong propensity for spontaneous helix formation in its N-terminal region, which binds to KIX in a predominantly folded conformation. The C-terminal region of c-Myb exhibits a much smaller helical propensity and likely folds via an induced-fit process after binding to KIX. We propose that the intrinsic secondary structure propensities of pKID and c-Myb determine their binding mechanisms, consistent with their functions as inducible and constitutive transcriptional activators.
Intrinsically disordered proteins (IDPs) are abundant in eukaryotes and are involved in critical cellular functions, including transcription, translation, and cell cycle control (1–4). Many IDPs fold upon binding to their cellular targets (5) and an understanding of the mechanism of coupled folding and binding is essential for understanding how they perform their biological functions. One of the best studied IDPs is the phosphorylated kinase-inducible domain (pKID) of the cAMP-response element binding (CREB) protein, which interacts with the KIX domain of the transcriptional coactivator CREB-binding protein (CBP) (6). CREB is an inducible transcriptional activator, and phosphorylation of the KID domain at S133 is critical for binding to KIX and for target gene expression (7, 8). The αB helix of unbound pKID is unstructured (9), but folds into helical structure upon binding to KIX (6). NMR relaxation dispersion experiments showed that coupled folding and binding occur by an induced-fit mechanism, in which pKID first forms encounter complexes with KIX, then forms a partly folded intermediate, and finally folds into the fully bound state without dissociation from KIX (10).
CBP is a general transcriptional coactivator that possesses acetyltransferase activity and mediates interactions between transcription factors and the basal transcription machinery (11). The KIX domain of CBP can bind the intrinsically disordered transactivation domains (TADs) of numerous transcription factors, including CREB, c-Myb, and the mixed-lineage leukemia (MLL) protein (4). The TADs of CREB (pKID) and c-Myb bind to a hydrophobic groove formed by the first and third α-helices of KIX (6, 8, 12, 13), whereas the TAD of MLL binds to a different surface, at the interface between the G2 310-helix and the second and third α-helices of KIX (12, 14). The proto-oncogene c-Myb is a constitutive transcriptional activator that regulates proliferation and differentiation of hematopoietic cells, whose aberrant amplification has been observed in leukemia (15). The TAD of c-Myb is only partly structured in the free form and can be categorized as an IDP (8). Unlike pKID, which binds tightly to KIX only after phosphorylation at S133, c-Myb interacts with KIX independent of posttranslational modifications (8, 16). Although pKID and c-Myb bind as amphipathic helices to the same site on KIX, there is no obvious sequence similarity between them (6, 8, 13). Thus, pKID and c-Myb constitute a good model system for elucidating the determinants of coupled folding and binding mechanisms.
The present work addresses the mechanism of coupled folding and binding of c-Myb to KIX, using NMR R2 relaxation dispersion experiments, where R2 is the transverse relaxation rate. This powerful technique provides information on protein dynamics in the microsecond to millisecond time range (17) and can provide atomic resolution insights into coupled folding and binding processes of IDPs (10, 18). We found that, unlike pKID, c-Myb binds KIX in a two-state manner without formation of observable intermediates and that the association kinetics strongly depend on the residual helical structure present in the N-terminal portion of c-Myb. The binding mechanisms of these two disordered domains therefore differ, even though they bind to the same site on KIX.
Results
Helix-Forming Propensity of Free c-Myb.
The c-Myb TAD used in this work (residues 284–315, termed Myb32) is longer than used in previous studies (residues 291–315; Myb25) (8, 13, 14) and binds more tightly to KIX (see below). Far-UV circular dichroism (CD) spectra show that free Myb32 and Myb25 are mostly unstructured, although Myb32 shows a greater propensity for helix than Myb25 (Fig. 1A). The 1H-15N heteronuclear single quantum coherence (HSQC) spectrum of free Myb32 shows little dispersion in the 1H dimension, confirming that Myb32 is disordered in the free form (Fig. 1B and Fig. S1A, blue peaks).
Fig. 1.

Conformational propensities of free c-Myb. (A) Far-UV CD spectra of free Myb32 (red) and Myb25 (blue). (B) Portion of a series of 1H-15N HSQC spectra of 15N-labeled Myb32 showing chemical shift changes upon titration with KIX. The cross-peak color changes gradually from blue (free) to red (bound) according to the concentration ratios shown. The complete spectrum is shown in Fig. S1. (C) Secondary 13Cα chemical shifts of free Myb32 (red) and Myb25 (blue). (D) Portion of a series of 1H-15N HSQC spectra of 15N-labeled KIX showing chemical shift changes upon titration with Myb32. The cross-peak color changes gradually from black (free) to magenta (bound) according to the concentration ratios shown. The complete spectrum is shown in Fig. S1.
Fig. S1.

(A) 1H-15N HSQC spectra of 15N-labeled Myb32 showing chemical shift changes upon titration with KIX. Assignments are shown for residues showing fast-exchange shifts. The cross-peak color changes gradually from blue (free) to red (bound) according to the concentration ratios shown. (B) 1H-15N HSQC spectra of 15N-labeled KIX showing chemical shift changes upon titration with Myb32. The cross-peak color changes gradually from black (free) to magenta (bound) according to the concentration ratios shown. (C and D) Histograms of the averaged chemical shift differences Δδav for the primary (C) and secondary (D) binding of Myb32 to KIX. The black horizontal line shows the mean of all Δδav (0.144 ppm and 0.105 ppm for primary and secondary binding, respectively). The residues are categorized into the following groups: red, greater than or equal to mean + 2 × SD; orange, mean + 1 SD to mean + 2 SD; yellow, mean to mean + 1 SD; and gray, less than mean. (C) 1H and 15N chemical shifts of KIX for the c-Myb bound form at a 1:0.8 KIX:Myb32 ratio were subtracted from those of free KIX to get ΔδH and ΔδN. The data at a 1:0.8 ratio (rather than at 1:1) were used for primary binding to eliminate the effect of secondary c-Myb binding to KIX. (D) ΔδH and ΔδN obtained from the titration analysis (Fig. S3A) were used to calculate Δδav. The data at a 1:0.8 ratio were used as a reference. (E) 1H-15N HSQC spectra of 15N-labeled Myb32 showing chemical shift changes upon titration with the KIX-L628A mutant. The cross-peak color changes gradually from blue (free) to red (bound) according to the concentration ratios shown. Fast-exchange shifts are observed for some peaks in the titrations of small amounts of KIX, suggesting the presence of secondary c-Myb binding on KIX.
Secondary 13Cα chemical shifts of free Myb32, calculated by subtraction of sequence-corrected random coil shifts (19, 20), are shown in Fig. 1C together with data for Myb25 (8). The 13Cα shifts indicate that the central regions of both constructs are partially helical and show that the additional residues at the N terminus of Myb32 extend and stabilize the helical structure. Using the parameterization of Yao et al. (21), the population of helix in the region between residues 290 and 301 of Myb32 was estimated to be ∼70% from sequence-corrected secondary 13Cα and 13C′ chemical shifts. The helix stability is probably associated with formation of an N-capping hydrogen bond between the side-chain oxygen of D288 and the main-chain amide of E290 that is preferentially stabilized by P289 (22). The C-terminal region of Myb32, residues 302–310, also has a propensity for spontaneous helix formation, but to a much smaller extent (∼20%).
c-Myb:KIX Interactions.
Detailed examination of Myb32:KIX interactions by HSQC titrations and isothermal titration calorimetry (ITC) shows that KIX has two c-Myb binding sites. The 1H-15N HSQC spectrum of 15N-labeled Myb32 bound to KIX at 1:1.2 mol ratio shows well-dispersed peaks (Fig. 1B and Fig. S1A, red peaks), indicating that c-Myb folds upon binding to KIX. However, on titration of substoichiometric concentrations of KIX into 15N-labeled Myb32, several cross-peaks shift from their positions in the free Myb32 spectrum but do not move linearly to the positions for the fully bound Myb32:KIX complex (Fig. 1B). This shows that in addition to the primary, high-affinity site, c-Myb also binds to a secondary, lower-affinity site on KIX when in excess, as has been observed for pKID binding to KIX (10).
The location of the secondary c-Myb binding site can be determined by titration of 15N-labeled KIX with unlabeled Myb32 (Fig. 1D and Fig. S1B). At substoichiometric concentrations of Myb32, the KIX HSQC peaks shift in slow exchange. Mapping of chemical shift perturbations at a 1:0.8 KIX:Myb32 ratio, referenced to free KIX, indicates that the primary c-Myb binding site on KIX overlaps with the pKID binding site (Fig. 2A and Fig. S1C), as shown in the structure of the Myb25:KIX complex (14). However, in the presence of excess Myb32, some KIX cross-peaks shift further in fast to intermediate exchange, indicating binding of c-Myb to a secondary site on KIX. The weighted average 15N/1H chemical shift changes at high Myb32 concentrations, referenced to the shifts at a 1:0.8 KIX:Myb32 ratio, are large for residues Q609, I611, T614, L620, K621, A630, A632, and Q661 (Fig. 2B and Fig. S1D). These resonances are all sensitive to binding of peptides in the MLL site (12, 23), suggesting that the secondary c-Myb binding site on KIX overlaps with the MLL binding site.
Fig. 2.

c-Myb:KIX interactions. (A and B) Primary (A) and secondary (B) c-Myb binding sites on KIX. The weighted average chemical shift differences between the free and bound KIX amide resonances are mapped onto the surface of KIX in the KIX:c-Myb:MLL ternary complex (Protein Data Bank ID 2AGH) (14). Changes in chemical shift greater than 2 × SD from the mean (red), between 1 SD and 2 SD from the mean (orange), and between mean and 1 SD from the mean (yellow) are indicated. c-Myb (residues 290–315) and MLL (residues 2,842–2,860) are shown in blue and green, respectively. (C) 15N-labeled Myb32 titration with KIX in the presence of a twofold excess of MLL28 over the KIX concentration. (D) 15N-labeled KIX titration with Myb32 in the presence of MLL28 in a twofold excess to KIX. The cross-peak color changes gradually from blue (free) to red (bound) in C and from black (free) to magenta (bound) in D according to the concentration ratios shown.
The dissociation constants for the primary and secondary interactions of Myb32 with KIX, Kd1 and Kd2, were estimated by ITC to be 0.23 ± 0.06 μM and 43 ± 14 μM, respectively (Fig. S2A). Global analysis of chemical shift changes (24) upon titration of 15N-labeled KIX with Myb32, referenced to the shifts at a 1:0.8 KIX:Myb32 ratio, gives a Kd2 of 46 ± 1 μM (Fig. S3A), in good agreement with the ITC results.
Fig. S2.

(A and B) ITC titration profiles (Upper) and binding isotherms (Lower) for the Myb32:KIX interactions in the absence (A) and the presence (B) of MLL28 [20 mM Tris-acetate (pH 7.0), 50 mM NaCl, 30 °C]. (A) 0.8 mM Myb32 was titrated into 45 μM KIX. Two titration curves from duplicate measurements were globally fitted assuming a two-site binding model. Thermodynamic parameters are Kd1 = 0.23 ± 0.06 μM, N1 = 1.1 ± 0.2, ΔG1 = –9.2 ± 0.2 kcal/mol, ΔH1 = –5 ± 1 kcal/mol, TΔS1 = –4 ± 1 kcal/mol, Kd2 = 43 ± 14 μM, N2 = 0.8 ± 0.2, ΔG2 = –6.1 ± 0.2 kcal/mol, ΔH2 = –7 ± 3 kcal/mol, TΔS2 = 1 ± 3 kcal/mol. A correction factor for the Myb32 concentration was 1.1 ± 0.2. (B) 0.6 mM Myb32 was titrated into 45 μM KIX in the presence of 90 μM MLL28. The titration curve was fitted to a one-site binding model. Thermodynamic parameters are Kd = 0.213 ± 0.008 μM, N = 1.04 ± 0.01, ΔG = –9.3 ± 0.2 kcal/mol, ΔH = –9.5 ± 0.1 kcal/mol, and TΔS = –0.3 ± 0.1 kcal/mol.
Fig. S3.

(A) Global fitting of the titration curves for the 15N-KIX titration with unlabeled Myb32, referenced to the shifts at a 1:0.8 KIX:Myb32 ratio (24). 1H (A, Left) and 15N (A, Right) chemical shift changes of HSQC cross-peaks of 15N-KIX are plotted as a function of the Myb32/KIX concentration ratio. Only the peaks showing clear fast-exchange shifts were used for fitting (154 curves for 77 assigned peaks). Color codes are shown (A, Right) along with the residue number. In the fitting, we assumed that Kd1 is 0.213 μM, which was obtained by the ITC experiment for the Myb32 binding to the primary site on KIX in the presence of excess MLL28 and that ΔδH and ΔδN in the primary binding site are zero (23). The global fitting gave a Kd2 of 46 ± 1 μM. A correction factor for the Myb32 concentration was 1.174 ± 0.002 (24). (B) 15N R2 relaxation dispersion curves for 15N-Myb32 in the free form (B, Left) and for 15N-Myb32 in the presence of twofold excess of MLL28 (B, Right) measured with an 800-MHz spectrometer at 0.7 mM Myb32. Color codes are shown in each panel along with the residue number.
Suppression of Secondary c-Myb Binding to KIX.
The presence of two c-Myb binding sites on KIX complicates analysis of the mechanism of coupled folding and binding. To simplify the binding process, we explored two strategies to eliminate the secondary c-Myb binding site. First we used the L628A mutant of KIX, which has a 100-fold lower affinity for MLL (23), to reduce the affinity of the secondary c-Myb binding site. However, on titration of KIX-L628A into 15N-labeled Myb32, fast-exchange shifts of Myb32 were still observed at substoichiometric concentrations of KIX, showing the persistence of secondary c-Myb binding (Fig. S1E). In the second approach, excess MLL TAD (residues 2,842–2,869; MLL28) was added to the Myb32:KIX complex, to compete out the secondary c-Myb binding to the MLL site. This strategy worked well, and addition of twofold excess of MLL28 to KIX eliminated secondary c-Myb interactions in titrations of 15N-labeled Myb32 with KIX and 15N-labeled KIX with Myb32 (Fig. 2 C and D).
ITC experiments show that the Kd for Myb32 binding to the primary site on KIX in the presence of excess MLL28 is 0.213 ± 0.008 μM, which is similar to the Kd1 measured in the absence of MLL28 (0.23 ± 0.06 μM) (Fig. S2B). These measurements indicate that Myb32 binds more tightly to KIX than does the shorter Myb25 construct (Kd = 10 ± 2 μM) (12).
Simulations of Myb32:KIX interactions over the range of concentrations used for R2 relaxation dispersion experiments show that in the absence of MLL28, 91–96% of Myb32 binds to the primary c-Myb site on KIX, 3–9% binds to the secondary site, and 0.2–0.7% is in the free form (SI Text and Fig. S4 A–C). Because relaxation dispersion experiments are sensitive to low-abundance species (∼1%), the presence of 3–9% of secondary c-Myb binding would complicate the study of the binding mechanism. On the other hand, simulations show that with MLL28 in twofold excess over KIX, 94–99% of Myb32 binds to the primary c-Myb site, 0.2–0.5% binds to the secondary c-Myb site, and 0.5–5.6% is in the free form (SI Text and Fig. S4 D–G). Under these conditions, relaxation dispersion experiments should be insensitive to binding in the secondary (MLL) site and will thus report only on c-Myb interactions with the primary binding site on KIX.
Fig. S4.

(A) Concentrations of various Myb32 species dependent on a KIX:Myb32 concentration ratio from 0 to 1.5 at 0.7 mM Myb32. Red, Myb32 bound to the primary c-Myb binding site on KIX; blue, Myb32 bound to the secondary c-Myb binding site on KIX; and green, free Myb32. (B) Fractions of various Myb32 species under the conditions for R2 relaxation dispersion experiments (from 1:0.95 to 1:1.10 Myb32:KIX concentration ratios at 0.7 mM Myb32), plotted in a logarithmic scale. (C) The results show that 3–9% of Myb32 binds to the secondary, low-affinity site. See SI Text for details of the calculations. (D–F) Fractions of various KIX (D), MLL28 (E), and Myb32 (F) species under the conditions for R2 relaxation dispersion experiments plotted on a logarithmic scale (the KIX:Myb32:MLL28 concentration ratio = 1:0.95:1.90, 1:1.00:2.00, 1:1.05:2.10, and 1:1.10:2.20 at 0.7 mM Myb32). (D) The D2 form, in which Myb32 and MLL bind at the primary (c-Myb/pKID) and secondary (MLL) sites, respectively, is the most dominant form under these conditions. See SI Text for the definitions of various KIX forms. (E) Almost half of MLL28 binds to the MLL site, and the rest is mostly in the free form. Less than 2% of MLL28 binds to the primary site. Such a small amount of secondary MLL28 binding to KIX will not affect the Myb32 binding to the primary site on KIX. (F and G) More than 94% of Myb32 is bound to the primary site, 0.5–5.6% is in the free form, and only less than 0.5% is bound to the secondary site. Such a small fraction of secondary Myb32 binding to KIX will not be detected in the R2 relaxation dispersion experiments.
R2 Relaxation Dispersion Analysis of c-Myb:KIX Binding.
The 15N R2 relaxation dispersion profiles for free Myb32 are completely flat, both in the presence and in the absence of MLL28 (Fig. S3B), indicating that any folding/unfolding transitions that occur in free Myb32 must be faster than ∼105 s−1. Indeed, helix-coil transitions generally occur in the nanosecond time range (at a rate of 107–108 s−1) (25), very much faster than can be probed by R2 relaxation dispersion. These NMR experiments also show that MLL28 does not interact with Myb32 and does not interfere with c-Myb folding or binding to KIX.
To monitor the binding of c-Myb to KIX, we performed 15N R2 relaxation dispersion experiments at two magnetic fields (1H frequencies of 500 MHz and 800 MHz) for 15N-labeled Myb32 bound to the KIX:MLL28 complex. Data were acquired over a range of Myb32:KIX:MLL28 concentration ratios (1:0.95:1.90, 1:1.00:2.00, 1:1.05:2.10, and 1:1.10:2.20), with MLL28 in a twofold excess over KIX. Acquisition of dispersion data at several concentration ratios is necessary to determine the c-Myb:KIX association rate. In total, eight dispersion curves were measured for each residue (Fig. 3A). In R2 relaxation dispersion experiments, the effective transverse relaxation rate, , is the sum of the contribution from the exchange process, Rex, and the intrinsic relaxation rate, . Large Rex values were observed for residues 290–292, 297–303, and 305–309 (Fig. 3B and Fig. S5), all of which are located in the helical region of KIX-bound c-Myb. The dispersion curves for each residue vary with changes in the Myb32:KIX concentration ratio, showing that the exchange arises from a binding event. Twelve residues exhibit well-defined dispersion curves (Fig. 3A and Fig. S6) and were used in the following analysis. The remaining c-Myb resonances exhibited weak or noisy dispersion curves, with small values of Rex (Fig. 3B), or could not be analyzed because of cross-peak overlap.
Fig. 3.

R2 relaxation dispersion experiments. (A) 15N R2 relaxation dispersion profile for L301 of Myb32 recorded at 500-MHz and 800-MHz spectrometers and at 1:0.95–1:1.10 Myb32:KIX concentration ratios in the presence a twofold excess of MLL28 over KIX. (B) 15N Rex of Myb32 at 500 MHz at a concentration ratio of 1:0.95:1.90 Myb32:KIX:MLL28. Rex was estimated from the differences in at the lowest and highest 1/τcp values. Errors were estimated from duplicate measurements (10).
Fig. S5.

15N Rex of Myb32 in the presence of KIX and MLL28 measured by the R2 relaxation dispersion experiments with 500-MHz (Left) and 800-MHz (Right) spectrometers. 15N-Myb32:KIX:MLL28 concentration ratios are shown in each panel. Rex was estimated from the difference in at the lowest and highest 1/τcp values.
Fig. S6.

15N R2 relaxation dispersion curves for 12 residues of 15N-Myb32 in complex with KIX and MLL28 used for global analysis. In each panel, the Myb32:KIX concentration ratios and the color codes are shown. The MLL28 concentration was twofold excess of the KIX concentration. Solid lines are the fits to the two-state binding model.
The relaxation dispersion data were fitted using three different binding models (Fig. 4). Model 1 is a two-site exchange model, which assumes that free c-Myb folds and binds to KIX without formation of observable intermediates. The other models invoke formation of an intermediate, i.e., are three-site exchange models. Model 2 assumes that c-Myb first binds to KIX to form an intermediate and that folding is completed on the surface of KIX (5). In model 3, binding proceeds via a process of conformational selection, in which KIX binds selectively to a preferred conformer within the c-Myb conformational ensemble. If the rate of folding of free c-Myb to form the binding-competent conformation (kUH) is slower than the rate of association with KIX (kON [KIX]) and slow enough to be detectable by R2 relaxation dispersion, then binding would be modeled by a three-state process (model 3a). However, if the folding and unfolding processes of free c-Myb are very fast and are invisible on the relaxation dispersion timescale, then the conformational selection model reduces to an apparent two-site exchange mechanism (model 3b). For this mechanism, the association rate would be directly proportional to the population of correctly folded (helical) states in the conformational ensemble of the free c-Myb peptide.
Fig. 4.

Representative mechanisms of coupled folding and binding reactions of IDPs. kON and kOFF are the association and dissociation rates for c-Myb binding to KIX; kIB and kBI are the rates for the folding and unfolding reactions of c-Myb on the surface of KIX; kUH and kHU are the folding and unfolding rates of free c-Myb; c-Myb* denotes c-Myb in disordered structures; and c-MybU and c-MybH denote free c-Myb in the unfolded and helical states, respectively.
The dispersion curves for 12 residues at four concentration ratios and at two magnetic fields (a total of 96 curves) were fitted globally, using each of these models to obtain accurate estimates of rates and chemical shift differences (details in SI Text and Table S1). Fits to models 2 and 3a resulted in parameters that are physically unreasonable (details in Fig. S7). In addition, the fitted c-Myb conformational exchange rates (kUH = 1,900 s−1, kHU = 12,000 s−1) are 103–104 times slower than expected for helix-coil transitions in peptides (25) and are not consistent with the flat R2 dispersion profiles observed for free c-Myb (Fig. S3B). By contrast, the fit to the two-state model, where the association rate (kON), the dissociation rate (kOFF), and the chemical shift difference are fitted independently for each residue, gives physically reasonable parameters. The average kON and kOFF values are (1.7 ± 0.1) × 107 M−1⋅s−1 and 14.6 ± 0.7 s−1, respectively (Fig. 5 A and B). The small kOFF value is consistent with the slow-exchange behavior observed in the 15N-Myb32 titration with KIX for the primary c-Myb binding process. 15N chemical shift differences between the free and bound forms (ΔωFB) obtained from the fits to the R2 relaxation dispersion data are strongly correlated with equilibrium shift differences obtained by HSQC titrations (ΔδFB), indicating that the weakly populated state detected by the R2 relaxation dispersion experiments is the free form of Myb32 (Fig. 5C). Nevertheless, the mechanism of c-Myb binding is more complicated than a simple two-state process. Whereas the kON values remain similar throughout the sequence, the kOFF values differ significantly between the N- and C-terminal portions of c-Myb.
Table S1.
Variants of the subglobal fits to the two-state model in which clusters of residues are constrained to have the same values of kON and kOFF
| Fitted parameter values | Correlation between ΔωFB and ΔδFB | ||||||||||
| Fit type | Global parameters, in addition to cM and cK | Local parameters, in addition to ΔωFB and R20 | No. parameters | Reduced χ2 | Average kON (× 107 M−1⋅s−1) | N-terminal average kOFF, s−1* | C-terminal average kOFF, s−1† | cM | cK | Slope | r‡ |
| 1§ | — | kON, kOFF | 132 | 2.097 | 1.71 ± 0.05 | 16.6 ± 0.7 | 12.7 ± 0.4 | 1.030 | 0.959 | 1.01 ± 0.08 | 0.973 |
| 2a | kON1(290–303), kON2(305–309) | kOFF | 122 | 2.114 | 1.75 ± 0.02 | 16.4 ± 0.6 | 12.8 ± 0.4 | 1.034 | 0.963 | 1.00 ± 0.07 | 0.974 |
| 2b | kON1(290–301), kON2(302–309) | kOFF | 122 | 2.117 | 1.65 ± 0.02 | 16.4 ± 0.6 | 12.8 ± 0.4 | 1.070 | 0.997 | 1.00 ± 0.08 | 0.973 |
| 3 | kON(290–309) | kOFF | 121 | 2.120 | 1.70 ± 0.04 | 16.3 ± 0.6 | 12.8 ± 0.4 | 1.039 | 0.967 | 1.00 ± 0.07 | 0.975 |
| 4a | kOFF1(290–303), kOFF2(305–309) | kON | 122 | 2.154 | 1.70 ± 0.06 | 15.8 ± 0.2 | 12.4 ± 0.2 | 1.037 | 0.966 | 1.01 ± 0.06 | 0.981 |
| 4b | kOFF1(290–301), kOFF2(302–309) | kON | 122 | 2.149 | 1.81 ± 0.06 | 15.8 ± 0.2 | 12.6 ± 0.2 | 1.027 | 0.954 | 0.97 ± 0.07 | 0.975 |
| 5a | kON(290–309), kOFF1(290–303), kOFF2(305–309) | — | 111 | 2.168 | 1.73 ± 0.04 | 15.8 ± 0.2 | 12.5 ± 0.2 | 1.036 | 0.964 | 0.99 ± 0.06 | 0.983 |
| 5b | kON(290–309), kOFF1(290–301), kOFF2(302–309) | — | 111 | 2.167 | 1.80 ± 0.04 | 16.0 ± 0.2 | 12.5 ± 0.2 | 1.021 | 0.950 | 0.97 ± 0.07 | 0.973 |
| 6a | kON1(290–303), kON2(305–309), kOFF1(290–303), kOFF2(305–309) | — | 112 | 2.171 | 1.65 ± 0.04 | 15.8 ± 0.6 | 12.6 ± 0.7 | 1.056 | 0.983 | 1.00 ± 0.06 | 0.981 |
| 6b | kON1(290–301), kON2(302–309), kOFF1(290–301), kOFF2(302–309) | — | 112 | 2.175 | 1.75 ± 0.04 | 16.1 ± 0.7 | 12.6 ± 0.7 | 1.040 | 0.967 | 0.97 ± 0.08 | 0.969 |
| 7 | kOFF(290–309) | kON | 121 | 2.380 | 2.02 ± 0.09 | 13.7 ± 0.1 | 0.989 | 0.917 | 0.93 ± 0.04 | 0.992 | |
| 8 | kON(290–309), kOFF(290–309) | — | 110 | 2.409 | 2.18 ± 0.06 | 13.6 ± 0.1 | 0.960 | 0.889 | 0.91 ± 0.03 | 0.993 | |
kOFF1 or the average of kOFF for residues 290–301.
kOFF2 or the average of kOFF for residues 302–309.
Correlation coefficient.
The results of this type of fit are shown in Fig. 2.
Fig. S7.

Correlation of 15N chemical shift differences of 15N-Myb32 determined from the R2 relaxation dispersion experiments (ΔωN) with equilibrium chemical shift differences of 15N-Myb32 between the free and KIX-bound forms in the presence of MLL28 determined from HSQC spectra (ΔδN). (A) The results obtained by the fits to the induced-fit mechanism (model 2). Fitted parameters are kON = (1.8 ± 0.1) × 107 M−1⋅s−1, kOFF = 15.5 ± 0.3 s−1, Kd = 0.81 ± 0.06 μM, kIB = 0.74 ± 0.09 s−1, kBI = 15.4 ± 0.4 s−1, and a correction factor for the Myb32 concentration = 1.072 ± 0.003. kIB < kBI, indicating that the population of c-Myb in the intermediate state (88%) is much higher than that in the fully bound state (4%), which is unreasonable. The ΔωN values between the free and bound forms obtained by R2 dispersion experiments (red) were significantly larger than ΔδN obtained from equilibrium HSQC. However, the ΔωN values between the free and intermediate forms (blue) were well correlated with ΔδN between the free and bound forms, which is inconsistent. Therefore, the fits to the induced-fit model are unreasonable. (B) The results obtained by the fits to the slow conformational selection mechanism (model 3a). Fitted parameters are kON = (2.1 ± 0.2) × 108 M−1⋅s−1, kOFF = 21.0 ± 0.6 s−1, Kd = 0.7 ± 0.1 μM, kHU = 12,000 ± 1,000 s−1, kUH = 1,900 ± 100 s−1, and a correction factor for the Myb32 concentration = 1.095 ± 0.004. The ΔωN values between the unfolded and helical forms obtained by fitting the R2 dispersion experiments (blue) were significantly larger than ΔδN between the free and bound forms obtained from equilibrium HSQC spectra, suggesting that the conformational ensemble of free c-Myb contains a state that is more highly structured than KIX-bound c-Myb. Therefore, the fits to the conformational selection model 3a are physically unrealistic.
Fig. 5.

Kinetic and structural parameters derived from relaxation dispersion experiments. (A and B) kON (A) and kOFF (B) for c-Myb residues, obtained by fitting to the two-state model. Large characters indicate the 12 residues used in global analysis of the dispersion curves. Error bars show fitting errors. (C) Correlation of 15N chemical shift differences (ΔωFB) for Myb32 determined by fitting the dispersion curves to the two-state model with equilibrium 15N chemical shift differences (ΔδFB) between free Myb32 and the KIX-bound form in the presence of MLL28. The linear regression line (slope = 1.01, y intercept = 0.02, correlation coefficient r = 0.97) is shown. (D) Correlation between the association rate for binding of c-Myb mutants to KIX [data taken from Giri et al. (27)] and the intrinsic population of helix between residues 293 and 303 in the mutant Myb25 peptides predicted by AGADIR (22). Full details are given in SI Text.
Discussion
Upon binding to KIX or to the KIX:MLL complex, residues 293–309 of the intrinsically disordered c-Myb activation domain fold to form a long amphipathic helix with a distinct bend at M303/S304 that enables the side chain of L302 to penetrate deeply into a hydrophobic pocket in the surface of KIX (13, 14). The bend in the bound c-Myb helix forms two helical segments, K293–L301/L302, and L302/M303–L309. Both segments of c-Myb make extensive hydrophobic and electrostatic contacts with KIX (13).
Mechanism of Coupled Folding and Binding of c-Myb.
By adding MLL to suppress secondary c-Myb binding to KIX, we were able to study the mechanism of direct binding of c-Myb to the primary, high-affinity site on KIX without any of the modifications that were introduced in previous stopped-flow kinetics studies (26–28). The 15N R2 relaxation dispersion experiments clearly show that c-Myb binds to KIX by an apparent two-state mechanism, without formation of observable intermediates. Attempts to fit the data to an induced-fit mechanism (model 2) or the slow conformational selection mechanism of model 3a were unsuccessful (Fig. S7).
Because free Myb32 is dynamically disordered, averaging over an ensemble of conformations that includes both helical and more extended states, the effective association and dissociation rates at each residue could vary slightly. The apparent variations in the fitted kON values in Fig. 5A are not statistically significant; the relaxation dispersion data could be fitted well when kON was constrained globally or constrained separately for clusters of residues in the N- and C-terminal segments of the bound c-Myb helix (details in SI Text). We thus conclude that, within our experimental uncertainties, the association rate is the same for all residues. This is not the case, however, for the dissociation rate. Attempts to fit the relaxation dispersion data with a global kOFF value for all residues resulted in a notably poorer fit than that obtained from individual fits (SI Text and Table S1), and it is clear that the effective dissociation rate of residues 302–309 is slightly slower (average 12.7 s−1) than for those in the N-terminal segment of the bent c-Myb helix (average kOFF 16.6 s−1). The fact that the relaxation dispersion data cannot be fitted well using a global kOFF suggests that dissociation may not occur via a global process, in which the entire c-Myb domain dissociates from the surface of KIX in a single step. Rather, dissociation appears to occur by a localized unfolding mechanism, in which local regions of the bent helix unfold and undock at slightly different rates.
In the unbound state, the N- and C-terminal parts of the bent c-Myb helix exhibit different conformational propensities (Fig. 1C). Residues 290–301 have a strong propensity to fold spontaneously into a helical structure, which is 70% populated in free Myb32. In contrast, residues 302–310 have a much smaller propensity to fold in the absence of KIX, with only 20% population of helix in the unbound state. Given the very high population of helix between residues 290 and 301 in the conformational ensemble of free Myb32, it is probable that this region of the peptide docks to KIX predominantly in a folded or partially folded state. Although the population of helix in the N-terminal region of free Myb25 is smaller (∼20% for residues 291–301), substitution of glycine (but not alanine) for E297 or L300, which is predicted by AGADIR (22) to greatly decrease the population of helix in free Myb25 without interfering with c-Myb–KIX contacts in the bound state, results in an ∼10-fold decrease in kON and a large increase in kOFF (27). In contrast, helix-destabilizing glycine substitutions in the C-terminal part of the c-Myb helix have little effect on the Myb25 association rate. Because the binding process is two-state, the NMR dispersion experiments can provide no insights into whether the C-terminal segment of the bent c-Myb helix, which is less structured in free Myb32, folds before or after binding to KIX.
Recent stopped-flow kinetics data are consistent with our NMR relaxation dispersion experiments in showing that binding of c-Myb to KIX occurs by a two-state process, without observable intermediates (26, 28). Binding is extremely fast and appears to exceed the association rate expected for globular proteins of this size (28). Giri et al. (27) have recently applied site-directed mutagenesis (Φ-value analysis) to probe the structure of the transition state for binding of Myb25 to the Y658W mutant of KIX. The transition state possesses a high degree of native-like secondary and tertiary structure, with folding nuclei located in the N- and C-terminal regions of the bent helix.
Based on the observation that the Myb25:KIX association rate is not affected by addition of 5–7% trifluoroethanol, which promotes partial stabilization of helix, and on the basis of an extrapolation of association rates for long and short forms of fluorescently labeled c-Myb, with differing populations of helix, to infinite ionic strength, Gianni et al. (26) and Shammas et al. (29) concluded that the association rate is not correlated with the helical content of free c-Myb and that folding is induced by binding to the surface of KIX. Our relaxation dispersion data suggest that the actual binding and folding mechanism is likely to be more complex. The 70% population of helix in the N-terminal region of free Myb32 implies that the helix will be preformed in a high proportion of c-Myb:KIX encounters, i.e., that folding occurs before binding. In contrast, the C-terminal region of free Myb32 exhibits a much smaller helical propensity (∼20%) and it is likely that folding, which takes place before formation of the transition state (27), occurs after binding to KIX.
Given the high probability that the initial encounter events would involve interactions with helical states of c-Myb, we decided to reexamine the mechanism of c-Myb binding to KIX, using the extensive mutagenesis data of Giri et al. (27) and predictions of the intrinsic helical propensities in the N-terminal region of the various c-Myb mutants. We found a direct (1:1) correlation between the population of helix between residues 293 and 303, predicted by the program AGADIR (22) for the wild-type and mutant Myb25 peptides, and the association rates measured by Giri et al. (27) for binding of Myb25 to KIX (Fig. 5D); an n-fold change in the population of helix corresponds to the same n-fold change in kON. A direct correlation between the association rate and the population of helix in the conformational ensemble of unbound c-Myb is fully consistent with the conformational selection mechanism of our model 3b, in which there is very fast exchange between folded and unfolded states of free c-Myb. The fact that the association rate increases linearly with increasing population of helix in the N-terminal region of c-Myb provides direct evidence that the initial binding event involves folded helical conformers within the free c-Myb conformational ensemble. It is important to note that this conformational selection process involves only the N-terminal region of c-Myb; helix-breaking Gly mutations in the C-terminal region of c-Myb result in an increase in association rates and a change in folding pathways (as indicated by Φ values greater than unity) (27), suggesting an induced-fit folding mechanism for this region.
Comparison with pKID.
The present results clearly show that two different IDPs, pKID and c-Myb, can bind the same site of KIX by different binding mechanisms. pKID binds KIX by an induced-fit mechanism, forming a partly folded intermediate that becomes stabilized by intermolecular interactions formed in the final bound state (10). By contrast, c-Myb binds KIX by an apparent two-state mechanism, in which folding occurs simultaneously with or before binding.
Because the association rates for c-Myb (1.7 × 10⁷ M−1⋅s−1) and pKID (on average, 6.3 × 10⁶ M−1⋅s−1) (10) are similar, it is likely that differences in the folding rates of c-Myb and pKID play a role in determining the binding mechanism. From the present study, the association time constant for Myb32 is ∼80 μs [= 1/ (1.7 × 10⁷ M−1⋅s−1 × 0.7 mM)], indicating that the timescale for c-Myb folding is faster than 80 μs. This is consistent with laser temperature jump studies of helical peptides, which show that formation of helix can occur on a 100-ns timescale (25). Thus, the Myb32 peptide can rapidly sample native-like helical states on a timescale that is much faster than the actual binding event. In contrast to c-Myb, the C-terminal (αB) helix of KIX-bound pKID, which makes the dominant contribution to the free energy of binding (8), has very low intrinsic propensity to form helix and is largely unstructured in the free KID or pKID peptides (Fig. S8) (9). The αB helix remains only partly folded in the pKID:KIX binding intermediate and folds into the helical structure of the fully bound state at a rate that is slow compared with the rate of association of pKID with KIX (10). In contrast, the αA helix of pKID, which spontaneously forms ∼50% population of helix in the free peptide (9), is fully folded in the pKID:KIX intermediate. It appears that differences in the helical propensities of pKID and c-Myb may be primary determinants of the folding rate and thus the binding mechanism. We suggest that the very weak helical propensity of the αB region of pKID may present a barrier to folding and that formation and stabilization of helical structure in this region may require establishment of favorable intermolecular interactions after docking to the surface of KIX.
Fig. S8.

(A and B) Helicities of the TADs of c-Myb (A) and pKID (B) predicted by AGADIR (22) at 303 K and 288 K, respectively. (C and D) Deviations of 13Cα (red) and 13C′ (blue) chemical shifts from sequence-corrected (19) random coil shifts for intrinsically disordered proteins (20), applied to Myb32 (C, chemical shifts at 303 K) and pKID (D, chemical shifts at 288 K) (9). The predicted population of helix between residues 290 and 301 of Myb32 (66%) is in close agreement with experiment (70%, estimated from 13Cα and 13C′ shifts). For pKID, the population of helix between residues 117 and 129 (spanning helix αA of pKID bound to KIX) (6) estimated from the secondary chemical shifts is 46%. Residues 133–144 (helix αB of bound pKID) have no measurable propensity to adopt regular helical structure in the free pKID.
The differing propensities for spontaneous helix formation by pKID and c-Myb appear to be closely related to their functions. CREB is an inducible transcriptional activator that requires phosphorylation of S133 in the KID domain for high-affinity binding to KIX. The high degree of disorder and low propensity for secondary structure formation in the αB region and in the vicinity of S133 of KID are expected to facilitate interaction with and phosphorylation by protein kinase A (8), which binds peptide substrates in a relatively extended conformation (30). On the other hand, c-Myb is a constitutive transcriptional activator, which does not require posttranslational modification for high-affinity binding to KIX, and its strong propensity for helix formation may be advantageous for rapid activation of Myb-mediated transcriptional programs. There is growing evidence that the intrinsic helical propensity of an IDP is finely tuned by the sequence and is an important determinant of both its biological function and its binding affinity and mechanism. This has been recently demonstrated most elegantly for the disordered activation domain of p53, where mutations that increase the population of preformed helical structure alter the dynamics of p53 accumulation and impair the p53 response to DNA damage (31). Likewise, mutations that decrease the helical propensity of a linker region in the p27 cyclin-dependent kinase inhibitor impair its ability to promote cell cycle arrest (32).
Because IDPs vary greatly in their conformational propensities, it is not surprising that they do not use a common mechanism for binding and folding and that both conformational selection and induced-fit mechanisms, or a combination of both, have been observed for binding of various IDPs to their targets. The transition state for binding of c-Myb to KIX differs from those of other IDPs that have been studied to date in that Φ values and linear free energy relationships show that near-native secondary and tertiary structure has already formed at the top of the rate-limiting energy barrier (27). In contrast, the transition states for binding and folding of S peptide to S protein (33), the IDP PUMA to its MCL-1 target (34), and the activation domain of ACTR to the nuclear coactivator binding domain (NCBD) of CBP (35) are located early in the binding pathway; folding of the IDP and formation of native intermolecular interactions occur after the rate-limiting step for binding, i.e., by an induced-fit mechanism. Whereas native-like ACTR–NCBD interactions are mostly formed late in the reaction pathway, mutations that increase the propensity for spontaneous helix formation in the N-terminal region of ACTR accelerate binding by a conformational selection mechanism (36). Thus, the ACTR–NCBD interaction is complex: Different regions of the intrinsically disordered ACTR bind and fold by different pathways, consistent with computer simulations (37). It seems likely that the involvement of both conformational selection and induced fit will emerge as a common framework for binding and folding processes of all but the simplest IDPs.
NMR relaxation dispersion experiments provide atomic resolution insights into IDP binding and folding mechanisms that complement conventional kinetics measurements. Whereas binding and folding of c-Myb occur by a two-state process (this work), dispersion experiments show that both pKID and the disordered NTAIL domain from Sendai virus nucleoprotein associate with their target proteins (KIX and the phosphoprotein PX, respectively) by three-state mechanisms involving formation of an intermediate (10, 18). Whereas NTAIL binds rapidly to PX to form a dynamic encounter complex, with a preformed helical state of free NTAIL docked to PX, native intermolecular interactions develop more slowly at a rate that is determined by motions of a helical groove on the surface of PX itself (18).
In conclusion, the available kinetics and NMR data show clearly that coupled folding and binding reactions of IDPs do not obey a single, general mechanism. Rather, binding occurs by a variety of mechanisms, depending on the conformational propensities of the IDPs themselves, as well as the intrinsic conformational dynamics of their target proteins (18).
Materials and Methods
Protein Expression and Purification.
Details for the preparation of Myb32 are given in SI Text. Myb25, MLL28, and the KIX domain (residues 586–672) of mouse CBP were prepared as described previously (6, 8, 13, 14, 23).
CD, ITC, and NMR Measurements.
Full details of the CD, ITC, and NMR measurements are given in SI Text. 15N R2 relaxation dispersion data were acquired at 30 °C, using relaxation-compensated constant-time Carr–Purcell–Meiboom–Gill (CPMG) pulse sequences (10, 38) with a constant relaxation delay of 40 ms or 60 ms.
SI Text
Protein Expression and Purification.
Myb32 (mouse, residues 284–315) was expressed in Escherichia coli as a fusion with the B1 domain of protein G and purified using a Ni-NTA column. The fusion protein was cleaved on column using thrombin and Myb32 was separated using reverse-phase HPLC. The resulting protein (GYNDEDPEKEKRIKELELLLMSTENELKGQQAL) contains an additional Gly at the N terminus.
CD Measurement.
CD spectra of Myb32 and Myb25 (100 μM) were measured on an Aviv 62DS spectropolarimeter at 30 °C in 20 mM Tris-acetate buffer (pH 7.0) containing 50 mM NaCl.
ITC Measurement.
Titrations of Myb32 (0.8 mM or 0.6 mM) into KIX (45 μM) in the presence or absence of MLL28 (90 μM) were performed at 30 °C, using a MicroCal Omega VP-ITC instrument as previously described (12, 23). Samples were prepared in 20 mM Tris-acetate (pH 7.0) and 50 mM NaCl. Typically, two injections of 5 μL were followed by 28 injections of 10 μL until a molar ratio of 3.0–5.0 was obtained. The dilution heats are typically small and were subtracted from the calorimetric data. Integration of the thermogram and subtraction of the blanks yielded a binding isotherm that was fitted to a one-site binding model using the MicroCal Origin software or to a two-site binding model using an in-house fitting program to determine the stoichiometric ratios, N1 and N2, the dissociation constants, Kd1 and Kd2, and the changes in enthalpy of the interaction, ΔH1 and ΔH2, for the primary and secondary binding, respectively. To improve fits, correction for protein concentration was implemented in the fitting program (24). The change in entropy, ΔS, was then calculated according to Eq. S1,
| [S1] |
where R is the gas constant, T is the absolute temperature, and ΔG is the free energy change from the free to the bound form. All experiments were performed in duplicate.
NMR Measurement.
NMR spectra were recorded using Bruker 500-, 600-, and 800-MHz spectrometers and analyzed using NMRPipe (39) and NMRView (40). Backbone resonances of free Myb32 and the KIX domain in complex with Myb32 at a 1:1 ratio were assigned using standard 3D NMR experiments with 500 μM 13C,15N-labeled protein in 20 mM Tris-d11-acetate-d4 (pH 7.0), 50 mM NaCl, 2 mM NaN3, and 10% (vol/vol) D2O at 30 °C. Backbone resonances of Myb32 in complex with KIX at a 1:1 ratio in the presence of MLL28 were assigned using 1H-15N HSQC, 15N TOCSY-HSQC, and 15N NOESY-HSQC spectra.
15N R2 relaxation dispersion data were acquired on Bruker 500- and 800-MHz spectrometers, using relaxation-compensated constant-time Carr–Purcell–Meiboom–Gill (CPMG) pulse sequences (10, 38) with a constant relaxation delay of 40 ms or 60 ms. Errors in R2 were estimated from duplicate measurements (10). The samples contained 20 mM Tris-d11-acetate-d4 (pH 7.0), 50 mM NaCl, 2 mM NaN3, 10% (vol/vol) D2O, 0.7 mM Myb32, 0.665–0.77 mM KIX, and 1.33–1.54 mM MLL28. The weighted average 15N/1H chemical shift change was calculated as (24).
Binding Simulations in the Absence of MLL.
When the number of Myb32 binding sites on KIX is two, the binding can be described by an independent two-site binding model as shown below (24):
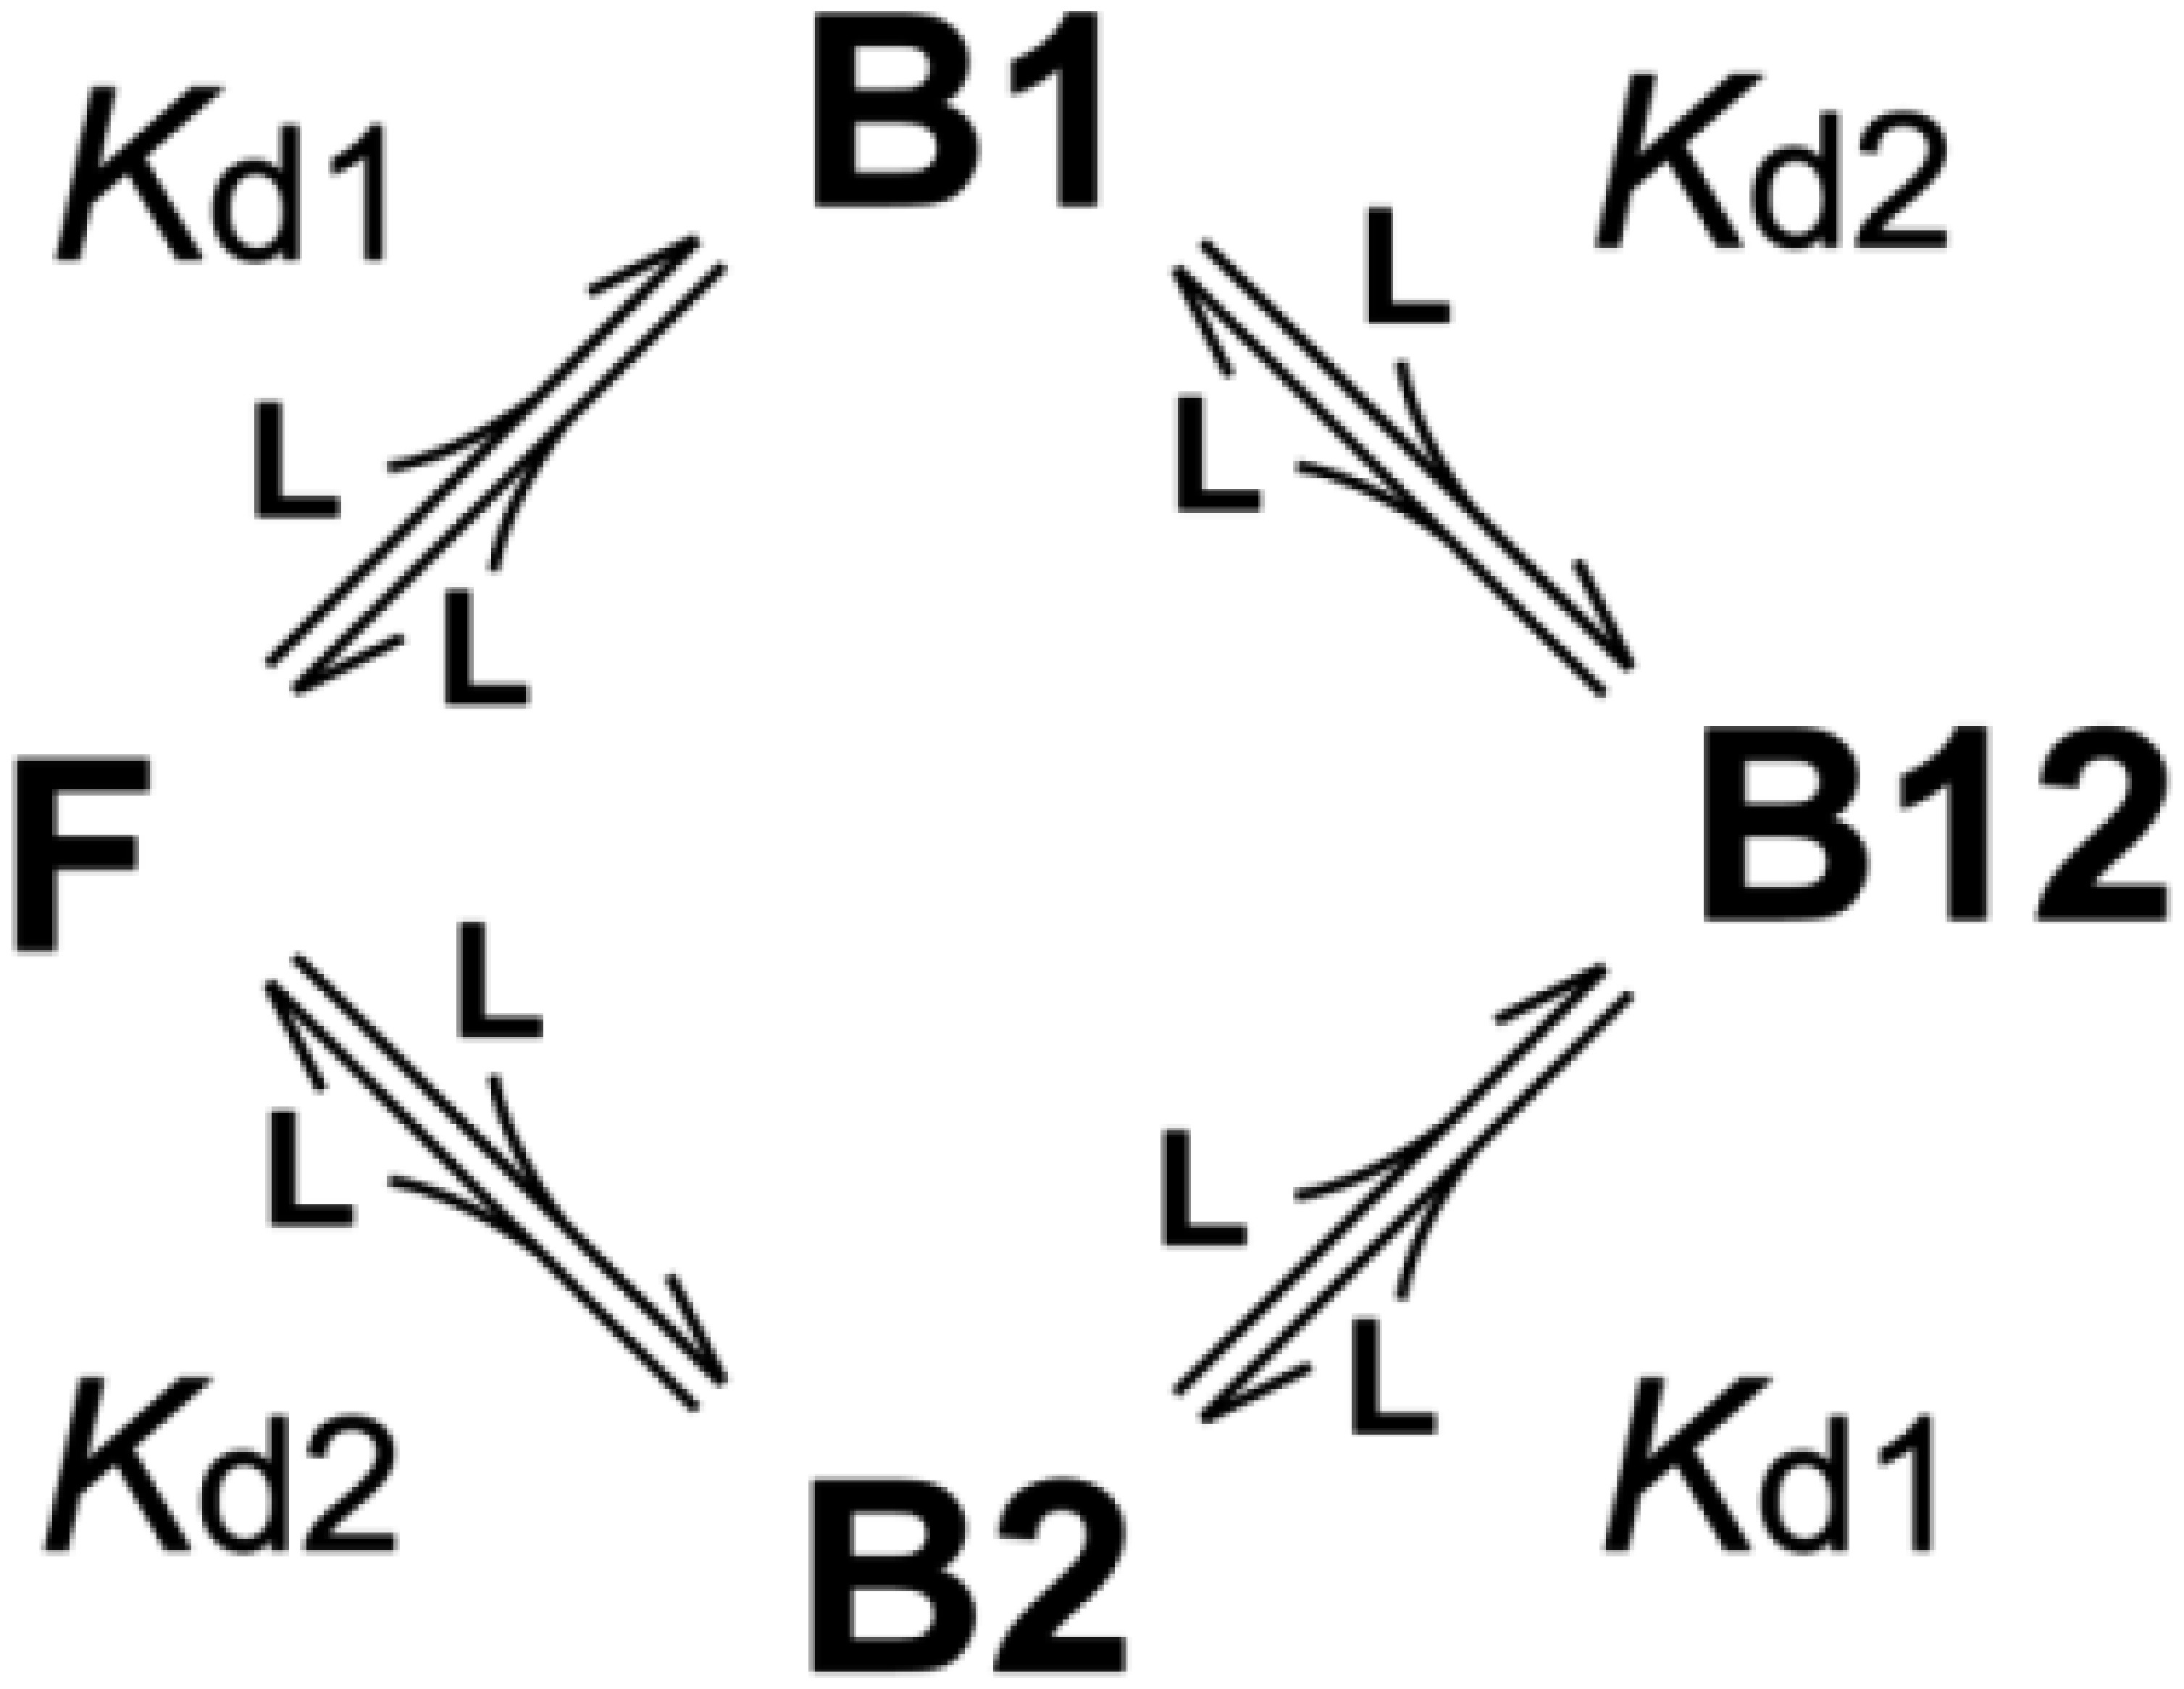
If Kd1 and Kd2 are known, the fractions of the F, B1, B2, and B12 forms, fF, fB1, fB2, and fB12, respectively, are calculated, using Kd1 of 0.213 μM and Kd2 of 46 μM, as
where [L] is the concentration of the free form of Myb32, which is a solution of the cubic equation
| [S2] |
where [P]tot and [L]tot are the total concentrations of KIX and Myb32, respectively (24). The closed-form solution of Eq. S2 has been reported (41),
where
There are three Myb32 species; the free form (C0), Myb32 bound to the primary site (C1), and Myb32 bound to the secondary site (C2). The concentrations of these species, [C0], [C1], and [C2], respectively, are obtained as
which are shown in Fig. S4 A–C.
Binding Simulations in the Presence of MLL.
When MLL28 was added to the Myb32:KIX complex, the binding model is described as shown below:
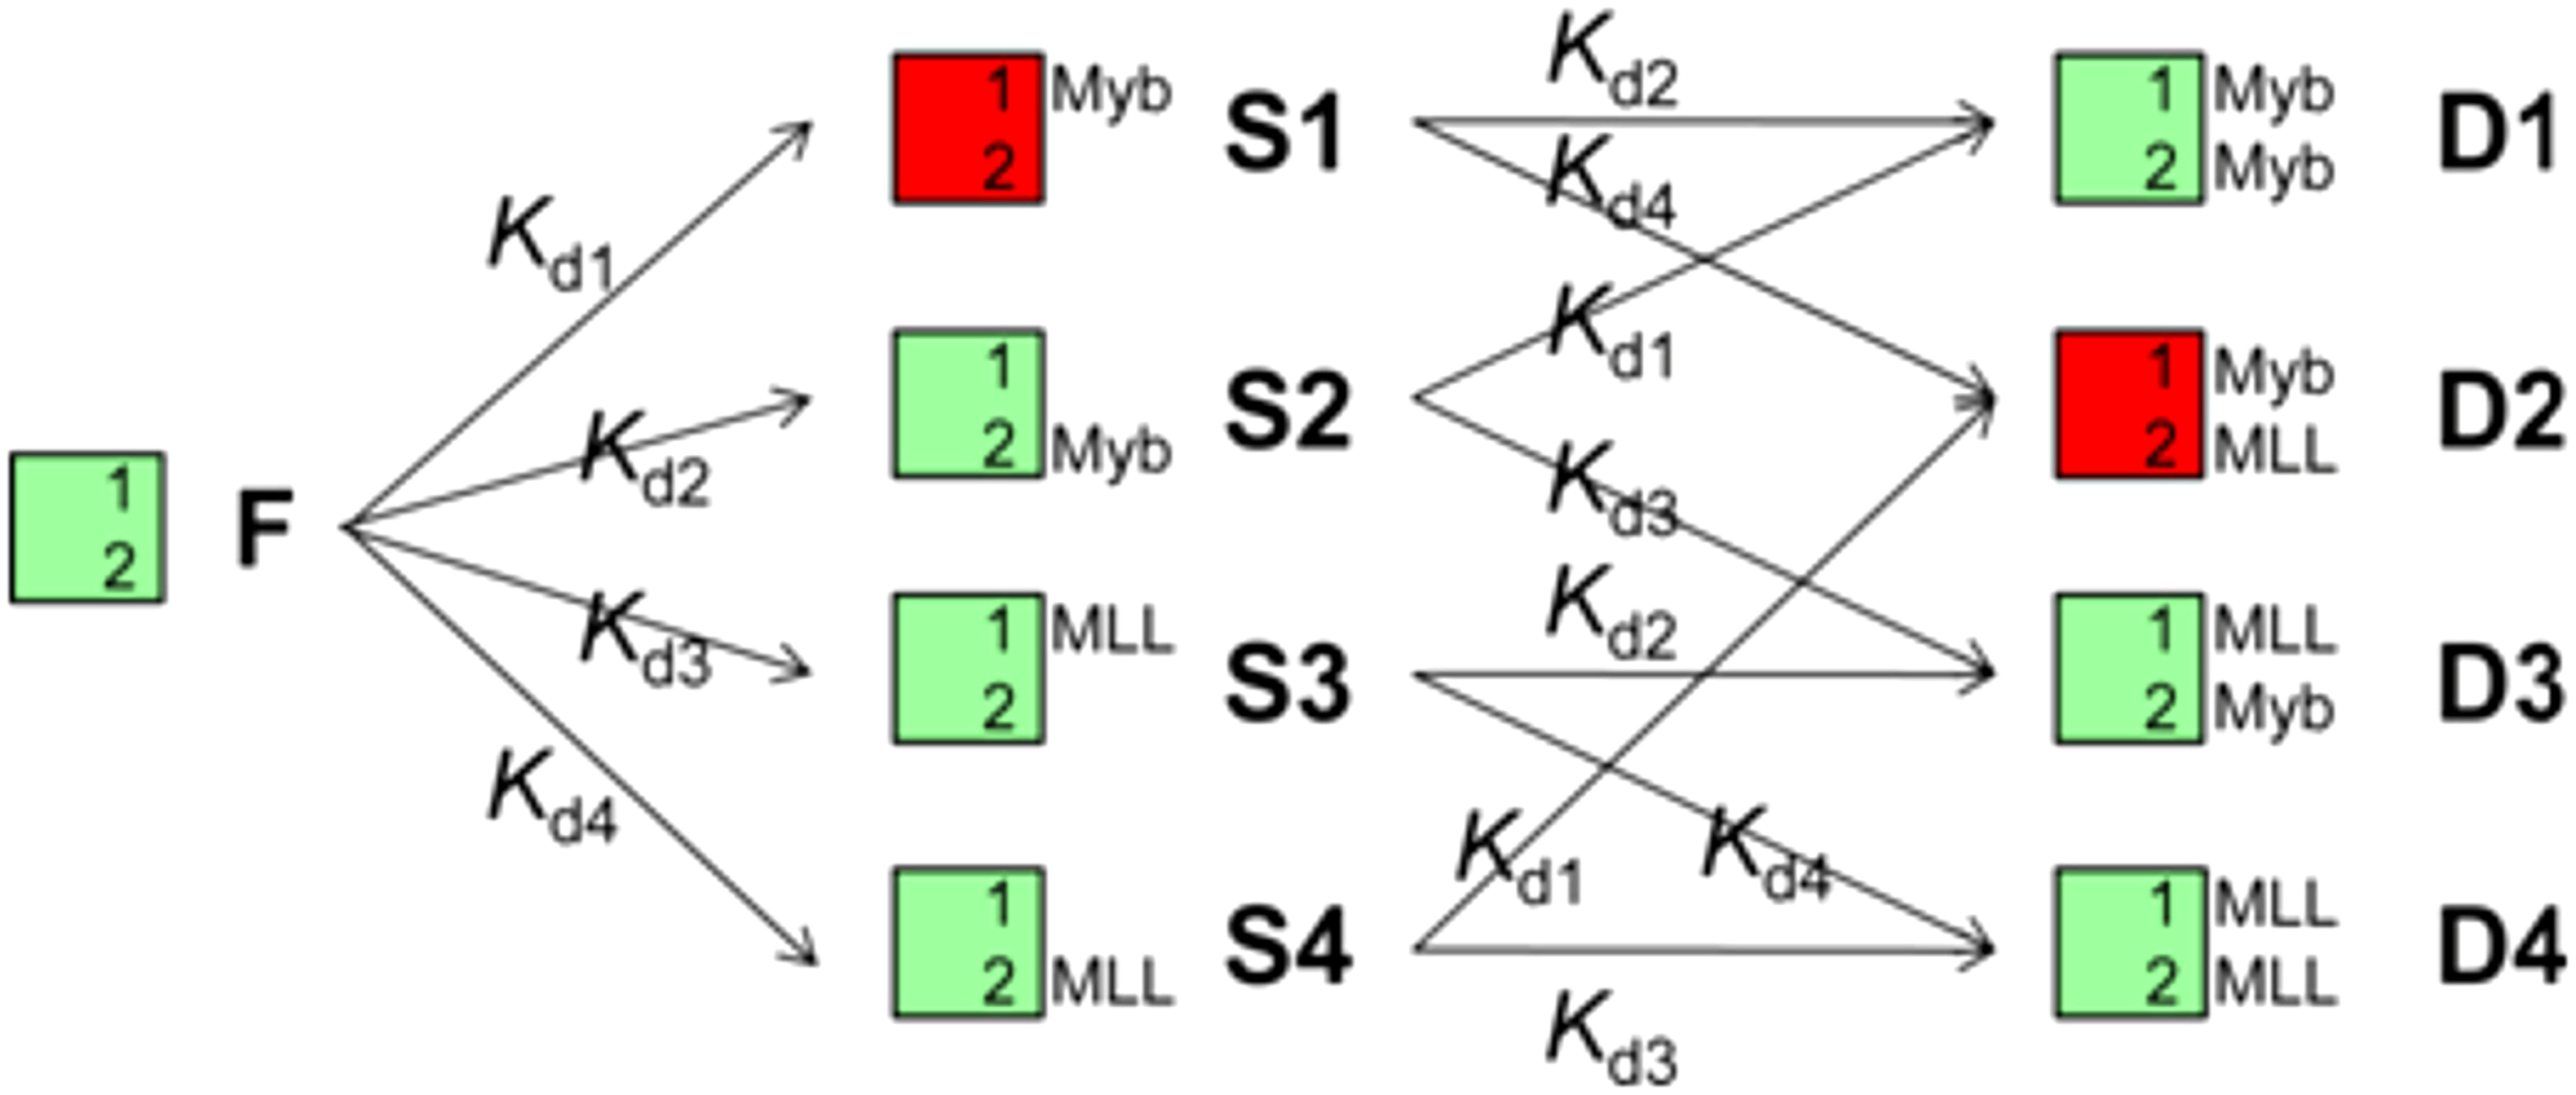
Here, the following equations hold,
where [KIX]tot, [Myb32]tot, and [MLL28]tot are the total concentrations of KIX, Myb32, and MLL28, respectively; C is the free Myb32 concentration; M is the free MLL28 concentration; and F, S1–S4, and D1–D4 denote the concentrations of the corresponding forms. By solving these simultaneous equations using the Newton–Raphson method (42), the concentrations (fractions) of various KIX, Myb32, and MLL28 forms are obtained. Here, we used the following numbers: Kd1 and Kd2 are 0.213 µM and 46 µM, respectively, and Kd3 and Kd4 are 2.1 µM and 920 µM, respectively, as determined previously (23).
The concentrations of three Myb32 species were calculated as
Similarly, there are three MLL28 species: the free form (M0), MLL28 bound to the primary site (M1), and MLL28 bound to the secondary site (M2). The concentrations of these species, [M0], [M1], and [M2], respectively, are obtained as
which are shown in Fig. S4 D–G. To study the direct binding of Myb32 to the primary, high-affinity site on KIX, it is desirable to observe only the S1 and D2 forms, in which Myb32 binds only to the primary site.
Analysis of R2 Relaxation Dispersion Data.
The R2 relaxation dispersion data were analyzed using the fortran version of the in-house fitting program GLOVE (43), named GLOVEf. The fitting equation for the two-state model (including both models 1 and 3b) is
where
where is an intrinsic relaxation rate, [KIX] is the concentration of free KIX, kON and kOFF are the association and dissociation rates, respectively, τCP is the interval between 180° pulses in CPMG pulse sequences, and ΔωFB is the chemical shift difference between the free and bound forms (44).
The fitting equation for the induced-fit model (model 2) and the conformational selection model (model 3a) is
where λ1 is the largest eigenvalue of the matrix
where Re[ ] and Im[ ] are functions to extract the real or imaginary elements, respectively, of the complex matrix (10). A is a 3 × 3 evolution matrix, and A* is its complex conjugate. For the induced-fit model,
where kIB and kBI are the folding and unfolding rate constants between the intermediate and bound forms, respectively, and ΔωFI is the chemical shift difference between the free and intermediate forms. For the conformational selection model,
where kUH and kHU are the folding and unfolding rate constants between the unfolded and helical forms, respectively, and ΔωUH and ΔωUB are the chemical shift difference between the unfolded and helical forms and between the unfolded and bound forms, respectively.
The free KIX concentration is obtained by
where cK and cM are correction factors for [KIX]tot and [Myb32]tot, respectively. For the two-state model,
for the induced-fit model,
and for the conformational selection model,
The fitting parameters are , kON, kOFF, ΔωFB, cK, and cM for all three models and, in addition, kIB, kBI, and ΔωFI for the induced-fit model and kUH, kHU, and ΔωUH for the conformational selection model.
Fitting Procedures.
In the present study, 8 dispersion curves (four concentration ratios at two magnetic fields) were obtained for each residue, and each curve contained 17 data points. Because 12 residues show smooth dispersion curves, a total of 96 dispersion curves containing 1,632 data points were used for data analysis. Fits to the above fitting equations were done by the nonlinear least-squares method. There are three types of fitting as follows:
Local fit: Dispersion curves for only one residue (8 curves) are globally fitted with common rate constants and common chemical shift differences. is a local parameter for each curve. Correction for protein concentrations was not done (cK and cM were fixed to 1).
Full global fit: Dispersion curves for all residues (96 curves) are globally fitted with common rate constants and common correction factors for protein concentrations. Chemical shift differences are common for the curves of the same residue. is a local parameter for each curve.
Subglobal fit: Dispersion curves for all residues (96 curves) are globally fitted with a common correction factor(s) for protein concentration(s). All rate constants and chemical shift differences are common for the curves of the same residue. is a local parameter for each curve.
The nonlinear least-squares fitting requires good estimates of initial values. Therefore, many fitting runs were carried out from various initial parameter values (grid search). Then, the best fit was selected, that is, the fit with a small reduced χ2, which indicates the goodness of fit, and with reasonable parameter sets.
We initially performed local fits for each residue and searched for the best fit by a grid search. Then, the median of the rate constants obtained for all residues was calculated and was used as an initial value for the subsequent full global fit. In the full global fit, a grid search around the medians of local fits was performed. If the full global fit gives a reasonable fit, a subglobal fit was performed, in which only a correction factor(s) for protein concentration(s) is a global parameter(s). Here, the results of the full global fit were used as initial parameter values, and the random and Monte Carlo minimizations were performed as described previously (43). Fitting errors were obtained by a covariance matrix. Finally, we checked whether the fitted results fulfill the following: The Kd value obtained by fitted rate constants is close to the Kd obtained by ITC, the population of the bound form is larger than that of the free and intermediate forms, and the bound form is more structured than other forms.
After the full global fits, we found that only the two-state model gives reasonable fits (main text and Fig. S7). Therefore, the subglobal fits were performed only for the two-state model. To obtain accurate estimates of correction factors for protein concentrations, cM and cK, in the subglobal fits to the two-state model, we performed a grid search by slightly changing the fixed cM and cK values. Here, cM and cK were fixed in each fit of the grid search, because fitting was unstable if both parameters were set as variables. The parameters obtained in the best fit among the grid searches are shown in the main text and in Fig. 5 (cM = 1.030; cK = 0.959).
The apparent variation in kON for different residues (Fig. 5A) is not statistically significant. On the other hand, residues L302, T305, N307, E308, and L309 in the C-terminal part of the c-Myb helix have lower than average values of kOFF (Fig. 5B); the average kOFF is 12.7 ± 0.4 (SE) for residues 302–309 and 16.6 ± 0.6 for residues 290–301. Several variants of the two-state fits were performed in which clusters of residues were constrained to have the same values of kON and kOFF. The results of these fits are given in Table S1. The best fits were obtained when kON and kOFF were allowed to vary independently for each residue or when kON was constrained globally (for residues 290–309) or constrained separately for clusters of residues in the N- and C-terminal regions of c-Myb. In all such fits, lower than average dissociation rates were observed consistently for the C-terminal residues. However, fits in which kOFF was constrained to a global value or constrained for separate clusters of residues in the N-terminal and C-terminal regions were noticeably poorer, as judged by χ2 (Table S1).
Data Treatment for Fig. 5D.
The correlation between the association rates of Giri et al. (27) and the predicted percentage of helix according to the program AGADIR (22) is valid only for some of the mutation sites. The association rates of the Lys/Ala, Lys/Gly, and Arg/Ala mutant peptides are systematically lower than wild type by an average 1.85 (± 0.31) μM−1⋅s−1, presumably because of the reduction in charge. In the complex, these residues, especially K293 and R294, are close to a negatively charged patch on the surface of KIX. The rates for the K293A, K293G, R294A, and K296A peptides were therefore corrected, kON = kON(obs) + 1.85 μM−1⋅s−1 (Fig. 5D, green triangles). All other rates are as in table 1 of Giri et al. (27) (Fig. 5D, red circles). The line (slope = 0.2, R2 = 0.85) is a linear least-squares fit of all data except L300A and L301A. These latter mutants, which bind faster than wild type and have negative Φ values, are clear outliers (Fig. 5D, black circles) and were excluded from the least-squares fit. It should be noted that the slope is unchanged and the correlation coefficient is improved (R2 = 0.94) if the Lys and Arg mutants are also excluded. The linear correlation between association rate and predicted helicity is robust and is also observed when the population of helix is predicted for mutant Myb25 peptides with the N terminus acetylated (R2 = 0.82) or preceded by Gly residues (R2 = 0.86) to mimic the fusion protein used by Giri et al. (27) for stopped-flow kinetics.
Acknowledgments
We thank Maria Martinez-Yamout for assistance with sample preparation and Gerard Kroon for NMR measurements. This work was supported by Grant CA096865 from the National Institutes of Health and by the Skaggs Institute for Chemical Biology. M.A. was supported by Grants-in-Aid for Scientific Research from the Ministry of Education, Culture, Sports, Science, and Technology of Japan; by the Kurata Memorial Hitachi Science and Technology Foundation; by the Sumitomo Foundation; by the Asahi Glass Foundation; and by Precursory Research for Embryonic Science and Technology, Japan Science and Technology Agency.
Footnotes
The authors declare no conflict of interest.
This article contains supporting information online at www.pnas.org/lookup/suppl/doi:10.1073/pnas.1512799112/-/DCSupplemental.
References
- 1.Wright PE, Dyson HJ. Intrinsically unstructured proteins: Re-assessing the protein structure-function paradigm. J Mol Biol. 1999;293(2):321–331. doi: 10.1006/jmbi.1999.3110. [DOI] [PubMed] [Google Scholar]
- 2.Dunker AK, et al. Intrinsically disordered protein. J Mol Graph Model. 2001;19(1):26–59. doi: 10.1016/s1093-3263(00)00138-8. [DOI] [PubMed] [Google Scholar]
- 3.Uversky VN. Natively unfolded proteins: A point where biology waits for physics. Protein Sci. 2002;11(4):739–756. doi: 10.1110/ps.4210102. [DOI] [PMC free article] [PubMed] [Google Scholar]
- 4.Dyson HJ, Wright PE. Intrinsically unstructured proteins and their functions. Nat Rev Mol Cell Biol. 2005;6(3):197–208. doi: 10.1038/nrm1589. [DOI] [PubMed] [Google Scholar]
- 5.Wright PE, Dyson HJ. Linking folding and binding. Curr Opin Struct Biol. 2009;19(1):31–38. doi: 10.1016/j.sbi.2008.12.003. [DOI] [PMC free article] [PubMed] [Google Scholar]
- 6.Radhakrishnan I, et al. Solution structure of the KIX domain of CBP bound to the transactivation domain of CREB: A model for activator:coactivator interactions. Cell. 1997;91(6):741–752. doi: 10.1016/s0092-8674(00)80463-8. [DOI] [PubMed] [Google Scholar]
- 7.Parker D, et al. Phosphorylation of CREB at Ser-133 induces complex formation with CREB-binding protein via a direct mechanism. Mol Cell Biol. 1996;16(2):694–703. doi: 10.1128/mcb.16.2.694. [DOI] [PMC free article] [PubMed] [Google Scholar]
- 8.Zor T, Mayr BM, Dyson HJ, Montminy MR, Wright PE. Roles of phosphorylation and helix propensity in the binding of the KIX domain of CREB-binding protein by constitutive (c-Myb) and inducible (CREB) activators. J Biol Chem. 2002;277(44):42241–42248. doi: 10.1074/jbc.M207361200. [DOI] [PubMed] [Google Scholar]
- 9.Radhakrishnan I, Pérez-Alvarado GC, Dyson HJ, Wright PE. Conformational preferences in the Ser133-phosphorylated and non-phosphorylated forms of the kinase inducible transactivation domain of CREB. FEBS Lett. 1998;430(3):317–322. doi: 10.1016/s0014-5793(98)00680-2. [DOI] [PubMed] [Google Scholar]
- 10.Sugase K, Dyson HJ, Wright PE. Mechanism of coupled folding and binding of an intrinsically disordered protein. Nature. 2007;447(7147):1021–1025. doi: 10.1038/nature05858. [DOI] [PubMed] [Google Scholar]
- 11.Goodman RH, Smolik S. CBP/p300 in cell growth, transformation, and development. Genes Dev. 2000;14(13):1553–1577. [PubMed] [Google Scholar]
- 12.Goto NK, Zor T, Martinez-Yamout M, Dyson HJ, Wright PE. Cooperativity in transcription factor binding to the coactivator CREB-binding protein (CBP). The mixed lineage leukemia protein (MLL) activation domain binds to an allosteric site on the KIX domain. J Biol Chem. 2002;277(45):43168–43174. doi: 10.1074/jbc.M207660200. [DOI] [PubMed] [Google Scholar]
- 13.Zor T, De Guzman RN, Dyson HJ, Wright PE. Solution structure of the KIX domain of CBP bound to the transactivation domain of c-Myb. J Mol Biol. 2004;337(3):521–534. doi: 10.1016/j.jmb.2004.01.038. [DOI] [PubMed] [Google Scholar]
- 14.De Guzman RN, Goto NK, Dyson HJ, Wright PE. Structural basis for cooperative transcription factor binding to the CBP coactivator. J Mol Biol. 2006;355(5):1005–1013. doi: 10.1016/j.jmb.2005.09.059. [DOI] [PubMed] [Google Scholar]
- 15.Oh IH, Reddy EP. The myb gene family in cell growth, differentiation and apoptosis. Oncogene. 1999;18(19):3017–3033. doi: 10.1038/sj.onc.1202839. [DOI] [PubMed] [Google Scholar]
- 16.Parker D, et al. Role of secondary structure in discrimination between constitutive and inducible activators. Mol Cell Biol. 1999;19(8):5601–5607. doi: 10.1128/mcb.19.8.5601. [DOI] [PMC free article] [PubMed] [Google Scholar]
- 17.Palmer AG, 3rd, Kroenke CD, Loria JP. Nuclear magnetic resonance methods for quantifying microsecond-to-millisecond motions in biological macromolecules. Methods Enzymol. 2001;339:204–238. doi: 10.1016/s0076-6879(01)39315-1. [DOI] [PubMed] [Google Scholar]
- 18.Schneider R, et al. Visualizing the molecular recognition trajectory of an intrinsically disordered protein using multinuclear relaxation dispersion NMR. J Am Chem Soc. 2015;137(3):1220–1229. doi: 10.1021/ja511066q. [DOI] [PubMed] [Google Scholar]
- 19.Schwarzinger S, et al. Sequence-dependent correction of random coil NMR chemical shifts. J Am Chem Soc. 2001;123(13):2970–2978. doi: 10.1021/ja003760i. [DOI] [PubMed] [Google Scholar]
- 20.Tamiola K, Acar B, Mulder FAA. Sequence-specific random coil chemical shifts of intrinsically disordered proteins. J Am Chem Soc. 2010;132(51):18000–18003. doi: 10.1021/ja105656t. [DOI] [PubMed] [Google Scholar]
- 21.Yao J, Chung J, Eliezer D, Wright PE, Dyson HJ. NMR structural and dynamic characterization of the acid-unfolded state of apomyoglobin provides insights into the early events in protein folding. Biochemistry. 2001;40(12):3561–3571. doi: 10.1021/bi002776i. [DOI] [PubMed] [Google Scholar]
- 22.Muñoz V, Serrano L. Elucidating the folding problem of helical peptides using empirical parameters. Nat Struct Biol. 1994;1(6):399–409. doi: 10.1038/nsb0694-399. [DOI] [PubMed] [Google Scholar]
- 23.Arai M, Dyson HJ, Wright PE. Leu628 of the KIX domain of CBP is a key residue for the interaction with the MLL transactivation domain. FEBS Lett. 2010;584(22):4500–4504. doi: 10.1016/j.febslet.2010.10.024. [DOI] [PMC free article] [PubMed] [Google Scholar]
- 24.Arai M, Ferreon JC, Wright PE. Quantitative analysis of multisite protein-ligand interactions by NMR: Binding of intrinsically disordered p53 transactivation subdomains with the TAZ2 domain of CBP. J Am Chem Soc. 2012;134(8):3792–3803. doi: 10.1021/ja209936u. [DOI] [PMC free article] [PubMed] [Google Scholar]
- 25.Ferguson N, Fersht AR. Early events in protein folding. Curr Opin Struct Biol. 2003;13(1):75–81. doi: 10.1016/s0959-440x(02)00009-x. [DOI] [PubMed] [Google Scholar]
- 26.Gianni S, Morrone A, Giri R, Brunori M. A folding-after-binding mechanism describes the recognition between the transactivation domain of c-Myb and the KIX domain of the CREB-binding protein. Biochem Biophys Res Commun. 2012;428(2):205–209. doi: 10.1016/j.bbrc.2012.09.112. [DOI] [PubMed] [Google Scholar]
- 27.Giri R, Morrone A, Toto A, Brunori M, Gianni S. Structure of the transition state for the binding of c-Myb and KIX highlights an unexpected order for a disordered system. Proc Natl Acad Sci USA. 2013;110(37):14942–14947. doi: 10.1073/pnas.1307337110. [DOI] [PMC free article] [PubMed] [Google Scholar]
- 28.Shammas SL, Travis AJ, Clarke J. Remarkably fast coupled folding and binding of the intrinsically disordered transactivation domain of cMyb to CBP KIX. J Phys Chem B. 2013;117(42):13346–13356. doi: 10.1021/jp404267e. [DOI] [PMC free article] [PubMed] [Google Scholar]
- 29.Shammas SL, Travis AJ, Clarke J. Allostery within a transcription coactivator is predominantly mediated through dissociation rate constants. Proc Natl Acad Sci USA. 2014;111(33):12055–12060. doi: 10.1073/pnas.1405815111. [DOI] [PMC free article] [PubMed] [Google Scholar]
- 30.Taylor SS, et al. Dynamics of signaling by PKA. Biochim Biophys Acta. 2005;1754(1–2):25–37. doi: 10.1016/j.bbapap.2005.08.024. [DOI] [PubMed] [Google Scholar]
- 31.Borcherds W, et al. Disorder and residual helicity alter p53-Mdm2 binding affinity and signaling in cells. Nat Chem Biol. 2014;10(12):1000–1002. doi: 10.1038/nchembio.1668. [DOI] [PubMed] [Google Scholar]
- 32.Otieno S, Kriwacki R. Probing the role of nascent helicity in p27 function as a cell cycle regulator. PLoS One. 2012;7(10):e47177. doi: 10.1371/journal.pone.0047177. [DOI] [PMC free article] [PubMed] [Google Scholar]
- 33.Bachmann A, Wildemann D, Praetorius F, Fischer G, Kiefhaber T. Mapping backbone and side-chain interactions in the transition state of a coupled protein folding and binding reaction. Proc Natl Acad Sci USA. 2011;108(10):3952–3957. doi: 10.1073/pnas.1012668108. [DOI] [PMC free article] [PubMed] [Google Scholar]
- 34.Rogers JM, et al. Interplay between partner and ligand facilitates the folding and binding of an intrinsically disordered protein. Proc Natl Acad Sci USA. 2014;111(43):15420–15425. doi: 10.1073/pnas.1409122111. [DOI] [PMC free article] [PubMed] [Google Scholar]
- 35.Dogan J, Mu X, Engström Å, Jemth P. The transition state structure for coupled binding and folding of disordered protein domains. Sci Rep. 2013;3:2076. doi: 10.1038/srep02076. [DOI] [PMC free article] [PubMed] [Google Scholar]
- 36.Iešmantavičius V, Dogan J, Jemth P, Teilum K, Kjaergaard M. Helical propensity in an intrinsically disordered protein accelerates ligand binding. Angew Chem Int Ed Engl. 2014;53(6):1548–1551. doi: 10.1002/anie.201307712. [DOI] [PubMed] [Google Scholar]
- 37.Zhang W, Ganguly D, Chen J. Residual structures, conformational fluctuations, and electrostatic interactions in the synergistic folding of two intrinsically disordered proteins. PLoS Comput Biol. 2012;8(1):e1002353. doi: 10.1371/journal.pcbi.1002353. [DOI] [PMC free article] [PubMed] [Google Scholar]
- 38.Loria JP, Rance M, Palmer AG., III A relaxation-compensated Carr-Purcell-Meiboom-Gill sequence for characterizing chemical exchange by NMR spectroscopy. J Am Chem Soc. 1999;121:2331–2332. [Google Scholar]
- 39.Delaglio F, et al. NMRPipe: A multidimensional spectral processing system based on UNIX pipes. J Biomol NMR. 1995;6(3):277–293. doi: 10.1007/BF00197809. [DOI] [PubMed] [Google Scholar]
- 40.Johnson BA, Blevins RA. NMR View: A computer program for the visualization and analysis of NMR data. J Biomol NMR. 1994;4(5):603–614. doi: 10.1007/BF00404272. [DOI] [PubMed] [Google Scholar]
- 41.Wang ZX, Jiang RF. A novel two-site binding equation presented in terms of the total ligand concentration. FEBS Lett. 1996;392(3):245–249. doi: 10.1016/0014-5793(96)00818-6. [DOI] [PubMed] [Google Scholar]
- 42.Press WH, Flannery BP, Teukolsky SA, Vetterling WT. Numerical Recipes in Fortran 77. The Art of Scientific Computing. Cambridge Univ Press; Cambridge, UK: 1992. [Google Scholar]
- 43.Sugase K, Konuma T, Lansing JC, Wright PE. Fast and accurate fitting of relaxation dispersion data using the flexible software package GLOVE. J Biomol NMR. 2013;56(3):275–283. doi: 10.1007/s10858-013-9747-5. [DOI] [PMC free article] [PubMed] [Google Scholar]
- 44.Carver JP, Richards RE. A general two-site solution for chemical exchange produced dependence of T2 upon Carr-Purcell pulse separation. J Magn Reson. 1972;6(1):89–105. [Google Scholar]