Significance
Neurons integrate synaptic inputs at the axon initial segment (AIS), where the action potential is initiated. Recent findings have shown this structure to be highly plastic. Here, we focus on the axo-axonic synapses formed onto the AIS and show that although chronic increases in neuronal activity result in a distal relocation of the AIS, the synapses do not change position. Computational modeling suggests this spatial mismatch has critical functional consequences on neuronal output, allowing the cell to downregulate its own excitability and thus respond homeostatically to chronic stimulation.
Keywords: axon initial segment, chandelier cells, optogenetics, intrinsic plasticity, homeostatic plasticity
Abstract
The axon initial segment (AIS) is a structure at the start of the axon with a high density of sodium and potassium channels that defines the site of action potential generation. It has recently been shown that this structure is plastic and can change its position along the axon, as well as its length, in a homeostatic manner. Chronic activity-deprivation paradigms in a chick auditory nucleus lead to a lengthening of the AIS and an increase in neuronal excitability. On the other hand, a long-term increase in activity in dissociated rat hippocampal neurons results in an outward movement of the AIS and a decrease in the cell’s excitability. Here, we investigated whether the AIS is capable of undergoing structural plasticity in rat hippocampal organotypic slices, which retain the diversity of neuronal cell types present at postnatal ages, including chandelier cells. These interneurons exclusively target the AIS of pyramidal neurons and form rows of presynaptic boutons along them. Stimulating individual CA1 pyramidal neurons that express channelrhodopsin-2 for 48 h leads to an outward shift of the AIS. Intriguingly, both the pre- and postsynaptic components of the axo-axonic synapses did not change position after AIS relocation. We used computational modeling to explore the functional consequences of this partial mismatch and found that it allows the GABAergic synapses to strongly oppose action potential generation, and thus downregulate pyramidal cell excitability. We propose that this spatial arrangement is the optimal configuration for a homeostatic response to long-term stimulation.
Neurons receive a large number of synaptic inputs along the somato-dendritic compartment that integrate at the axon initial segment (AIS) to fire an action potential (AP) (1–3). As an important site for transforming graded synaptic inputs into all-or-none APs, it is also a potentially sensitive target for the modulation of neuronal excitability (4, 5). In fact, one interesting aspect of principal neurons in the hippocampus and cortex is the presence of a unique type of GABAergic axo-axonic synapse that forms onto the AIS and controls neuronal output (6, 7). These synapses are formed by a specific group of fast-spiking interneurons, the chandelier cells, that are generally found sparsely distributed in the brain and have therefore been difficult to study in the past (6, 8). However, the recently developed transgenic mouse lines that can label chandelier neurons more selectively have begun to shine light on their form and function (9). In the cortex, the axonal “cartridges” of synaptic boutons that form onto the AIS are generally found on the more distal AIS domain, where the AP is thought to initiate (9). Although there is little information on the role of these interneurons in network function, they have been implicated in a number of events, including driving negative feedback in the dentate gyrus (10), modulating the emergence of sharp waves in the hippocampus (11), providing complex inhibitory-excitatory feedforward loops in the cortex (12), as well as shunting and filtering out APs back-propagating from ectopic initiation sites in the hippocampus (13). In addition, there is an ongoing debate as to whether axo-axonic synapses depolarize or hyperpolarize postsynaptic pyramidal neurons (14), although in conditions mimicking in vivo-like oscillations, they act mainly as inhibitors of excitability (15). The emerging picture is one where chandelier cells play an important role in modulating neuronal output at the AIS, but the precise way in which this happens remains to be properly established.
More recently, longer-term forms of modulation have been described at the AIS in response to chronic alterations in neuronal activity (16–20). For example, sensory deprivation of chick brainstem auditory neurons caused an increase in the length of the AIS, which was paralleled by an increase in neuronal excitability (18). Conversely, in dissociated hippocampal neurons, increases in neuronal activity through either application of hyperkaelimic solution or by optogenetic means resulted in the distal relocation of the AIS, which correlated with a decrease in excitability (16, 17). These exciting forms of structural and functional plasticity have raised many questions that remain unanswered. For example, what happens to axo-axonic synapses when the AIS relocates? Do they also relocate to remain in register with the AIS or do they remain static, causing a mismatch between the two? Implicit in this question is the idea that different spatial arrangements between the AIS and axo-axonic synapses (eg: “in register” versus “mismatched”) could have very different consequences on neuronal output.
In this study we performed optogenetic activation of individual CA1 pyramidal neurons and show that activity-dependent relocation of the AIS occurs in hippocampal slices. However, the axo-axonic synapses that form on the AIS do not change their position, resulting in a mismatch between the two compartments. By using computational modeling of a typical CA1 neuron, we find that the distal relocation of the AIS, together with the activation of axo-axonic synapses in the proximal axonal domain, is the perfect combination for decreasing neuronal excitability. Our findings suggest that the interplay between the position of the AIS and its synapses is another important player in the set of homeostatic responses used by neurons to adapt to chronic changes in activity.
Results
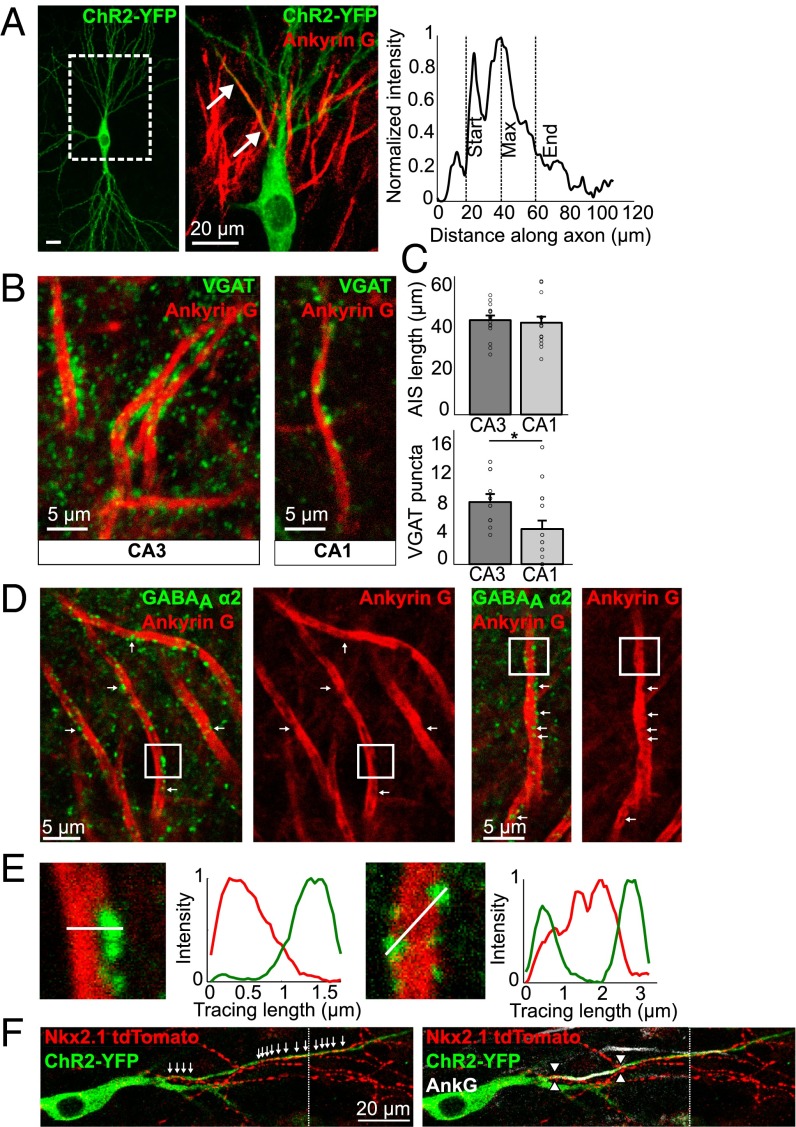
In principal neurons of the hippocampus and cortex, the AIS receives GABAergic synaptic modulation through axo-axonic synapses formed by chandelier interneurons (6, 21). We set out to label the AIS and its corresponding axo-axonic synapses in CA1 and CA3 pyramidal neurons from organotypic slices of the hippocampus. Staining for ankyrin-G (AnkG) resulted in a strong label of the AIS (Fig. 1). Axo-axonic synapses were colabeled with antibodies against either gephyrin, the postsynaptic structural marker for GABAergic synapses, or against the α2 subunit of GABAA receptors (GABAAα2), which is preferentially targeted to synapses along the AIS (22). Labeling of presynaptic GABAergic boutons by staining for the vesicular GABA transporter, VGAT, resulted in a strong colocalization with both postsynaptic markers. Close examination of the images showed that although AIS length was comparable between CA1 and CA3 neurons, the density and overall number of axo-axonic synapses formed onto the AIS of CA3 neurons was larger than that of CA1 cells (Fig. 1 B and C). The spatial distribution of synapses along the AIS was similar in both neurons and, interestingly, many synapses were found beyond the AIS (19, 23). This finding was further confirmed by imaging chandelier cell axons forming axo-axonic synapses along and beyond the AIS of CA1 neurons (Fig. 1F). One striking observation that was apparent in the confocal images of the thick CA3 axons was the heterogeneous distribution of the AnkG stain, showing gaps or holes along the axon. More importantly, we found that these AnkG-empty domains were often filled (or partially filled) with staining for postsynaptic markers of axo-axonic synapses (Fig. 1 D and E), as previously described (24). Although we did not see a similar staining pattern in the much thinner CA1 neurons, previous work using superresolution microscopy did show a separation of AIS and synaptic compartments, suggesting that this is a general feature of pyramidal neurons in the hippocampus and neocortex (24). These findings suggest the existence of two separate domains within the AIS, governed by different scaffolding proteins that form nonoverlapping macromolecular complexes and may therefore be controlled independently of each other. Because the AIS has been shown to undergo an activity-dependent relocation of its AnkG-based domain in dissociated hippocampal neurons (16, 17, 19), we sought to establish whether axo-axonic synapses also relocated, to remain in register with the AIS.
Fig. 1.
Axo-axonic synapses in organotypic hippocampal slices. (A) A ChR2-transfected CA3 pyramidal neuron, stained with AnkG (magnification). Start, maximum, and end position of the AIS was determined using the fluorescent intensity of the AnkG label along the axonal process. (Scale bar, Left: 20 μm.) (B) VGAT and AnkG staining in the CA3 and CA1 regions of the hippocampus. (C) AIS length and number of VGAT puncta on AISs in the CA3 and CA1 regions (means ± SEM; *P < 0.05; n = 16 CA1; n = 17 for CA3 AIS length; n = 12 for CA3 puncta). (D) GABAAα2 and AnkG staining in the CA3 region. Arrows indicate apparent holes in the AnkG staining, filled with GABAaα2 puncta. (E) Magnification of boxed areas as shown in D. Fluorescent intensity traces were taken through AIS and puncta as indicated by the white lines. (Scale bars, 20 μm.) (F) CA3 pyramidal neuron expressing ChR2-YFP in Nkx2.1CreER::Ai9 mouse showing chandelier cell boutons along its axon (arrows). AIS position is marked with arrowheads (Right). Dotted vertical line indicates image concatenation.
Single-Cell Optogenetic Stimulation Induces AIS Relocation in Organotypic Hippocampal Slices.
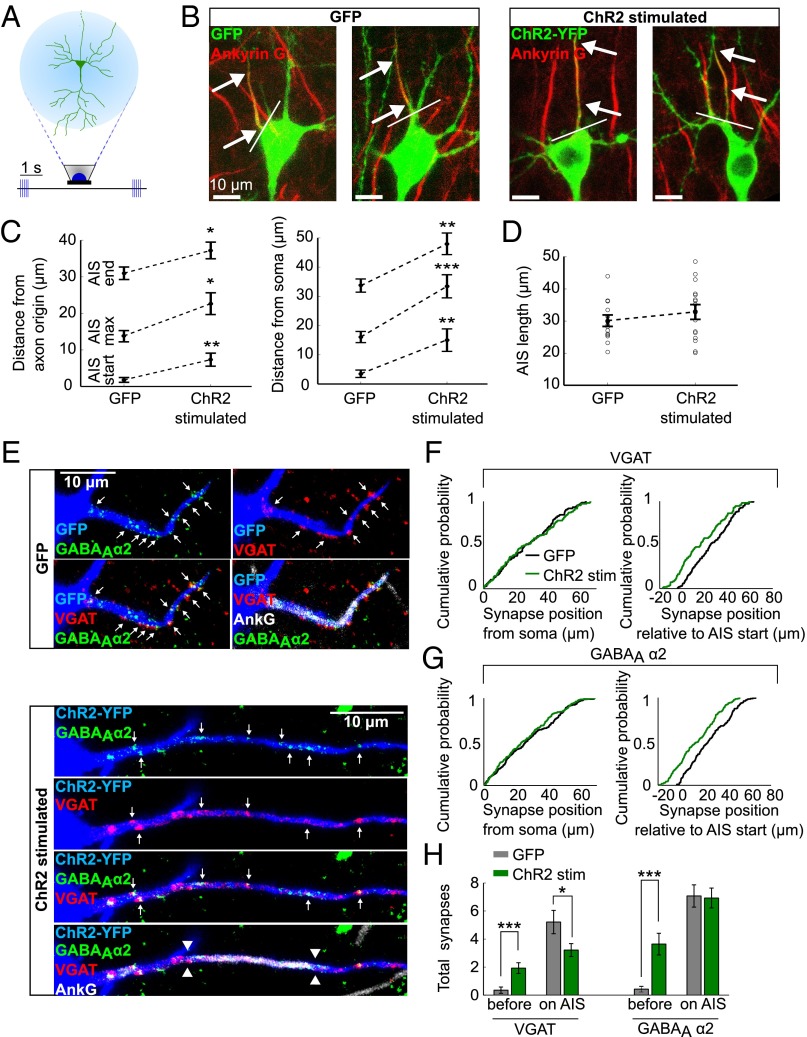
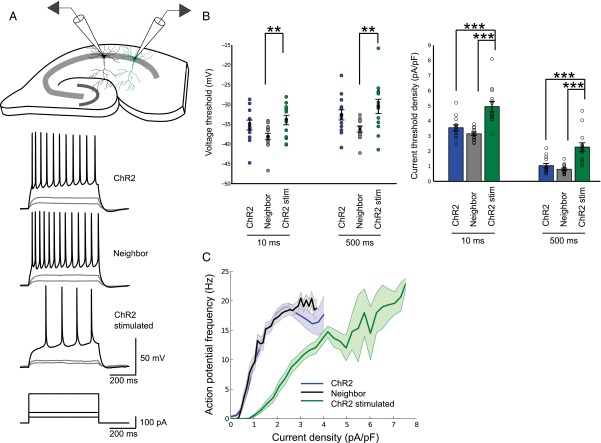
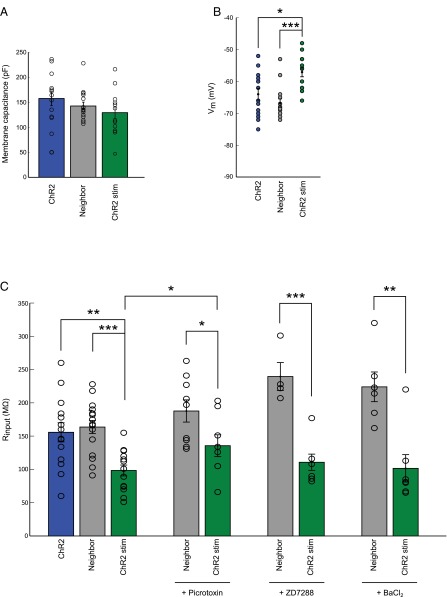
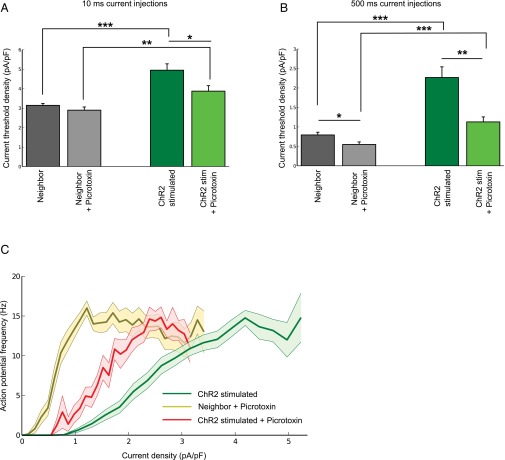
We performed chronic stimulation of individual CA1 pyramidal neurons expressing channelrhodopsin-2 (ChR2), using a previously described optogenetic approach (17). As controls, we used EGFP-expressing neurons from sister slices, grown in the same incubator, exposed to the same amount of blue LED light. After fixing and staining for AnkG, the spatial distribution of the AIS was measured in 3D (Figs. 1A and 2 A and B). One immediate observation from these images was that CA1 neurons could be classified into two broad morphological groups: those with an AIS that rises from the soma and those that branch off from a basal dendrite (25). Regardless of the morphology of the neuron, stimulated neurons showed a change in the position of the AIS such that the start, maximum, and end position of the AnkG stain was significantly shifted along the axon by about 12 μm. This finding was also true when measurements were taken from the axon origin, be it a basal dendrite or the soma. The length of the AIS did not change. Previous findings (17) have linked changes in AIS structure to changes in neuronal excitability. Indeed, whole-cell patch-clamp recordings revealed a significantly higher current threshold and a dramatic rightward shift of input-output curves in stimulated neurons (Fig. S1), indicating a decrease in neuronal excitability. In parallel to this, the input resistance (Rin) decreased significantly, which could not be explained by changes in hyperpolarization-activated currents (Ih) or barium-sensitive potassium conductances, but is caused, in large part, by a change in tonic GABAAR conductance (Fig. S2). Throughout our experiments we have used gabazine (SR95531; 10 μM) to block GABAA receptors, which only has a limited effect on tonic GABAA conductances (26–28). Blocking both synaptic and tonic GABAAR conductances with Picrotoxin (100 μM) lead to a significant reduction in threshold current and a large leftward shift of the input-output curve of ChR2-stimulated neurons (Fig. S3). This finding suggests that a tonic GABAAR conductance is regulated in an activity-dependent manner and can account for much of the drop in neuronal output.
Fig. 2.
Chronic stimulation of CA1 pyramidal neurons leads to a change in AIS, but not in axo-axonic synapse position. (A) ChR2-transfected CA1 pyramidal neurons in organotypic slices were stimulated with LEDs for 48 h. (B) AnkG stain in GFP control neurons and ChR2-stimulated neurons. Arrows indicate start and end position of the AIS, white line indicates axon origin. (C) The AIS position in control and chronically stimulated neurons, measured from axon origin or from soma (n = 15 GFP cells, n = 16 ChR2-stimulated cells). (D) AIS length in control and chronically stimulated neurons (n as in C). (E) VGAT, GABAAα2, and AnkG staining in GFP control neurons (Upper) or ChR2-stimulated neurons (Lower). Arrows point to axo-axonic synapses overlapping with the AIS in 3D. The AIS position is marked with arrowheads. (F and G) Empirical cumulative distribution functions of VGAT (F) and GABAAα2 (G) puncta positions relative to the soma or to the AIS start (VGAT: n = 136 synapses, 14 cells control; n = 109 synapses, 14 cells ChR2-stimulated; GABAAα2: n = 207 synapses, 14 cells control; n = 183 synapses, 14 cells ChR2-stimulated). (H) Number of VGAT and GABAAα2 puncta observed between the soma and the AIS as well as on the AIS in control and light-stimulated neurons (n = 14 cells). All error bars represent SEM; *P < 0.05, **P < 0.01, ***P < 0.001.
Fig. S1.
AIS plasticity after chronic stimulation leads to reduced intrinsic excitability. (A) Current clamp recordings were taken from ChR2-stimulated neurons (ChR2-stimulated), neighboring untransfected neurons (Neighbor), and ChR2-transfected but unstimulated neurons (ChR2). Sample responses to 500-ms current injections of varying strength shown below. (B) Voltage threshold and current threshold density for 10-ms and 500-ms current injections (n = 16 neighboring, n = 14 ChR2, n = 14 ChR2-stimulated cells). (C) Input-output curves in response to 500-ms current injections of increasing strength. All plots show mean ± SEM; **P < 0.01, ***P < 0.001.
Fig. S2.
Passive membrane properties of CA1 pyramidal neurons. (A) Membrane capacitance of neurons from the three treatment groups as explained in Fig. S1A (n = 16 neighboring, n = 14 ChR2, n = 14 ChR2-stimulated cells). (B) Resting membrane potential in the three treatment groups (n as in A). (C) Input resistance before (left; n as in A) and after addition of 100 μM Picrotoxin (n = 9 control, n = 8 ChR2-stimulated cells), the HCN channel blocker ZD7288 (20 μM; n = 4 control, n = 7 ChR2-stimulated cells), or 1 mM barium chloride (n = 6 control, n = 7 ChR2-stimulated cells). All plots show mean ± SEM; *P < 0.05 **P < 0.01, ***P < 0.001.
Fig. S3.
Activity-dependent change in tonic GABAA conductance is partly responsible for reduced intrinsic excitability. (A) Current threshold density for 10-ms current injections (n = 16 neighboring, n = 9 neighbor + Picrotoxin, n = 14 ChR2-stimulated, n = 8 ChR2-stimulated + Picrotoxin cells). (B) Current threshold density for 500 ms current injections (n as in A). (C) Input-output curves in response to 500-ms current injections of increasing strength. All plots show mean ± SEM; *P < 0.05 **P < 0.01, ***P < 0.001.
Axo-Axonic Synapses Do Not Change Position After AIS Plasticity.
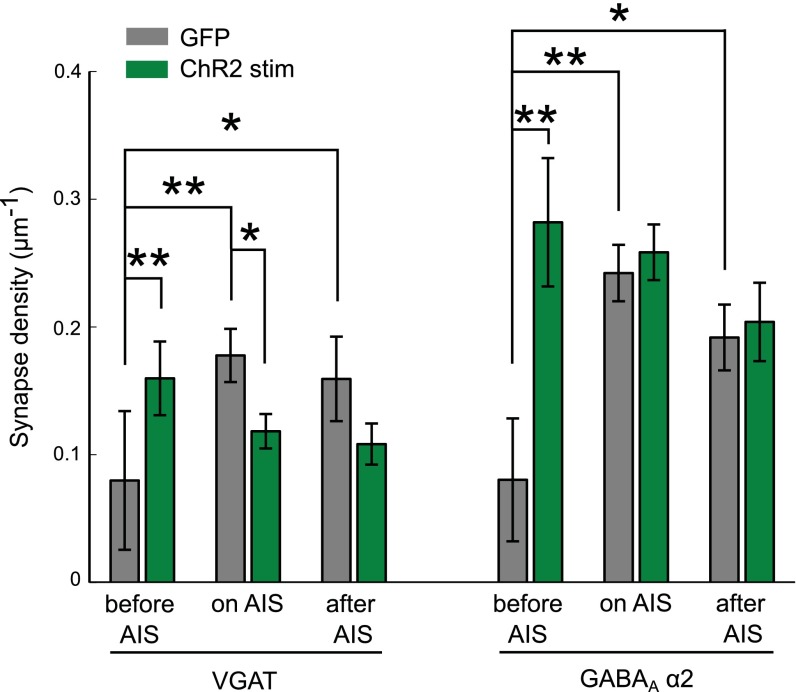
Do axo-axonic synapses that form onto the AIS of CA1 pyramidal neurons also relocate after chronic stimulation? Stimulated neurons were stained for AnkG and the synaptic markers VGAT and GABAAα2. We found that although the AIS did relocate, the GABAergic synapses did not change position (Fig. 2 E–H) (19). The distribution of VGAT and GABAAα2 terminals along the axon was identical to control neurons, suggesting that axo-axonic synapses are controlled independently of the AIS. A distribution of synapse position relative to the start of the AIS shows a shift in stimulated neurons compared with controls, with synapses being left behind in the space between the start of the AIS and the soma. Importantly, the distal relocation of the AIS did not lead to a major change in the number of synapses that form along it, because GABAergic synapses are also found beyond the AIS in unstimulated neurons (Fig. 1F and Fig. S4) (19, 23). We also saw no difference in the colocalization of pre- and postsynaptic markers, precluding the possibility that postsynaptic compartments moved with the AIS leaving orphan presynaptic boutons behind (or vice versa).
Fig. S4.
Density of VGAT and GABAAα2 puncta between soma and AIS, on the AIS and on the axon beyond the AIS in control and light-stimulated ChR2 neurons (means ± **P < 0.01; SEM; *P < 0.05; **P < 0.01; n = 14 cells).
An Optimal Spatial Arrangement of the AIS and Its Synapses for Downregulating Neuronal Activity.
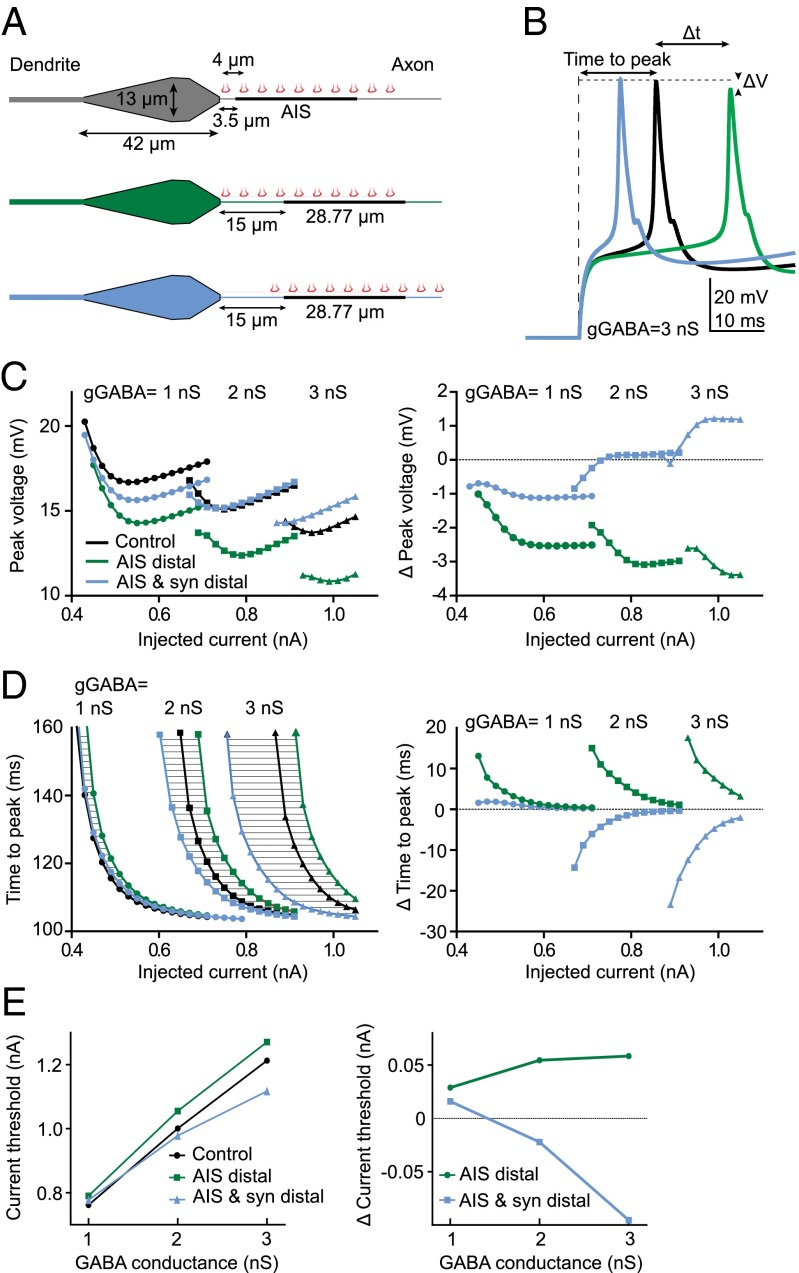
To establish whether this mismatch between axo-axonic synapses and the AIS has a functional role, we used a simple model of a CA1 neuron that contained a well-defined AIS and axo-axonic synapses at the same density to that observed in our experiments (Fig. 3A) (29). Our model compared a control neuron with the two conceivable arrangements after AIS relocation: (i) a neuron with a distal AIS and proximal synapses, resulting in a mismatch as observed experimentally; and (ii) a neuron with a distal AIS and distal synapses, so that both remain in register with each other. Activating GABAARs in these three conditions revealed important functional consequences on neuronal output and highlights the critical importance of synapse location relative to the AIS. Neurons with a distal AIS and proximal synapses (mismatched) showed delayed APs that were smaller in amplitude compared with controls. On the other hand, neurons with a distal AIS and distal synapses (in register) showed a shorter lag to the first AP and a change in amplitude that was highly dependent on the levels of GABAAR activation (Fig. 3 C and D). Importantly, the delays in AP firing were within the time-domain (tens of milliseconds) important for spike-timing–dependent plasticity rules that, when combined with changes in AP amplitude, will have important consequences for long-term forms of synaptic plasticity. Finally, we also found that neurons with a distal AIS, but proximal synapses had a higher current threshold, whereas those with distal synapses actually showed a lower current threshold compared with controls (Fig. 3E).
Fig. 3.
Computational model examining the effect of axo-axonic synapse position on APs. (A) GABAergic synapses were evenly spaced along the axon starting at 2 μm from the soma in the control and “AIS distal” scenario. In the third scenario the synapses were displaced distally together with the AIS. (B) APs elicited by a current pulse in the three scenarios. (C) Peak AP voltage (Left) and difference in peak voltage compared with control (Right), for varying GABAAR conductance. (D) Time to AP peak (Left) and difference in time to peak compared with control (Right). (E) Current threshold in response to a short, 3-ms current injection (Left) and difference in current threshold compared with control (Right).
Discussion
The findings presented here show that optogenetic activation of CA1 pyramidal neurons in the hippocampus resulted in a distal relocation of the AIS, but no change in the position of axo-axonic synapses, creating a mismatch between the AIS and its GABAergic inputs. More importantly, our model predicts that this configuration has multiple and far-reaching effects on AP initiation and properties, including modulation of the timing and amplitude of back-propagating APs, both of which are likely to affect long-term plasticity of synaptic inputs. The current threshold to short stimuli is also increased, making it more efficient at filtering out depolarizing synaptic inputs, thus resulting in a homeostatic decrease in neuronal excitability. Interestingly, our model predicted that a relocation of the synapses together with the AIS would have had the opposite effect, an increase in neuronal excitability compared with controls. It appears that the dissociation between the AIS and its axo-axonic synapses leads to an optimal configuration for a homeostatic response to long-term stimulation. Our findings reveal a novel form of plasticity where the position of synapses and their target can be modified with exquisite precision to fine-tune neuronal output.
Distribution of Axo-Axonic GABAergic Synapses in the Hippocampus.
An activity-dependent change in AIS position has previously been reported in dissociated hippocampal neurons (17). Here we show, to our knowledge for the first time, that a similar form of plasticity also occurs in CA1 neurons in organotypic slices, a preparation where the architecture of the network and its connections is preserved. In addition, slices can be taken from postnatal tissue, assuring that the late-born chandelier cells have migrated to the hippocampus before slice preparation (9). As a result, we were able to visualize the GABAergic axo-axonic synapses made by chandelier neurons onto the AIS of pyramidal cells and follow their behavior during AIS plasticity. Axo-axonic synapses formed all along the AIS and were not biased toward the distal end, as observed in cortical neurons. Strikingly, we also observed that synapses were not spatially constrained to the AIS but extended beyond it (19, 23). Although it is unclear what role these synapses play, it is likely that they modulate AP propagation down the axon. In the context of AIS plasticity, these synapses ensure that the AIS is still innervated even after it relocates distally, so that axo-axonic synapses can continue to modulate neuronal output.
Along the axon of CA3 neurons, axo-axonic synapses often fitted in the gaps or holes in the AnkG stain of the AIS. This punctured distribution of AnkG has been previously described in a number of different neurons, including in CA1 and CA3 cells, using superresolution structured illumination microscopy (24). The gaps in AnkG were filled mainly by clusters of the voltage-gated potassium channel Kv2.1, the cisternal organelle marker synaptopodin, and GABAergic synapses. Further high-resolution imaging will need to be done following activity-dependent AIS relocation, especially on the thin axons of CA1 pyramidal cells, to establish what happens to the ultrastructure of the AIS, its synapses, and other proteins associated with axo-axonic synapses. The Kv2.1 channel is particularly interesting because it does not have an AnkG binding domain (unlike other ion channels at the AIS) and undergoes an activity-dependent dispersion (loss of clustering) and change in gating properties thought to be homeostatic in nature (30, 31). These events are calcineurin-dependent (30), much like the AIS relocation in dissociated neurons (16), implying that similar signaling cascades may be acting on both compartments and could thus be responsible for the mismatch between axo-axonic synapses and the AIS observed here.
Our data strongly suggest that there are two spatial domains at the AIS with distinct molecular identities, one based on the scaffolding protein AnkG and the other on the GABAergic scaffolding protein gephyrin. However, recent data in hippocampal neurons has shown that AnkG is generally found adjacent to GABAergic synapses in the somatodendritic compartment and actually interacts with it through its binding of GABARAP (32). The interaction with AnkG is thought to stabilize GABAergic synapses by opposing endocytosis of GABARs (32). Although we found that AnkG levels in the space between the AIS and the soma were either strongly reduced or absent following AIS relocation, in many of our images we do still see weakly labeled clusters of AnkG staining, which may be sufficient to stabilize the synapses left behind after the relocation of AnkG. Alternatively, these particular synapses may not need AnkG to remain stable. Purkinje cells, for example, show no AnkG label in the soma (32), yet they still receive inhibitory inputs, suggesting that the presence of AnkG is not always a prerequisite for a stable GABAergic synapse. In any case, our data did not reveal a change in the number of axo-axonic synapses, although whether the strength of these synapses changed remains to be established (33–35). Previous work has shown that seizures in the brain can lead to a loss of both axo-axonic and axo-somatic GABAergic inputs that may then lead to intractable forms of epilepsy (36, 37). Most of this can be explained by a loss of interneurons through excitotoxic damage, likely caused by the high levels of activity in the network. Our experimental procedure made sure that activity was only increased in single pyramidal cells, by using optogenetic stimulation of pharmacologically isolated neurons. As a result, only cell-autonomous events would be induced that would bypass network hyperactivity and therefore avoid interneuron excitotoxicity.
AIS Plasticity and Neuronal Output.
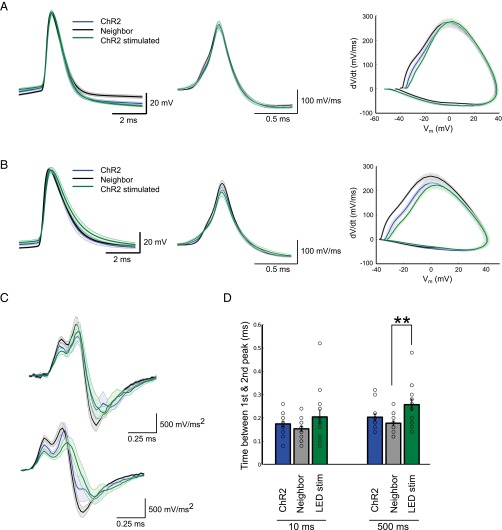
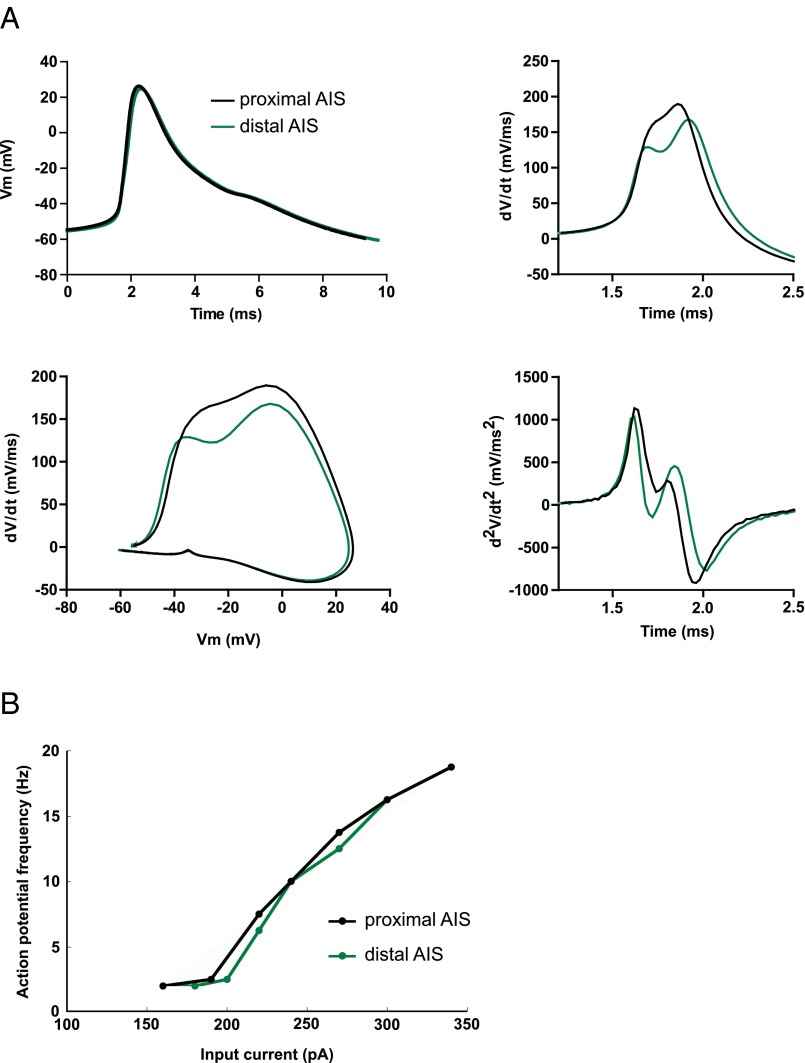
We observed that CA1 neurons lowered their excitability levels after long-term stimulation. This result is likely because of the change in AIS position, as well as the decrease in Rin. We also found that the shape of the AP changed. The second derivative of the AP in control neurons showed two clear peaks that correspond to the axonal and somatic AP, in that order, and these two peaks were found further apart in stimulated neurons with a more distal AIS (Fig. S5 C and D). The simplest explanation for this delay in the second peak is the larger distance that the AP needs to travel as it back-propagates to the soma. In fact, taking the 12-μm distal relocation of the AIS measured structurally together with the 60-μs increase in delay between the peaks results in an AP propagation speed of 0.2 m/s. This finding is in line with previous measures of AP propagation along unmyelinated axons in the hippocampus (38–40) and was also confirmed in our model, where relocating the AIS caused a similar delay in the second peak (Fig. S6A).
Fig. S5.
AP shape in stimulated and control CA1 pyramidal neurons. (A) Average AP trace (Left), first derivative (Center), and phase plot (Right) of the first AP elicited in response to 10-ms current injections at threshold. (B) Average AP trace (Left), first derivative (Center), and phase plot (Right) of the first AP elicited in response to 500-ms current injections. (C) Average second derivative of the first AP elicited in response to 10-ms (Upper) or 500-ms current injections (Lower). (D) Delay between the first and second peak in the second derivative of the AP waveform (means ± SEM; **P < 0.01; n = 14 ChR2 and ChR2-stimulated, n = 16 Neighbor).
Fig. S6.
Characterization of AP output from the computational model. (A) AP waveform, its first derivative, phase plot, and second derivative in two different conditions: AIS proximal (AIS distance to soma 3.5 μm) and AIS distal (AIS distance 15 μm). (B) Input-output curve for the two different conditions as described for A, in response to an 800-ms current injection at the soma.
Importantly, our computational model also allowed us to investigate the consequence of GABAergic synapse position on neuronal output and explore different scenarios. It revealed that moving the AIS distally could have opposite effects on AP generation, depending on the position of axo-axonic synapses. When the AIS is moved distally while leaving axo-axonic synapses close to the soma, AP amplitude decreased and latency to the first AP as well as current threshold increased, all indicating a decrease in excitability compared with controls. However, if the synapses were to relocate together with the AIS, moving away from the soma, we found an opposite effect on these parameters, suggesting an increase in excitability compared with controls. One possible explanation for this surprising result is that proximal synapses create a shunt that will partially prevent the charging of the membrane in response to depolarizing inputs and will affect both axonal and nearby somatic membranes. As a result, sodium channels in both compartments will be affected. However, if synapses are moved distally, the shunting effect is also displaced away from the soma, resulting in modulation occurring mainly at the AIS and less so at the soma. Although the AP in our model is initiated at the distal end of the AIS, where membrane conditions are ideal for spike initiation, somatic sodium channels also contribute to AP generation and AP shape in the soma. Proximal synapses will thus prevent activation of both somatic and AIS sodium channels, whereas distal synapses will preferentially act on AIS channels only, resulting in the opposing effects on AP properties shown in this study.
In conclusion, the distal relocation of the AIS together with the proximal distribution of axo-axonic synapses results in the ideal configuration for decreasing neuronal excitability of CA1 pyramidal neurons, and thus for a homeostatic response to long-term stimulation.
Experimental Procedures
For extended procedures and methods, see SI Experimental Procedures.
Organotypic Slice Preparation.
Organotypic hippocampal slice cultures were prepared from 7-d-old male Sprague-Dawley rats (Charles River), as described previously (41). After 1 d in vitro, slices were transfected using a Helios Gene Gun (Bio-Rad). The target DNA was either eGFP or ChR2–YFP [pLenti-Synapsin- hChR2(H134R)-EYFP-WPRE, a gift from K. Deisseroth, Stanford University, Stanford, CA (web.stanford.edu/group/dlab/optogenetics/)].
Transgenic Mice.
Nkx2.1CreER mice (9) were crossed with the Ai9 reporter line (42), both obtained from Jackson Laboratories. Animals were bred and housed in accordance with the United Kingdom Animals (Scientific Procedures) Act (1986). Tamoxifen was dissolved in corn oil (30 mg/mL) at 37 °C with constant agitation. It was delivered by intraperitoneal injection into pups at postnatal day 2, at a dose of 100 μg/g of body weight. Organotypic slices were then prepared at postnatal day 7, as described above.
ChR2 Photostimulation.
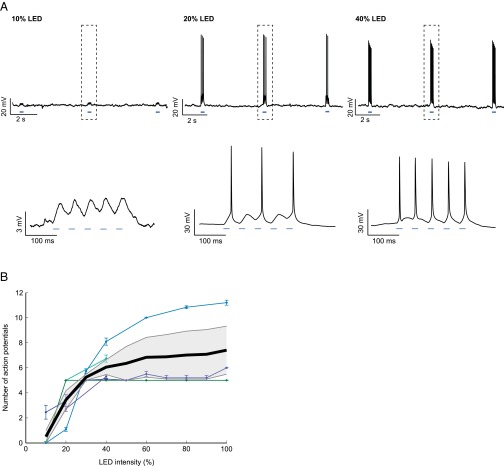
For photostimulation experiments, six-well culture plates were placed on top of a custom-built heat sink and LED assembly after 4 d in vitro, for 48 h. Flashes were delivered at 40% LED intensity for 20 ms in bursts of five at 20 Hz, every 5 s, ensuring at least one spike per stimulus in all ChR2+ neurons (Fig. S7).
Fig. S7.
Activation of ChR2 by varying intensities of LED light. (A) Whole-cell current clamp recordings from a ChR2-expressing CA1 pyramidal neuron, stimulated by a blue LED at 10%, 20%, and 40% light intensity. The stimulation consisted of a burst of five flashes (indicated by blue bars below traces), each lasting 20 ms, delivered at 20 Hz. Bursts were delivered every 5 s. Lower traces depict magnification of the boxed areas. (B) Number of APs elicited in response to a burst of blue LED light as described in A, at varying light intensities. Thin lines represent responses from individual neurons, thick black line represents mean ± SEM. The light intensity used throughout the experiments was set to 40%, where APs were evoked reliably to each flash of light.
Image Analysis.
Hippocampal slices were fixed, stained, and imaged using standard immunohistochemistry techniques. A line profile was drawn along the axon, through and past the AIS, in 3D using the ImageJ plugin Simple Neurite Tracer. Images and traces were imported into Matlab (Mathworks) for analysis using custom-written functions, as described previously (17). For semiautomated synapse detection, the trace along the axon was broadened to be 1.5 μm in diameter. After background subtraction, synapses were identified in each z-frame using edge detection. The list of synapses was then curated manually and only those that overlapped with the broadened axon trace were included in the final dataset.
Statistics.
Exact P-Values and statistical tests are given in Table S1.
Table S1.
Summary of statistical analyses
| Figure | Test | P value | Number |
| 1C (AIS length) | Mann–Whitney U | 0.4 | 17 CA3 cells, 16 CA1 cells |
| 1C (No. of VGAT puncta) | Mann–Whitney U | 0.015 | 12 CA3 cells, 16 CA1 cells |
| 2C (Distance from axon origin) | Mann–Whitney U | 0.007 start, 0.015 max, 0.042 end | 15 GFP cells, 16 ChR2-stimulated cells |
| 2C (Distance from soma) | Mann–Whitney U | 0.007 start, 5.43 × 10⁻⁴ max; 0.004 end | 15 GFP cells, 16 ChR2-stimulated cells |
| 2D | Student’s t test | 0.32 | 15 GFP cells, 16 ChR2-stimulated cells |
| 2F (Position from soma) | Mann–Whitney U | 0.86 | 136 Synapses, 14 cells control; 109 synapses, 14 cells ChR2-stimulated |
| 2F (Position relative to AIS) | Mann–Whitney U | 1.8 × 10⁻⁴ | 136 Synapses, 14 cells control; 109 synapses, 14 cells ChR2-stimulated |
| 2G (Position from soma) | Mann–Whitney U | 0.29 | 207 Synapses, 14 cells control; 183 synapses, 14 cells ChR2-stimulated |
| 2G (Position relative to AIS) | Mann–Whitney U | 5.93 × 10⁻⁸ | 207 Synapses, 14 cells control; 183 synapses, 14 cells ChR2-stimulated |
| 2H (VGAT) | Mann–Whitney U | 9.91 × 10⁻⁴ Before AIS; 0.032 on AIS | 14 Control cells, 14 ChR2-stimulated cells |
| 2H (GABAAα2) | Mann–Whitney U | 0.0013 Before AIS; 0.89 on AIS | 14 Control cells, 14 ChR2-stimulated cells |
| S1B (Voltage threshold 10 ms) | One-way ANOVA with Tukey–Kramer post hoc tests | Population: 0.011 | 16 Neighboring cells, 14 ChR2 cells, 14 ChR2-stimulated cells |
| Pairwise comparisons: 0.011 ChR2 stim vs. NBQX; 0.64 ChR2-stimulated vs. ChR2; 0.1 ChR2 vs. neighbor | |||
| S1B (Voltage threshold, 500 ms) | One-way ANOVA with Tukey–Kramer post hoc tests | Population: 0.005 | 16 Neighboring cells, 14 ChR2 cells, 14 ChR2-stimulated cells |
| Pairwise comparisons: 0.004 ChR2-stimulated vs. neighbor; 0.45 ChR2-stimulated vs. ChR2; 0.1 ChR2 vs. neighbor | |||
| S1B (Current threshold density, 10 ms) | One-way ANOVA with Tukey–Kramer post hoc tests | Population: 1.54 × 10⁻⁶ | 16 Neighboring cells, 14 ChR2 cells, 14 ChR2-stimulated cells |
| Pairwise comparisons: | |||
| 1.02 × 10⁻⁵ ChR2-stimulated vs. neighbor; 0.0002 ChR2-stimulated vs. ChR2; 0.4 ChR2 vs. neighbor | |||
| S1B (Current threshold density 500 ms) | Kruskal–Wallis ANOVA with Dunn post hoc tests | Population: 1.26 × 10⁻⁵ | 16 Neighboring cells, 14 ChR2 cells, 14 ChR2-stimulated cells |
| Pairwise comparisons: 1.4 × 10⁻⁵ ChR2-stimulated vs. neighbor; 0.0018 ChR2-stimulated vs. ChR2; 0.56 ChR2 vs. neighbor | |||
| S2A | Kruskal–Wallis ANOVA | 0.16 | 16 Neighboring cells, 14 ChR2 cells, 14 ChR2-stimulated cells |
| S2B | Kruskal–Wallis ANOVA with Dunn post hoc tests | Population: 9.6 × 10⁻⁴ | 16 Neighboring cells, 14 ChR2 cells, 14 ChR2-stimulated cells |
| Pairwise comparisons: 0.0008 ChR2-stimulated vs. neighbor; 0.034 ChR2-stimulated vs. ChR2; 0.51 ChR2 vs. neighbor | |||
| S2C (No drug) | One-way ANOVA with Tukey–Kramer post hoc tests | Population: 2.32 × 10⁻⁴ | 16 Neighboring cells, 14 ChR2 cells, 14 ChR2-stimulated cells |
| Pairwise comparisons: 0.0004 ChR2-stimulated vs. neighbor; 0.0024 ChR2-stimulated vs. ChR2; 0.86 ChR2 vs. neighbor | |||
| S2C (+Picrotoxin) | Student’s t test | 0.043 | 9 Neighboring cells; 8 ChR2-stimulated cells |
| S2C (+ZD7288) | Student’s t test | 2.86 × 10⁻⁴ | 4 Neighboring cells; 7 ChR2-stimulated cells |
| S2C (+BaCl2) | Mann–Whitney U | 0.008 | 6 Neighboring cells; 7 ChR2-stimulated cells |
| S3A | Student’s t test | 6.43 × 10⁻⁶ neighbor vs. ChR2-stimulated; 0.18 neighbor vs. neighbor + PTX; 0.008 neighbor + PTX vs. ChR2-stimulated + PTX; 0.04 ChR2-stimulated vs. ChR2 stim + PTX | 16 Neighboring cells; 14 ChR2-stimulated cells; 9 neighboring cells + Picrotoxin; 8 ChR2-stimulated cells + Picrotoxin |
| S3B | Mann–Whitney U | 1.4 × 10⁻⁵ neighbor vs. ChR2-stimulated; 0.03 neighbor vs. neighbor + PTX; 8.6 × 10⁻⁴ neighbor + PTX vs. ChR2-stimulated + PTX; 0.002 ChR2-stimulated vs. ChR2-stimulated + PTX | 16 Neighboring cells; 14 ChR2-stimulated cells; 9 neighboring cells + Picrotoxin; 8 ChR2-stimulated cells + Picrotoxin |
| S4 (VGAT) | Mann–Whitney U | 0.008 before AIS; 0.033 on AIS; 0.71 after AIS; 0.002 before vs. on AIS control; 0.017 before vs. after AIS control; 0.64 on vs. after AIS control; 0.21 before vs. on AIS ChR2-stimulated; 0.14 before vs. after AIS ChR2-stimulated; 0.63 on vs. after AIS ChR2-stimulated | 14 Control cells, 14 ChR2-stimulated cells |
| S4 (GABAAα2) | Mann–Whitney U | 0.007 before AIS; 0.73 on AIS; 0.4 after AIS; 0.005 before vs. on AIS control; 0.016 before vs. after AIS control; 0.15 on vs. after AIS control; 0.48 before vs. on AIS ChR2-stimulated; 0.13 before vs. after AIS ChR2-stimulated; 0.25 on vs. after AIS ChR2-stimulated | 14 Control cells, 14 ChR2-stimulated cells |
Mathematical Modeling.
A model CA1 pyramidal neuron was implemented within the simulation software NEURON 7.3 (43). All compartments were equipped with ionic channels as described previously (29). The density of each channel type (Table S2) was adjusted to fit experimental results. The inhibitory input consisted of 10 synaptic sites regularly spaced every 4 μm along the axon, with the first synapse being placed 2 μm from the soma.
Table S2.
Maximal conductances (mS/cm2) of the currents included in the model
| Current | Soma | Preaxonal segment | AIS 1 | AIS 2 | Axon | Dendrite |
| INaT | 10 | 8 | 100 | 100 | 50 | 6 |
| INaP | 0.1 | — | — | — | — | — |
| INaT-In | 0.76 | — | 1.6 | — | — | — |
| IKDR | — | 2.5 | 6 | 20 | 1 | — |
| IKA | 4 | 4 | 6 | 7 | 7 | 8 |
| IKM | 0.5 | 3 | 4 | 4 | 4 | — |
| IKCT | 18 | — | — | — | — | — |
| IAHP | 25 | — | — | — | — | — |
| ICaT | 0.01 | — | — | — | — | — |
| ICaL | 0.1 | — | — | — | — | — |
| ICaR | 0.01 | — | — | — | — | — |
| ICanpq | 0.05 | — | — | — | — | — |
| IH | 0.025 | — | — | — | — | 0.3 |
The currents included in the model are identical to the ones used in an established model of a CA1 pyramidal neuron (29). IAHP, Ca2+ dependent afterhyperpolarization K+ current; ICaL, L-type Ca2+ current; ICanpq, N, P/Q -type Ca2+ current; ICaR, R-type Ca2+ current; ICaT, T-type Ca2+ current; IH, h current; IKA, A-type K+ current; IKCT, voltage and Ca2+ dependent K+ current; IKDR, delayed rectifier K+ current; IKM, M-type K+ current; INaP, persistent Na+ current; INaT, transient Na+ current; INaT-In, intermediate inactivation Na+ current.
SI Experimental Procedures
Organotypic Slice Preparation.
Organotypic hippocampal slice cultures were prepared as described previously (41). The hippocampi of 7-d-old male Sprague-Dawley rats (Charles River) were dissected in cold GBSS supplemented with D-Glucose (34.7 mM) and cut into 400-μm-thick slices using a McIlwain tissue chopper. Slices were placed onto Millicell-CM membranes and maintained in culture media composed of 25% (vol/vol) EBSS (Invitrogen), 49% (vol/vol) MEM (Invitrogen), 1% (vol/vol) B27 (Invitrogen), 25% (vol/vol) heat-inactivated horse serum (PAA), and 6.2 g/l glucose (Fisher). Slices were incubated for a total of 6 d in vitro at 36 °C and 5% CO2. After 1 d in vitro, slices were transfected using a Helios Gene Gun (Bio-Rad). The target DNA was either eGFP or ChR2–YFP [pLenti-Synapsin- hChR2(H134R)-EYFP-WPRE, a gift from K. Deisseroth, (Stanford University, Stanford, CA (web.stanford.edu/group/dlab/optogenetics/)].
ChR2 Photostimulation.
For photostimulation experiments, six-well culture plates were placed on top of a custom-built heat sink and LED assembly after 4 d in vitro, for 48 h. The blue LEDs (Royal-Blue; 447.5 nm Rebel LED) were topped with collimators, powered by a DC/DC LED driver (Recom) and controlled by a digital I/O device (USB-6501, National Instruments) and custom-written software (Andrew Lowe, King's College London, London). The culture medium was supplemented with a mixture of antioxidants [110 μM vitamin C, 100 μM Trolox, 77 nM superoxide dismutase, 10 nm catalase (all from Sigma), and 3.2 μM glutathione (Fisher)] as well as with blockers of excitatory synaptic transmission NBQX (10 μM; Tocris) and APV (25 μM; Sigma). Flashes were delivered at 40% LED intensity for 20 ms in bursts of five at 20 Hz, every 5 s, ensuring at least one spike per stimulus in all ChR2+ neurons (Fig. S7). The light intensity of the LEDs was adjusted so as to cause reliable activation of ChR2 while limiting any potential damage caused by long-term exposure to high-energy light.
Electrophysiology.
For whole-cell patch-clamp recordings, slices were transferred to a recording chamber after 6 d in vitro and continuously superfused with artificial cerebrospinal fluid at 30 °C, containing: 120 mM NaCl, 3 mM KCl, 1 mM MgCl2, 3 mM CaCl2, 1.2 mM NaH2PO4, 23 mM NaHCO3, 11 mM D-glucose, 1 mM Trolox, 0.01 mM SR95531, 0.01 mM NBQX , 0.025 mM APV; the pH was adjusted to 7.35 and it was constantly oxygenated with carbogen gas (95% O2, 5% CO2). CA1 neurons were identified based on shape and location within the hippocampal slice. Patch pipettes of 3–6 MΩ resistance were pulled using a P-97 Flaming/Brown Micropipette Puller (Sutter) and filled with an internal solution containing: 130 mM K-Gluconate, 1 mM EGTA, 3.5 mM Na2ATP, 1 mM Na3GTP, 10 mM NaCl, 0.13 mM CaCl2, 2 mM MgCl2, 10 mM and Hepes. Osmolarity was adjusted to 290 mOsM and the pH to 7.3 with KOH. Recordings were obtained with a Multiclamp 700B amplifier (Molecular Devices). Signals were Bessel filtered at 10 kHz, digitized, and sampled at 50 kHz. All voltage offsets were nulled before seal formation. Membrane capacitance was compensated in the on-cell configuration. Current thresholds for AP firing were measured in current clamp with the holding potential set to −65 mV (uncorrected, as for all voltages reported in the paper, for an estimated liquid junction potential of approximately 15 mV). We injected 10-ms or 500-ms duration current steps of increasing amplitude in increments of 10 pA until current threshold was reached, at which the neuron reliably fired an AP (Vm > 0 mV). The resting membrane potential of CA1 neurons was measured at I = 0 in a current clamp immediately after membrane break-through. For recordings of ChR2-induced spiking, photostimulation was delivered using exactly the same LED, collimator, driver and I/O device as used for the chronic photostimulation experiments (see above).
Immunohistochemistry.
We used the following primary antibodies: mouse monoclonal anti-AnkG (1:500; clone N106/20, NeuroMab), guinea pig polyclonal GABAAα2 (1:500; 224 104; Synaptic Systems) and rabbit polyclonal anti-VGAT (1:500; 131 002, Synaptic Systems). For AnkG labeling, slices were fixed with 4% (wt/vol) paraformaldehyde [PFA, TAAB Laboratories; in 3% (wt/vol) sucrose, 60 mM Pipes, 25 mM Hepes, 5 mM EGTA, 1 mM MgCl2; pH 7.4; 1 h at room temperature, 23 °C]; for labeling with synaptic markers we used a 1% (wt/vol) PFA fixation. Otherwise, all labeling steps were identical. After washing in PBS and blocking for 2 h at room temperature [in 0.25% (vol/vol) Triton X-100 (Sigma), 10% (vol/vol) normal goat serum (Bethyl Laboratories), and PBS], slices were incubated with primary antibody overnight at 4 °C (in blocking solution), washed, incubated with secondary antibody (in blocking solution) for 2 h at room temperature, and washed again. We used the following secondary antibodies: Alexa Fluor goat anti-mouse IgG1 568 or 633, goat anti-rabbit 405 or 568, goat anti-guinea pig 488 or 568 (all 1:500; Life Technologies).
Image Analysis.
For confocal imaging of AIS position, slice cultures were mounted on an Olympus BX51 upright microscope equipped with a confocal scan-head (FV1000; Olympus) and a 40× water immersion objective (NA 0.80). Images were acquired using Fluoview software (1,024 × 1,024 pixels, 2-μm z axis steps). GFP and ChR2-YFP–expressing cells were imaged at 488-nm excitation using an argon laser, antibody staining was imaged at 543- and 633-nm excitation using HeNe lasers, with appropriate excitation and emission filters. For confocal imaging of synaptic staining, slices were either mounted on a Nikon A1R inverted confocal microscope with a 40× water immersion objective (NA 1.1) and 408-, 488-, 561-, and 638-nm laser lines, or a Nikon A1R Si MP upright confocal with a 40× water immersion objective (NA 1.25) using 405-, 561-, and 642-nm diodes as well as a 488-nm Argon laser. In both cases, images were acquired using the NIS Elements software.
Image stacks were exported as raw 16-bit TIFF files. A line profile was drawn along the axon, through and past the AIS, in 3D using the ImageJ plugin Simple Neurite Tracer. Images and traces were imported into Matlab (Mathworks) for analysis using custom-written functions, as described previously (17). Briefly, the fluorescence profile along the tracing was smoothed and averaged and then normalized to between 1 (maximum smoothed fluorescence, location of the AIS max position) and 0 (minimum smoothed fluorescence). AIS start and end positions were obtained at the proximal and distal axonal positions, respectively, where the normalized and smoothed profile declined to 0.33. For semiautomated synapse detection, the trace along the axon was broadened to be 1.5 μm in diameter. After background subtraction, synapses were identified in each z-frame using edge detection. The list of synapses was then curated manually and only those that overlapped with the broadened axon trace were included in the final dataset.
Statistics.
Statistical analysis was carried out in Matlab (Mathworks). Before analysis, distributions were assessed for normality using the Lilliefors (Kolmogorov–Smirnoff) test. Normally distributed datasets were compared using a two- tailed, unpaired (two-sample) Student’s t test. All other datasets were compared using the nonparametric Mann–Whitney U test. One-way ANOVA followed by Tukey–Kramer post hoc tests were used for >two independent samples or Kruskal–Wallis ANOVA followed by Dunn post hoc tests for data not normally distributed. Values of P ≤ 0.05 were considered statistically significant. Exact P values are given in Table S1.
Mathematical Modeling.
A model CA1 pyramidal neuron was implemented within the simulation software NEURON 7.3 (43). It was composed of a cell body (length, 42 μm), an apical dendrite (length, 500 μm; diameter, 4 μm), a preaxonal segment (diameter, 1.2 μm), an axon initial segment made of two equal length parts (total length, 28.77 μm; diameter, 1.2 μm), and an axon (length, 500 μm; diameter, 1.2 μm). The distance from AIS to soma (i.e., length of preaxonal segment) was either 3.5 or 15 μm, as observed in the experiments. Each compartment was divided into segments in which currents and voltage were calculated. The number of segments was set to obtain a length/diameter ratio < 4. All compartments were equipped with ionic channels as described previously (29). The properties of the various ion channels used in the simulations are based on Hodgkin–Huxley formalism (29). A leak current was added to each compartment to allow settings of the input resistance (7,500 Ω/cm2) and the resting potential. The density of each channel type (Table S2) was adjusted to fit experimental results. Simulations were performed for a temperature of 26 °C. The integration time step was set to 0.02 ms.
The inhibitory input consisted of ten synaptic sites regularly spaced every 4 μm along the preaxonal segment, AIS, and axon, with the first synapse being placed 2 μm from the soma. In simulations, ECl was set to the resting membrane potential (−81 mV) and a steady-state activation of the synapses was used.
Acknowledgments
We thank K. Deisseroth for the channelrhodopsin-2 construct; M. Kotsogianni for assistance with tissue culture; A. S. Lowe and J. Mukanowa for assistance with LED photostimulation; and M. S. Grubb, G. Neves, and C. J. Akerman for comments on the manuscript. This work was supported by a Wellcome Trust Investigator award, a European Research Council Starting Grant, and a Lister Prize fellowship (to J.B.).
Footnotes
The authors declare no conflict of interest.
This article is a PNAS Direct Submission.
This article contains supporting information online at www.pnas.org/lookup/suppl/doi:10.1073/pnas.1502902112/-/DCSupplemental.
References
- 1.Debanne D, Campanac E, Bialowas A, Carlier E, Alcaraz G. Axon physiology. Physiol Rev. 2011;91(2):555–602. doi: 10.1152/physrev.00048.2009. [DOI] [PubMed] [Google Scholar]
- 2.Bender KJ, Trussell LO. The physiology of the axon initial segment. Annu Rev Neurosci. 2012;35:249–265. doi: 10.1146/annurev-neuro-062111-150339. [DOI] [PubMed] [Google Scholar]
- 3.Yoshimura T, Rasband MN. Axon initial segments: Diverse and dynamic neuronal compartments. Curr Opin Neurobiol. 2014;27:96–102. doi: 10.1016/j.conb.2014.03.004. [DOI] [PMC free article] [PubMed] [Google Scholar]
- 4.Grubb MS, et al. Short- and long-term plasticity at the axon initial segment. J Neurosci. 2011;31(45):16049–16055. doi: 10.1523/JNEUROSCI.4064-11.2011. [DOI] [PMC free article] [PubMed] [Google Scholar]
- 5.Grubb MS, Burrone J. Building and maintaining the axon initial segment. Curr Opin Neurobiol. 2010;20(4):481–488. doi: 10.1016/j.conb.2010.04.012. [DOI] [PMC free article] [PubMed] [Google Scholar]
- 6.Inan M, Anderson SA. The chandelier cell, form and function. Curr Opin Neurobiol. 2014;26:142–148. doi: 10.1016/j.conb.2014.01.009. [DOI] [PMC free article] [PubMed] [Google Scholar]
- 7.Somogyi P, Freund TF, Cowey A. The axo-axonic interneuron in the cerebral cortex of the rat, cat and monkey. Neuroscience. 1982;7(11):2577–2607. doi: 10.1016/0306-4522(82)90086-0. [DOI] [PubMed] [Google Scholar]
- 8.Somogyi P, Nunzi MG, Gorio A, Smith AD. A new type of specific interneuron in the monkey hippocampus forming synapses exclusively with the axon initial segments of pyramidal cells. Brain Res. 1983;259(1):137–142. doi: 10.1016/0006-8993(83)91076-4. [DOI] [PubMed] [Google Scholar]
- 9.Taniguchi H, Lu J, Huang ZJ. The spatial and temporal origin of chandelier cells in mouse neocortex. Science. 2013;339(6115):70–74. doi: 10.1126/science.1227622. [DOI] [PMC free article] [PubMed] [Google Scholar]
- 10.Zitman FM, et al. Dentate gyrus local circuit is implicated in learning under stress—A role for neurofascin. Mol Neurobiol. 2014 doi: 10.1007/s12035-014-9044-7. [DOI] [PubMed] [Google Scholar]
- 11.Viney TJ, et al. Network state-dependent inhibition of identified hippocampal CA3 axo-axonic cells in vivo. Nat Neurosci. 2013;16(12):1802–1811. doi: 10.1038/nn.3550. [DOI] [PMC free article] [PubMed] [Google Scholar]
- 12.Molnár G, et al. Complex events initiated by individual spikes in the human cerebral cortex. PLoS Biol. 2008;6(9):e222. doi: 10.1371/journal.pbio.0060222. [DOI] [PMC free article] [PubMed] [Google Scholar]
- 13.Dugladze T, Schmitz D, Whittington MA, Vida I, Gloveli T. Segregation of axonal and somatic activity during fast network oscillations. Science. 2012;336(6087):1458–1461. doi: 10.1126/science.1222017. [DOI] [PubMed] [Google Scholar]
- 14.Woodruff AR, Anderson SA, Yuste R. The enigmatic function of chandelier cells. Front Neurosci. 2010;4:201. doi: 10.3389/fnins.2010.00201. [DOI] [PMC free article] [PubMed] [Google Scholar]
- 15.Woodruff AR, et al. State-dependent function of neocortical chandelier cells. J Neurosci. 2011;31(49):17872–17886. doi: 10.1523/JNEUROSCI.3894-11.2011. [DOI] [PMC free article] [PubMed] [Google Scholar]
- 16.Evans MD, et al. Calcineurin signaling mediates activity-dependent relocation of the axon initial segment. J Neurosci. 2013;33(16):6950–6963. doi: 10.1523/JNEUROSCI.0277-13.2013. [DOI] [PMC free article] [PubMed] [Google Scholar]
- 17.Grubb MS, Burrone J. Activity-dependent relocation of the axon initial segment fine-tunes neuronal excitability. Nature. 2010;465(7301):1070–1074. doi: 10.1038/nature09160. [DOI] [PMC free article] [PubMed] [Google Scholar]
- 18.Kuba H, Oichi Y, Ohmori H. Presynaptic activity regulates Na(+) channel distribution at the axon initial segment. Nature. 2010;465(7301):1075–1078. doi: 10.1038/nature09087. [DOI] [PubMed] [Google Scholar]
- 19.Muir J, Kittler JT. Plasticity of GABAA receptor diffusion dynamics at the axon initial segment. Front Cell Neurosci. 2014;8:151. doi: 10.3389/fncel.2014.00151. [DOI] [PMC free article] [PubMed] [Google Scholar]
- 20.Chand AN, Galliano E, Chesters RA, Grubb MS. A distinct subtype of dopaminergic interneuron displays inverted structural plasticity at the axon initial segment. J Neurosci. 2015;35(4):1573–1590. doi: 10.1523/JNEUROSCI.3515-14.2015. [DOI] [PMC free article] [PubMed] [Google Scholar]
- 21.Somogyi P. A specific ‘axo-axonal’ interneuron in the visual cortex of the rat. Brain Res. 1977;136(2):345–350. doi: 10.1016/0006-8993(77)90808-3. [DOI] [PubMed] [Google Scholar]
- 22.Nusser Z, Sieghart W, Benke D, Fritschy JM, Somogyi P. Differential synaptic localization of two major gamma-aminobutyric acid type A receptor alpha subunits on hippocampal pyramidal cells. Proc Natl Acad Sci USA. 1996;93(21):11939–11944. doi: 10.1073/pnas.93.21.11939. [DOI] [PMC free article] [PubMed] [Google Scholar]
- 23.Inan M, et al. Dense and overlapping innervation of pyramidal neurons by chandelier cells. J Neurosci. 2013;33(5):1907–1914. doi: 10.1523/JNEUROSCI.4049-12.2013. [DOI] [PMC free article] [PubMed] [Google Scholar]
- 24.King AN, Manning CF, Trimmer JS. A unique ion channel clustering domain on the axon initial segment of mammalian neurons. J Comp Neurol. 2014;522(11):2594–2608. doi: 10.1002/cne.23551. [DOI] [PMC free article] [PubMed] [Google Scholar]
- 25.Thome C, et al. Axon-carrying dendrites convey privileged synaptic input in hippocampal neurons. Neuron. 2014;83(6):1418–1430. doi: 10.1016/j.neuron.2014.08.013. [DOI] [PubMed] [Google Scholar]
- 26.Stell BM, Mody I. Receptors with different affinities mediate phasic and tonic GABA(A) conductances in hippocampal neurons. J Neurosci. 2002;22(10):RC223. doi: 10.1523/JNEUROSCI.22-10-j0003.2002. [DOI] [PMC free article] [PubMed] [Google Scholar]
- 27.Semyanov A. Cell type specificity of GABA(A) receptor mediated signaling in the hippocampus. Curr Drug Targets CNS Neurol Disord. 2003;2(4):240–247. doi: 10.2174/1568007033482832. [DOI] [PubMed] [Google Scholar]
- 28.Wlodarczyk AI, et al. GABA-independent GABAA receptor openings maintain tonic currents. J Neurosci. 2013;33(9):3905–3914. doi: 10.1523/JNEUROSCI.4193-12.2013. [DOI] [PMC free article] [PubMed] [Google Scholar]
- 29.Royeck M, et al. Role of axonal NaV1.6 sodium channels in action potential initiation of CA1 pyramidal neurons. J Neurophysiol. 2008;100(4):2361–2380. doi: 10.1152/jn.90332.2008. [DOI] [PubMed] [Google Scholar]
- 30.Misonou H, et al. Bidirectional activity-dependent regulation of neuronal ion channel phosphorylation. J Neurosci. 2006;26(52):13505–13514. doi: 10.1523/JNEUROSCI.3970-06.2006. [DOI] [PMC free article] [PubMed] [Google Scholar]
- 31.Misonou H, Trimmer JS. Determinants of voltage-gated potassium channel surface expression and localization in Mammalian neurons. Crit Rev Biochem Mol Biol. 2004;39(3):125–145. doi: 10.1080/10409230490475417. [DOI] [PubMed] [Google Scholar]
- 32.Tseng WC, Jenkins PM, Tanaka M, Mooney R, Bennett V. Giant ankyrin-G stabilizes somatodendritic GABAergic synapses through opposing endocytosis of GABAA receptors. Proc Natl Acad Sci USA. 2015;112(4):1214–1219. doi: 10.1073/pnas.1417989112. [DOI] [PMC free article] [PubMed] [Google Scholar]
- 33.Karmarkar UR, Buonomano DV. Different forms of homeostatic plasticity are engaged with distinct temporal profiles. Eur J Neurosci. 2006;23(6):1575–1584. doi: 10.1111/j.1460-9568.2006.04692.x. [DOI] [PubMed] [Google Scholar]
- 34.Maffei A, Nataraj K, Nelson SB, Turrigiano GG. Potentiation of cortical inhibition by visual deprivation. Nature. 2006;443(7107):81–84. doi: 10.1038/nature05079. [DOI] [PubMed] [Google Scholar]
- 35.Hartman KN, Pal SK, Burrone J, Murthy VN. Activity-dependent regulation of inhibitory synaptic transmission in hippocampal neurons. Nat Neurosci. 2006;9(5):642–649. doi: 10.1038/nn1677. [DOI] [PubMed] [Google Scholar]
- 36.Sayin U, Osting S, Hagen J, Rutecki P, Sutula T. Spontaneous seizures and loss of axo-axonic and axo-somatic inhibition induced by repeated brief seizures in kindled rats. J Neurosci. 2003;23(7):2759–2768. doi: 10.1523/JNEUROSCI.23-07-02759.2003. [DOI] [PMC free article] [PubMed] [Google Scholar]
- 37.Dinocourt C, Petanjek Z, Freund TF, Ben-Ari Y, Esclapez M. Loss of interneurons innervating pyramidal cell dendrites and axon initial segments in the CA1 region of the hippocampus following pilocarpine-induced seizures. J Comp Neurol. 2003;459(4):407–425. doi: 10.1002/cne.10622. [DOI] [PubMed] [Google Scholar]
- 38.Kress GJ, Dowling MJ, Meeks JP, Mennerick S. High threshold, proximal initiation, and slow conduction velocity of action potentials in dentate granule neuron mossy fibers. J Neurophysiol. 2008;100(1):281–291. doi: 10.1152/jn.90295.2008. [DOI] [PMC free article] [PubMed] [Google Scholar]
- 39.Meeks JP, Mennerick S. Action potential initiation and propagation in CA3 pyramidal axons. J Neurophysiol. 2007;97(5):3460–3472. doi: 10.1152/jn.01288.2006. [DOI] [PubMed] [Google Scholar]
- 40.Schmidt-Hieber C, Jonas P, Bischofberger J. Action potential initiation and propagation in hippocampal mossy fibre axons. J Physiol. 2008;586(7):1849–1857. doi: 10.1113/jphysiol.2007.150151. [DOI] [PMC free article] [PubMed] [Google Scholar]
- 41.Stoppini L, Buchs PA, Muller D. A simple method for organotypic cultures of nervous tissue. J Neurosci Methods. 1991;37(2):173–182. doi: 10.1016/0165-0270(91)90128-m. [DOI] [PubMed] [Google Scholar]
- 42.Madisen L, et al. A robust and high-throughput Cre reporting and characterization system for the whole mouse brain. Nat Neurosci. 2010;13(1):133–140. doi: 10.1038/nn.2467. [DOI] [PMC free article] [PubMed] [Google Scholar]
- 43.Hines ML, Carnevale NT. The NEURON simulation environment. Neural Comput. 1997;9(6):1179–1209. doi: 10.1162/neco.1997.9.6.1179. [DOI] [PubMed] [Google Scholar]


