Significance
Kaposi’s sarcoma-associated herpesvirus (KSHV) is a DNA virus that is linked to several human malignancies. The cGMP-AMP synthase (cGAS) and stimulator of interferon genes (STING) pathway is able to detect KSHV during primary infection and regulates the reactivation of KSHV from latency. We screened KSHV proteins for their ability to inhibit this pathway and block IFN-β activation. One KSHV protein, vIRF1, inhibited this pathway by preventing STING from interacting with TBK1 and inhibiting STING’s phosphorylation and concomitant activation. Moreover, depletion of vIRF1 in the context of KSHV infection prevented efficient viral reactivation and replication, and increased the host IFN response to KSHV. Collectively, our results demonstrate that the modulation of this pathway is important for viral transmission and the lifelong persistence of gammaherpesviruses in the human population.
Keywords: KSHV, cGAS, STING, innate immunity, vIRF1
Abstract
Infection of cells with DNA viruses triggers innate immune responses mediated by DNA sensors. cGMP-AMP synthase (cGAS) is a key DNA sensor that produces the cyclic dinucleotide cGMP-AMP (cGAMP) upon activation, which binds to and activates stimulator of interferon genes (STING), leading to IFN production and an antiviral response. Kaposi’s sarcoma-associated herpesvirus (KSHV) is a DNA virus that is linked to several human malignancies. We report that KSHV infection activates the cGAS-STING pathway, and that cGAS and STING also play an important role in regulating KSHV reactivation from latency. We screened KSHV proteins for their ability to inhibit this pathway and identified six viral proteins that block IFN-β activation through this pathway. This study is the first report identifying multiple viral proteins encoded by a human DNA virus that inhibit the cGAS-STING DNA sensing pathway. One such protein, viral interferon regulatory factor 1 (vIRF1), targets STING by preventing it from interacting with TANK binding kinase 1 (TBK1), thereby inhibiting STING’s phosphorylation and concomitant activation, resulting in an inhibition of the DNA sensing pathway. Our data provide a unique mechanism for the negative regulation of STING-mediated DNA sensing. Moreover, the depletion of vIRF1 in the context of KSHV infection prevented efficient viral reactivation and replication, and increased the host IFN response to KSHV. The vIRF1-expressing cells also inhibited IFN-β production following infection with DNA pathogens. Collectively, our results demonstrate that gammaherpesviruses encode inhibitors that block cGAS-STING–mediated antiviral immunity, and that modulation of this pathway is important for viral transmission and the lifelong persistence of herpesviruses in the human population.
Kaposi’s sarcoma-associated herpesvirus (KSHV/HHV8) is the etiological agent of several human malignancies, including Kaposi’s sarcoma (KS), multicentric Castleman’s disease, and primary effusion lymphoma (1, 2). Evasion of the host innate immune response is essential for viral infection, replication, latency, transmission, and lifelong persistence.
A member of the gammaherpesvirus subfamily, KSHV contains a large dsDNA genome that encodes for more than 80 ORFs. Different pattern recognition receptors (PRRs), such as Toll-like receptors (TLRs), nucleotide-binding domain leucine-rich repeat-containing (NLR) proteins, and retinoic acid-inducible gene-I–like receptors (RLRs), are activated upon KSHV infection in different cell types (3–5). As is the case with many pathogens, multiple PRRs can detect an incoming pathogen in the cell. Depending on the cell type, detection of viral DNA may take place in the nucleus (6) or in the cytoplasm due to premature release of the herpesviral DNA into the cytoplasm (7). It is plausible that defective herpesvirus virions release their genomic contents into the cytoplasm rather than the nucleus and that this viral DNA triggers cytosolic DNA sensors to be activated. Additionally, HSV-1 infection induces mitochondrial stress, which results in the release of mtDNA into the cytoplasm, thereby activating the cGMP-AMP synthase (cGAS) and stimulator of interferon-dependent genes (STING) DNA sensing pathway (8).
cGAS and STING are important mediators of the innate immune response to DNA viruses. Activation of this pathway leads to the production of type I interferon (IFN) and a subsequent antiviral response. STING was identified as a critical regulator of the DNA sensing pathway (9, 10) that activates type I IFN signaling by binding foreign DNA directly (11) or through the action of sensors, such as cGAS (12–15). Upon detecting DNA from DNA viruses, including HSV-1 (12, 13), cGAS synthesizes cGMP-AMP (cGAMP), a moiety that binds to and activates STING to induce IFN (12, 13). As is the case with other pathogens, including HSV-1, it is highly plausible that multiple DNA sensing pathways can detect KSHV. It is currently not known whether the DNA sensing pathway mediated through cGAS and STING is also activated upon KSHV infection and whether viral proteins expressed by KSHV inhibit this pathway.
Results
Knockdown of cGAS and STING Reduces IFN-β Activation in Endothelial Cells During Primary Infection with KSHV.
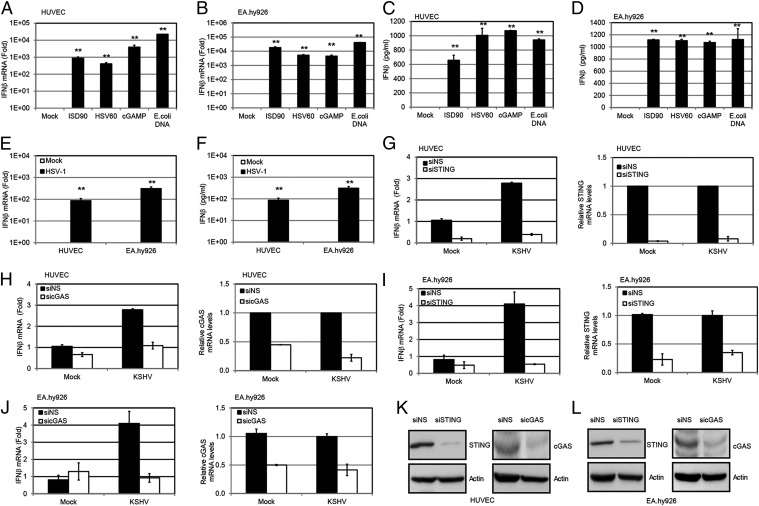
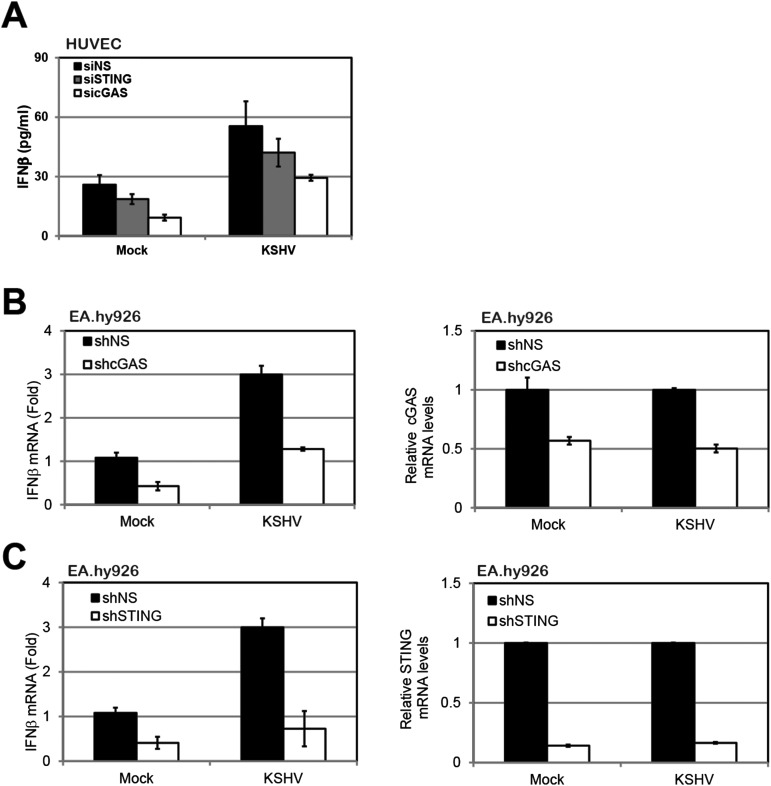
To determine whether KSHV is sensed by the cGAS-STING pathway, we first tested human umbilical vein endothelial cells (HUVECs) and EA.hy926 endothelial cells for their ability to respond to foreign DNA, because endothelial cells are physiologically relevant for KSHV infection and KS. Both HUVECs (Fig. 1A) and EA.hy926 endothelial cells (Fig. 1B) displayed activation of the DNA pathway, as measured by increased IFN-β transcription when treated with exogenous DNAs, including an IFN stimulatory DNA fragment from Listeria monocytogenes (ISD90), the HSV-1 genome (HSV60), and Escherichia coli DNA. Both HUVECs (Fig. 1C) and EA.hy926 cells (Fig. 1D) secreted IFN-β protein upon treatment with these DNAs. cGAMP itself could trigger an IFN-β response in these cell lines (Fig. 1 A–D). Moreover, both HUVECs and EA.hy926 cells mounted an IFN-β response upon HSV-1 primary infection (Fig. 1 E and F, respectively), confirming that the DNA sensing pathway is indeed active in these cells. Hence, these two endothelial cell lines were used to investigate whether the cGAS-STING pathway responded to KSHV infection. HUVECs were transfected with cGAS or STING siRNAs or a nonspecific (NS) control siRNA, and 72 h later, they were infected with KSHV. Cells were harvested at 8 h postinfection, and IFN-β mRNA levels were examined. Knockdown of either STING (Fig. 1G) or cGAS (Fig. 1H) decreased the induction of IFN-β mRNA from KSHV-infected HUVECs, as well as IFN-β protein as measured by ELISA (Fig. S1A). A similar decrease in IFN-β mRNA levels was observed in KSHV-infected EA.hy926 endothelial cells transfected with siRNAs against STING (Fig. 1I) or cGAS (Fig. 1J), or stably depleted for either STING (Fig. S1B) or cGAS (Fig. S1C). Knockdown of STING and cGAS in HUVECs and EA.hy926 cells was also confirmed by immunoblots, as shown in Fig. 1 K and L. Interestingly, KSHV infection induced only a modest IFN-β response upon primary infection of these endothelial cells, suggesting that gammaherpesviruses may encode multiple proteins that inhibit this cGAS-STING pathway (16).
Fig. 1.
KSHV primary infection can activate a STING-cGAS–dependent IFN-β response. IFN-β mRNA in HUVECs (A) or EA.hy926 endothelial cells (B) was measured by real-time qPCR 4 h after transfection of various DNA fragments (ISD90, HSV60, and E. coli DNA at 5 μg/mL) and cGAMP (5 μg/mL) with Lipofectamine 2000 (Life Technologies). The relative amount of IFN-β mRNA was normalized to the 18S ribosomal RNA level in each sample, and the fold difference between the treated and mock samples was calculated. IFN-β in HUVECs (C) or EA.hy926 endothelial cells (D) was measured by ELISA 24 h after the same treatment described in A and B. (E) HUVECs or EA.hy926 cells were infected by HSV-1 at an MOI of 10, and IFN-β mRNA levels were measured 4 h postinfection (hpi) by real-time qPCR. The relative amount of IFN-β mRNA was normalized to the 18S ribosomal RNA level in each sample, and the fold difference between the uninfected and HSV-1–infected samples was calculated. (F) HUVECs or EA.hy926 cells were infected with HSV-1 at an MOI of 10, and IFN-β protein levels were measured 24 hpi by ELISA. HUVECs were treated with NS, STING (G), or cGAS (H) siRNA for 72 h. The treated cells were then infected with KSHV (30 genome copies per cell) for 8 h before IFN-β mRNA was measured by real-time qPCR. The relative amount of IFN-β mRNA was normalized to the 18S ribosomal RNA level in each sample, and the fold difference between the siSTING or sicGAS sample compared with the siNS sample was calculated. Knockdown efficiency of STING and cGAS was monitored by real-time qPCR, and their mRNA levels were normalized to the actin mRNA level in each sample. EA.hy926 cells were treated with NS, STING (I), or cGAS (J) siRNA for 72 h. The treated cells were then infected with KSHV (30 genome copies per cell) for 8 h before IFN-β mRNA levels were measured by real-time qPCR. The relative amount of IFN-β mRNA was normalized to the 18S ribosomal RNA level in each sample, and the fold difference between the siSTING or sicGAS sample compared with the siNS sample was calculated. Knockdown efficiency of STING or cGAS was monitored by real-time qPCR, and their mRNA levels were normalized to the actin mRNA level in each sample. HUVECs (K) and EA.hy926 cells (L) were treated with NS, STING, or cGAS siRNA for 72 h. Cell lysates were harvested, and endogenous STING and cGAS were detected by Western blot analysis. Data are presented as mean ± SD from at least three independent experiments. *P < 0.05; **P < 0.01 (both by Student’s t test).
Fig. S1.
Induction of IFN-β by KSHV primary infection. (A) HUVECs were treated with NS, STING, or cGAS siRNAs for 72 h and then infected with KSHV for 24 h before performing an IFN-β ELISA. EA.hy926 cells were transduced with lentivirus-based shRNA targeting NS, STING (B), or cGAS (C). Cells were then infected with KSHV (30 DNA genome copies per cell) for 8 h before IFN-β mRNA was measured by real-time qPCR. The relative amount of IFN-β mRNA was normalized to the 18S ribosomal RNA level in each sample, and the fold difference between the siSTING or sicGAS sample compared with the siNS sample was calculated. Knockdown efficiency of STING and cGAS was monitored by real-time qPCR, and their mRNA levels were normalized to the actin mRNA level in each sample. Data are presented as mean ± SD from at least three independent experiments. *P < 0.05; **P < 0.01.
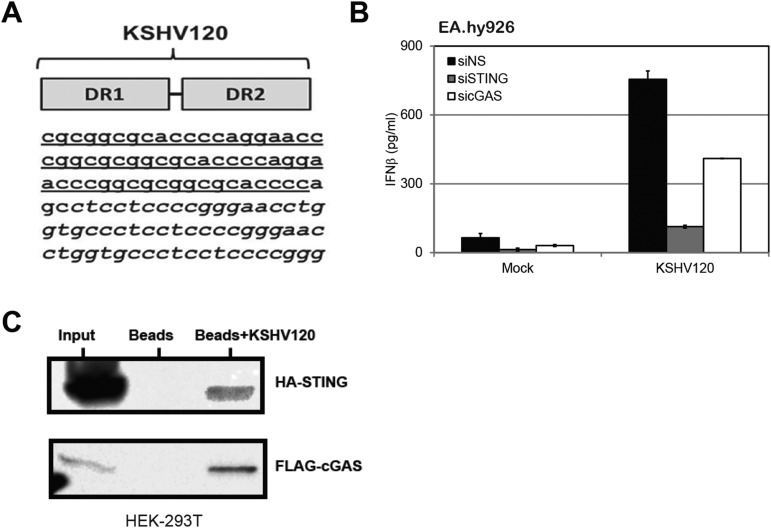
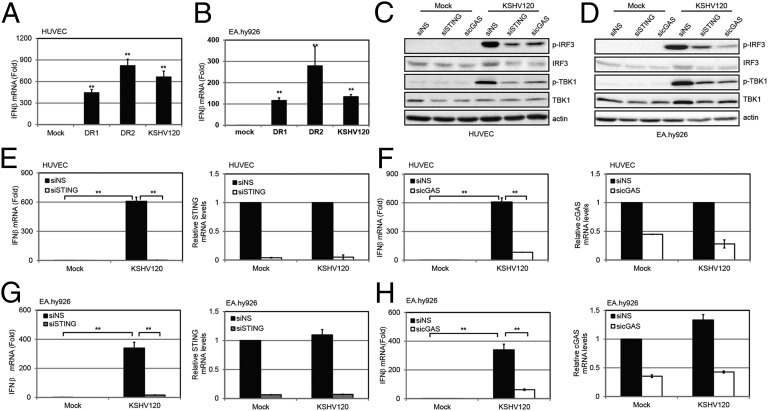
To facilitate our studies, we selected an internal repeat region within the KSHV genome to simulate activation of the cGAS-STING pathway during KSHV infection. This genomic fragment is composed of repeat sequences, direct repeat 1 (DR1) and direct repeat 2 (DR2), which were previously reported to induce an IFN response (17). We used a 120-bp dsDNA fragment (named KSHV120) containing the juxtaposed DR1 and DR2 regions (Fig. S2A) in the KSHV genome (accession no. GQ994935.1). When transfected into HUVECs or EA.hy926 cells, KSHV120 was able to induce IFN-β transcription (Fig. 2 A and B). Similar to previous studies with other DNA sensors for HSV-1 and vaccinia virus genomes in which HSV60 or 70mer from vaccinia virus (VACV70) sequences was used, respectively, we did not observe sequence specificity in the ability of KSHV120 to activate the cGAS-STING pathway. The individual DR1 or DR2 (69mer) sequences also increased IFN-β mRNA levels (Fig. 2 A and B).
Fig. S2.
Induction of IFN-β by a KSHV DNA motif. (A) Sequences of DR1, DR2, and KSHV120. (B) EA.hy926 cells treated with NS, STING, or cGAS siRNA were transfected with KSHV120 for 24 h before supernatants were collected for IFN-β ELISA. (C) HEK293T cells overexpressing HA-STING or FLAG-cGAS were lysed and pulled down with either streptavidin beads only or beads with biotin-KSHV120. Immunoblots were performed using HA or FLAG antibody accordingly. Data are presented as mean ± SD from at least three independent experiments. *P < 0.05; **P < 0.01.
Fig. 2.
KSHV DNA motif induces a STING-cGAS–dependent IFN-β response. HUVECs (A) or EA.hy926 cells (B) were transfected with DR1, DR2, or KSHV120 fragments by Lipofectamine 2000 for 4 h before IFN-β mRNA levels were measured by real-time qPCR. The relative amount of IFN-β mRNA was normalized to the 18S ribosomal RNA level in each sample, and the fold difference of the transfected samples compared with the mock sample was calculated. HUVECs (C) or EA.hy926 cells (D) treated with NS, STING, or cGAS siRNA were transfected with KSHV120 for 4 h before cells were lysed for immunoblot analysis. HUVECs were treated with NS, STING (E), or cGAS (F) siRNA for 72 h and then transfected with KSHV120 for 4 h before IFN-β mRNA levels were measured by real-time qPCR. The relative amount of IFN-β mRNA was normalized to the 18S ribosomal RNA level in each sample, and the fold difference between the siSTING or sicGAS sample compared with the siNS sample was calculated. STING or cGAS knockdown efficiency was monitored by real-time qPCR, and their mRNA levels were normalized to the actin mRNA level in each sample. EA.hy926 cells were treated with NS, STING (G), or cGAS (H) siRNA for 72 h and then transfected with KSHV120 for 4 h before IFN-β mRNA levels were measured by real-time qPCR. The relative amount of IFN-β mRNA was normalized to the 18S ribosomal RNA level in each sample, and the fold difference between the siSTING or sicGAS sample compared with the siNS sample was calculated. STING or cGAS knockdown efficiency was monitored by real-time qPCR, and their mRNA levels were normalized to the actin mRNA level in each sample. Data are presented as mean ± SD from at least three independent experiments. *P < 0.05; ** P < 0.01 (both by Student’s t test).
We next determined whether STING and cGAS were required for the increase in IFN-β induction mediated by this KSHV120 fragment mimic. Cell lysates were subjected to immunoblotting for interferon regulatory factor 3 (IRF3) and TANK binding kinase 1 (TBK1). We found that both IRF3 and TBK1 were phosphorylated and activated in response to transfection of KSHV120 into HUVECs, and that levels of phosphorylated IRF3 and TBK1 were decreased upon STING or cGAS knockdown, although the total levels of IRF3 and TBK1 remained unchanged (Fig. 2C). Similarly, phosphorylation of IRF3 and TBK1 was inhibited in KSHV120-transfected EA.hy926 cells with STING or cGAS knockdown (Fig. 2D). Consistently, knockdown of STING (Fig. 2E) or cGAS (Fig. 2F) in HUVECs reduced the induction of IFN-β mRNA levels after transfection of the KSHV120 DNA fragment. Furthermore, IFN-β protein levels were increased upon transfection of KSHV120 into EA.hy926 endothelial cells (Fig. S2B), and IFN-β transcript levels were reduced when STING or cGAS was depleted from these cells (Figs. 2 G and H). Further experiments demonstrated that KSHV120 was capable of binding to ectopically expressed STING and cGAS in HEK293T cells (Fig. S2C).
Knockdown of cGAS and STING Increases KSHV Viral Reactivation from Latency.
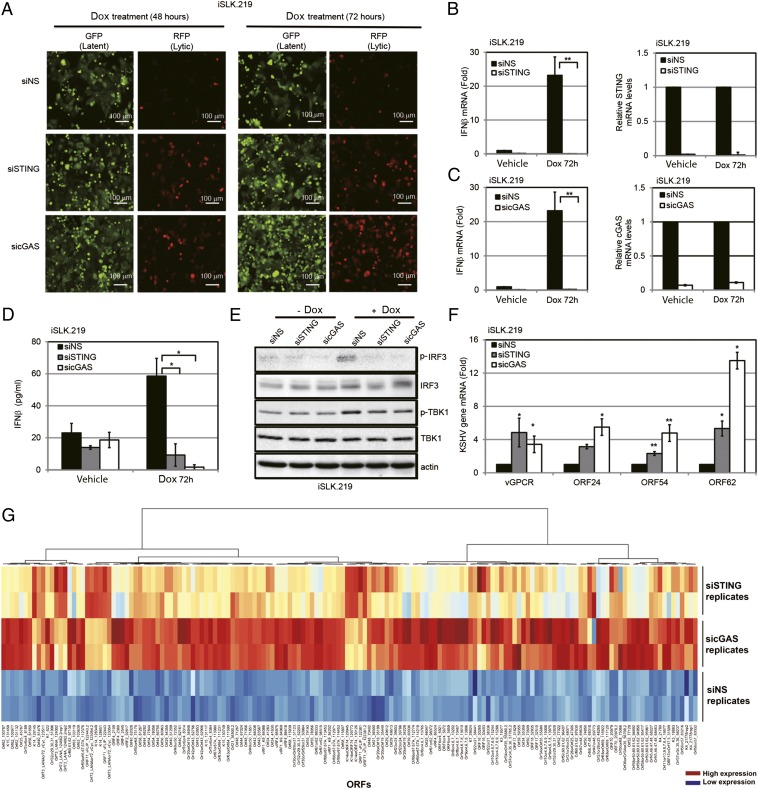
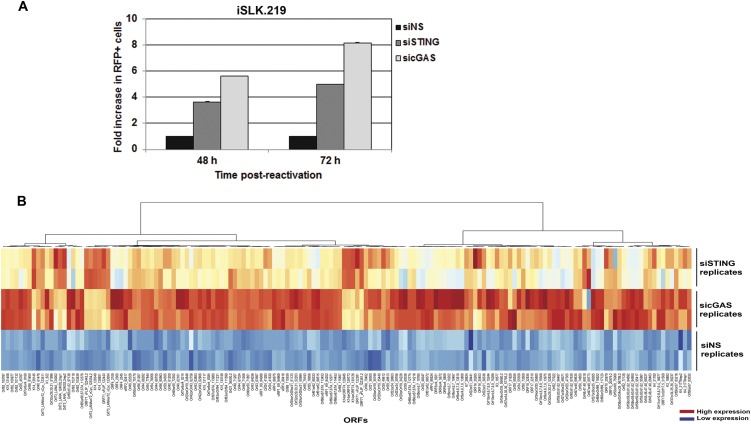
We next determined the effect of STING and cGAS on KSHV reactivation from latency, because reactivation is essential for KSHV persistence and is also likely to trigger an innate immune response. We used rKSHV.219 iSLK (iSLK.219) cells (18), which contain a latent version of the KSHV genome expressing a constitutive GFP marker and a doxycycline (Dox)-inducible version of the essential lytic transactivator protein, RTA, to enable entry into the lytic cycle. The viral genome also contains an RFP marker driven by a lytic cycle-specific promoter, which can be used to monitor lytically reactivated cells (19). The iSLK.219 cells were transfected with NS, STING, or cGAS siRNAs and reactivated from latency by Dox treatment. As shown in Fig. 3A, cells treated with Dox for 48 h and 72 h showed greater reactivation as measured by RFP expression when siRNAs against STING or cGAS were transfected into these cells compared with NS siRNA. There was a five- to eightfold increase when STING or cGAS was depleted from these cells (Fig. S3A). Upon reactivation, there was an increase in IFN-β mRNA levels in the NS siRNA-treated group (Fig. 3 B and C), indicating that reactivation of KSHV triggered an IFN-β response. By contrast, IFN-β induction was significantly suppressed in STING-depleted (Fig. 3B) or cGAS-depleted (Fig. 3C) cells. A similar trend was seen for IFN-β protein levels, as measured by ELISA (Fig. 3D). Fig. 3E demonstrates that both IRF3 and TBK1 were phosphorylated and activated in response to KSHV reactivation, and that the levels of phosphorylated IRF3 and TBK1 were decreased upon STING or cGAS knockdown in these cells, whereas the total levels of IRF3 and TBK1 were unchanged. To measure viral reactivation, several KSHV lytic genes were analyzed in reactivated cells that were transfected with NS, STING, or cGAS siRNA. As shown in Fig. 3F, there was increased lytic gene transcription following reactivation in STING- and cGAS-depleted iSLK.219 cells compared with the NS control. To determine whether viral reactivation resulted in a majority of KSHV genes being expressed, indicative of complete reactivation, we performed whole-viral genome transcriptional profiling. Knockdown of cGAS and STING led to increased transcription of virtually all KSHV viral genes upon reactivation compared with cells transfected with the NS siRNA control (Fig. 3G and Fig. S3B).
Fig. 3.
KSHV reactivation activates a cGAS-STING–dependent IFN-β response. (A) iSLK.219 cells were transfected with NS, STING, or cGAS siRNA for 72 h and then treated with Dox for various time periods. GFP and RFP were monitored at 48 h and 72 h post-Dox treatment. (B and C) IFN-β mRNA levels 72 h post-Dox treatment from A were measured by real-time qPCR. The relative amount of IFN-β mRNA was normalized to the 18S ribosomal RNA level in each sample, and the fold difference between the siSTING or sicGAS sample compared with the siNS sample was calculated. Knockdown efficiency of STING (B) or cGAS (C) was monitored by real-time qPCR, and their mRNA levels were normalized to the actin mRNA level in each sample. (D) IFN-β ELISA was performed 72 h postreactivation with Dox. (E) Immunoblot analysis of cell lysate 48 h post-Dox treatment of A. (F) RNA was extracted from iSLK.219 cells 72 h post-Dox treatment of A, transcription of KSHV viral genes was monitored using real-time qPCR, and their mRNA levels were normalized to the actin mRNA level in each sample. (G) iSLK.219 cells were treated as described in the main text. At 72 h post-Dox treatment, RNA was extracted from duplicate samples and KSHV viral transcript levels were analyzed using a KSHV real-time qPCR-based whole-genome array. mRNA levels of viral genes were normalized to the mRNA levels of multiple cellular housekeeping genes to yield delta cycle threshold (dCT) as a measure or relative expression. These values were then subjected to unsupervised clustering. A heat map and dendrogram depicted by the brackets is shown. As shown in the key, higher transcript levels are indicated by red and lower levels are indicated by blue. Data are presented as mean ± SD from at least three independent experiments. *P < 0.05; **P < 0.01 (both by Student’s t test). (Also Fig. S3B.)
Fig. S3.
Depletion of cGAS and STING augments KSHV reactivation and gene expression. (A) iSLK219 cells were transfected with NS, STING, or cGAS siRNA for 72 h and then treated with DOX for various time points. RFP-positive cells were quantitated using ImageJ (NIH). (B) iSLK219 cells were treated as described in the main text. At 72 h post-DOX treatment, total RNA was extracted and KSHV viral transcript levels were analyzed using a KSHV viral array. mRNA levels of viral genes were normalized to the mRNA levels of multiple cellular housekeeping genes. A heat map for the viral array is shown. Higher transcript levels are indicated by red, and lower levels are indicated by blue.
cGAS-STING Screen Reveals Multiple Viral Proteins That Block IFN-β Activation by the cGAS-STING Pathway.
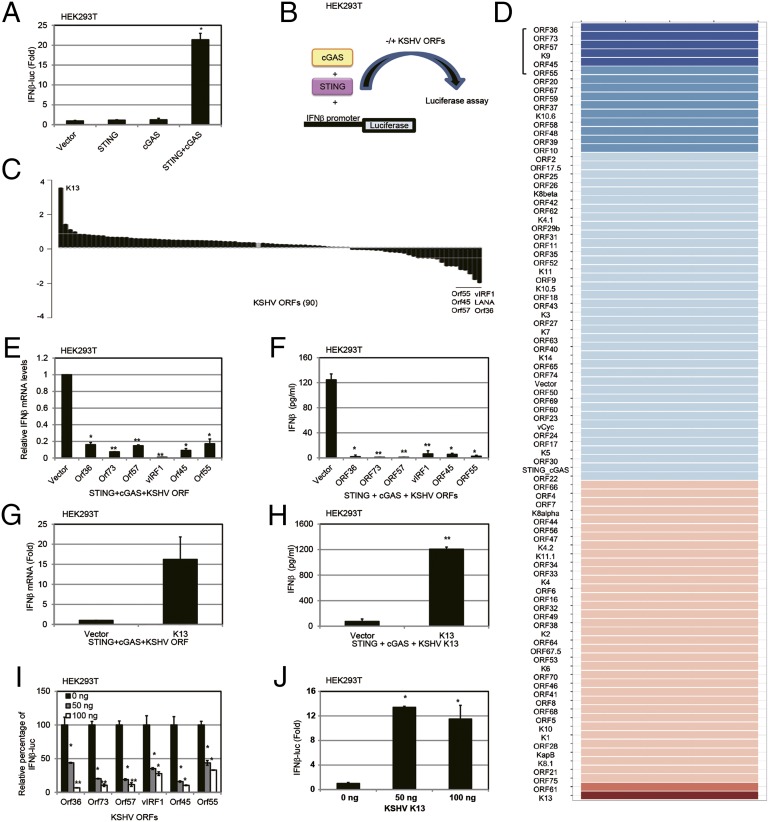
We next evaluated if individual viral genes/proteins could modulate the cGAS-STING pathway. We screened for viral proteins that inhibited IFN-β promoter activation by first developing a screening assay based on exogenous expression of cGAS and STING in HEK293T cells (13). cGAS alone failed to activate the IFN-β promoter luciferase reporter in HEK293T cells, due to lack of STING expression (Fig. 4A), as previously reported (13). Next, we ectopically expressed a minimal amount of STING in HEK293T cells without significantly inducing IFN-β (Fig. 4A). Under these conditions, either STING alone or cGAS alone failed to induce IFN-β promoter-driven luciferase activity, compared with the vector control. However, when the same amounts of STING and cGAS expression plasmids were cotransfected together with an IFN-β promoter luciferase reporter construct, the IFN-β promoter was highly activated. Using this assay, we performed a screen (Fig. 4B) to identify which KSHV genes could inhibit IFN-β activation due to activation of the STING-cGAS DNA sensing pathway. Table S1 lists the average percentage of inhibition or induction of the cGAS-STING–mediated activation of the IFN-β promoter, and Fig. 4C shows a waterfall plot of the inhibitors on one end and activators on the other end. Fig. 4D summarizes the data in a heat map indicating the modulation of the cGAS-STING pathway by the KSHV ORFs. We found six KSHV ORFs (ORF36, ORF 73, ORF57, vIRF1, ORF45, and ORF55) that could inhibit the cGAS-STING pathway between threefold and sixfold in our screen, and we validated these candidates by measuring IFN-β mRNA levels by real-time quantitative PCR (qPCR) (Fig. 4E), as well as measuring IFN-β protein levels by ELISA in HEK293T cells (Fig. 4F). Only one KSHV ORF, KSHV K13/vFLIP, activated the IFN-β promoter through the STING-cGAS–mediated pathway greater than threefold (Fig. 4G). IFN-β protein levels were also increased by KSHV K13/vFLIP, as measured by ELISA (Fig. 4H). Next, a dose–response assessment of the viral modulators was performed. Each viral inhibitor showed a dose-dependent inhibition of this pathway (Fig. 4I), whereas the activator, KSHV K13/vFLIP, showed a dose-dependent increase of this pathway (Fig. 4J). KSHV K13/vFLIP’s effects on the IFN-β promoter are likely to be mediated by NF-κB because vFLIP activates NF-κB (20). To evaluate the specific involvement of KSHV ORFs in the STING-cGAS pathway, we also tested whether the individual KSHV ORFs were directly modulating the IFN-β promoter in the absence of exogenous cGAS and STING expression. Expression plasmids for the KSHV ORFs and the IFN-β promoter luciferase were cotransfected in HEK293T cells. These data are shown in Table S2. We found that the majority of viral genes/proteins did not affect IFN-β promoter activity in the absence of exogenous STING and cGAS.
Fig. 4.
Screening of KSHV ORFs that modulate the cGAS-STING–dependent pathway. (A) HEK293T cells were cotransfected with 50 ng of IFN-β promoter luciferase and various plasmids (pCDNA3, 2.5 ng of pCDNA-STING-HA, or 50 ng of pUNO-cGAS or pCDNA-STING-HA and pUNO-cGAS combined). Luciferase activity was measured 36 h posttransfection in the cell lysates. A CMV-driven Renilla plasmid was cotransfected as a transfection control. (B) Schematic of cGAS-STING–based screening. Cells were transfected with the same amount of STING and cGAS expression plasmid, plus 100 ng of KSHV ORF expression plasmid or EV. (C) Waterfall plot of the effect of KSHV ORFs on cGAS-STING– based screening. The top six inhibitors and one activator are shown. (D) Heat map of the effect of KSHV ORFs on the cGAS-STING pathway. Higher IFN-β promoter luciferase activation levels are indicated by red, whereas lower levels are indicated by blue, which corresponds to a higher degree of inhibition. The six inhibitors are marked with a bracket. (E) Top six KSHV ORF inhibitor expression plasmids were cotransfected with STING and cGAS expression plasmids. Thirty-six hours later, IFN-β mRNA levels were measured by real-time qPCR. The relative amount of IFN-β mRNA was normalized to the 18S ribosomal RNA level in each sample, and the fold changes in IFN-β mRNA levels compared with the vector control are displayed on the y axis. (F) Top six KSHV ORF inhibitor expression plasmids were cotransfected with STING and cGAS expression plasmids, and IFN-β protein levels were measured by ELISA 36 h posttransfection. (G) K13 expression plasmid was cotransfected with STING and cGAS expression plasmids, and IFN-β mRNA levels were measured by real-time qPCR 36 h posttransfection. The relative amount of IFN-β mRNA was normalized to the 18S ribosomal RNA level in each sample, and the fold change between the K13-expressing vs. vector-expressing cells was calculated. (H) K13 was cotransfected with STING and cGAS plasmids, and IFN-β protein levels were measured by ELISA 36 h posttransfection. (I) Varying doses of the top six KSHV ORF inhibitor expression plasmids (25 ng, 50 ng, or 100 ng) were cotransfected with STING and cGAS expression plasmids, and IFN-β promoter luciferase activity was measured 36 h posttransfection. (J) Varying doses of a K13 expression plasmid (25 ng, 50 ng, or 100 ng) were cotransfected with STING and cGAS expression plasmids, and IFN-β promoter-driven luciferase activity was measured 36 h posttransfection. Data are presented as mean ± SD from at least three independent experiments. *P < 0.05; **P < 0.01 (both by Student’s t test).
Table S1.
Relative percentage of cGAS‐STING–mediated IFN-β promoter luciferase activity
| KSHV ORFs | Relative percentage of IFN-β luciferase (six biological replicates), % |
| ORF36 | 16 |
| ORF73 | 18 |
| ORF57 | 24 |
| K9 | 30 |
| ORF45 | 30 |
| ORF55 | 33 |
| ORF67 | 33 |
| ORF20 | 33 |
| ORF59 | 40 |
| ORF48 | 48 |
| ORF58 | 50 |
| K10.6 | 54 |
| ORF39 | 54 |
| ORF37 | 55 |
| ORF2 | 55 |
| ORF10 | 57 |
| ORF25 | 63 |
| ORF17.5 | 64 |
| K8β | 65 |
| ORF26 | 65 |
| ORF42 | 69 |
| K4.1 | 70 |
| ORF11 | 72 |
| ORF31 | 72 |
| ORF29b | 72 |
| ORF52 | 77 |
| ORF35 | 78 |
| K11 | 80 |
| ORF62 | 80 |
| ORF9 | 81 |
| ORF27 | 82 |
| ORF18 | 83 |
| ORF40 | 85 |
| ORF43 | 85 |
| K10.5 | 85 |
| K3 | 86 |
| ORF74 | 88 |
| K7 | 88 |
| ORF50 | 88 |
| ORF69 | 89 |
| K14 | 90 |
| ORF23 | 91 |
| ORF60 | 92 |
| ORF65 | 93 |
| EV | 94 |
| ORF24 | 96 |
| vCyclin in pCR3.1 | 97 |
| ORF30 | 99 |
| ORF22 | 100 |
| ORF66 | 102 |
| ORF63 | 103 |
| ORF7 | 103 |
| ORF47 | 104 |
| ORF44 | 105 |
| K5 | 105 |
| K8α | 109 |
| ORF49 | 110 |
| K4 | 111 |
| K4.2 | 116 |
| ORF6 | 117 |
| ORF16 | 117 |
| ORF17 | 120 |
| ORF56 | 120 |
| ORF4 | 121 |
| ORF33 | 121 |
| K2 | 122 |
| K6 | 123 |
| ORF41 | 123 |
| ORF53 | 124 |
| ORF32 | 124 |
| ORF68 | 127 |
| ORF34 | 127 |
| ORF67.5 | 128 |
| ORF46 | 128 |
| K11.1 | 129 |
| ORF8 | 130 |
| ORF64 | 135 |
| ORF5 | 136 |
| ORF70 | 139 |
| K1 | 141 |
| Kaposin B | 153 |
| K10 | 155 |
| ORF38 | 158 |
| K8.1 | 173 |
| ORF21 | 176 |
| ORF28 | 180 |
| ORF75 | 181 |
| ORF61 | 280 |
| K13 | 1,693 |
Table S2.
Relative percentage of IFN-β promoter luciferase activity without stimulation
| KSHV ORFs | Normalized activity of IFN-β promoter luciferase, % |
| EV | 100 |
| ORF36 | 41 |
| ORF2 | 63 |
| ORF42 | 64 |
| K8β | 65 |
| ORF66 | 67 |
| ORF17.5 | 68 |
| K5 | 68 |
| K10.5 | 68 |
| K11.1 | 70 |
| K11 | 70 |
| ORF25 | 72 |
| ORF20 | 72 |
| K14 | 72 |
| ORF24 | 73 |
| ORF31 | 74 |
| ORF18 | 75 |
| ORF7 | 75 |
| ORF10 | 75 |
| K10 | 77 |
| ORF30 | 77 |
| K10.6 | 77 |
| K9 | 88 |
| ORF48 | 79 |
| ORF73 | 81 |
| ORF23 | 84 |
| ORF57 | 84 |
| ORF9 | 84 |
| ORF35 | 84 |
| ORF41 | 84 |
| ORF60 | 85 |
| ORF45 | 85 |
| K3 | 85 |
| ORF37 | 86 |
| ORF29b | 86 |
| ORF22 | 87 |
| ORF43 | 88 |
| ORF70 | 88 |
| ORF40 | 89 |
| ORF4 | 89 |
| ORF69 | 90 |
| ORF32 | 91 |
| K8α | 91 |
| ORF44 | 92 |
| ORF27 | 92 |
| ORF67 | 93 |
| ORF34 | 93 |
| ORF17 | 93 |
| ORF64 | 94 |
| K4 | 94 |
| ORF26 | 94 |
| ORF38 | 94 |
| ORF33 | 96 |
| ORF21 | 96 |
| ORF47 | 96 |
| K8.1 | 96 |
| K4.1 | 96 |
| ORF65 | 97 |
| ORF5 | 98 |
| ORF62 | 98 |
| ORF61 | 98 |
| ORF67.5 | 98 |
| ORF28 | 99 |
| K4.2 | 100 |
| ORF63 | 100 |
| K6 | 101 |
| ORF75 | 101 |
| ORF8 | 101 |
| ORF46 | 102 |
| K7 | 105 |
| vCyclin in pCR3.1 | 105 |
| ORF68 | 107 |
| ORF59 | 107 |
| ORF55 | 107 |
| ORF6 | 108 |
| ORF39 | 109 |
| ORF11 | 109 |
| K2 | 112 |
| ORF53 | 112 |
| ORF50 | 114 |
| ORF58 | 116 |
| ORF52 | 117 |
| ORF56 | 118 |
| K1 | 119 |
| ORF49 | 127 |
| Kaposin B in pCR3.1 | 130 |
| ORF16 | 155 |
| ORF74 | 493 |
| K13 | 696 |
KSHV vIRF1 Inhibits STING Function by Disrupting the TBK1–STING Interaction.
The six inhibitors that suppressed IFN-β activation mediated by cGAS-STING may be able to inhibit this pathway at multiple nodes downstream of cGAS and/or STING. In this study, we focused only on one of the viral inhibitors, KSHV vIRF1/K9 (21), because vIRF1 is only encoded by KSHV, it does not have a homolog in other human herpesviruses, and we wanted to better clarify the KSHV-specific mechanism of blocking cGAS-STING–mediated innate immune responses.
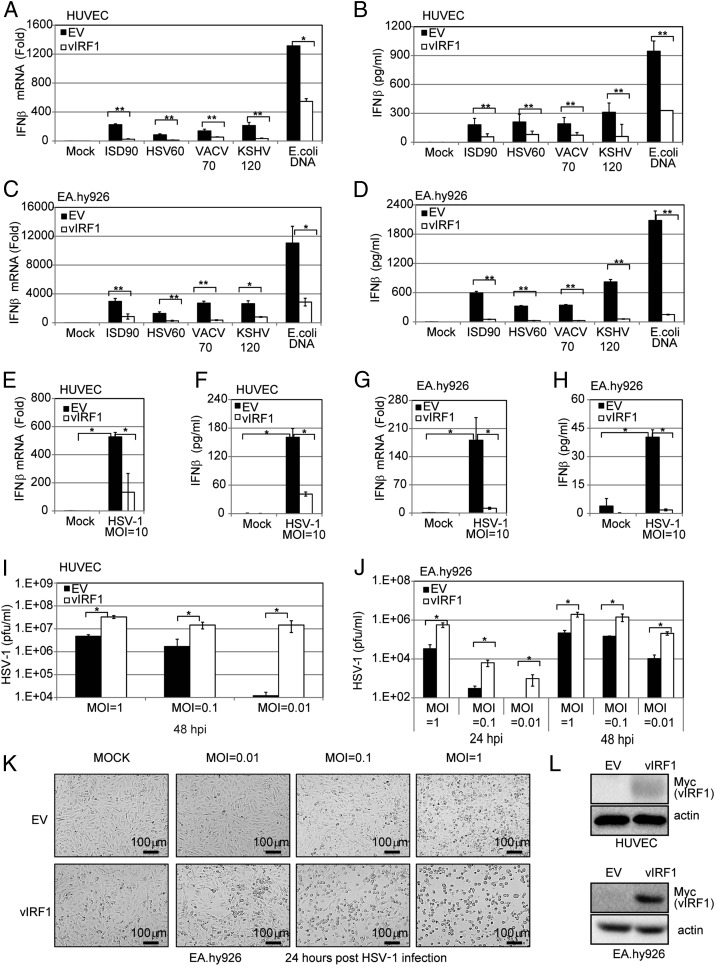
We transduced either EA.hy926 cells or HUVECs with a vIRF1-expressing lentivirus or control [empty vector (EV)] lentivirus to generate EV- or vIRF1-expressing cell lines. These EV and vIRF1 cell lines were then transfected with different DNA fragments, including ISD90, HSV60, VACV70, KSHV120, and E. coli DNA. The mRNA and protein level of IFN-β from cells transfected with these fragments was measured by real-time qPCR and ELISA. IFN-β transcription and protein levels were greatly increased in the EV cells in response to the DNA stimuli but were significantly reduced in the vIRF1-expressing HUVECs (Fig. 5 A and B), suggesting that vIRF1 was inhibiting the DNA-induced IFN pathway. Similar experiments were performed in EA.hy926 cells, and, again, vIRF1 was able to block the DNA-triggered IFN-β response (Fig. 5 C and D). We then tested whether IFN-β induction triggered by DNA virus infection was blocked in vIRF1-expressing EA.hy926 cells. We infected the EV- and vIRF1-expressing HUVECs with HSV-1 virus at a multiplicity of infection (MOI) of 10 and found that vIRF1 expression led to a reduced IFN-β response against HSV-1, compared with the control, at both the transcriptional (Fig. 5E) and protein (Fig. 5F) levels. Similar results were observed in EV- vs. vIRF1-expressing EA.hy926 cells infected with HSV-1 (Fig. 5 G and H). Concordantly, different amounts of HSV-1 (MOIs of 0.01, 0.1, and 1) showed greater replication in the vIRF1-expressing EA.hy926 cells or HUVECs compared with the vector control cells (Fig. 5 I–K). In close correlation with this result, the HSV-1 titer in the supernatants from infected vIRF1-expressing cells was much higher than the titer from the EV cells. These data provide a biological measure of attenuated IFN-β induction in vIRF1-expressing cells. vIRF1 expression was confirmed by immunoblotting (Fig. 5L).
Fig. 5.
KSHV vIRF1 inhibits cGAS-STING sensing and promotes HSV-1 replication. HUVECs or EA.hy926 endothelial cells were transduced with EV or vIRF1-expressing lentivirus to generate EV or vIRF1-expressing cells. These cells were used in the following experiments unless otherwise noted. (A) IFN-β mRNA levels in transduced HUVECs were measured by real-time qPCR 4 h posttransfection of various DNA fragments (ISD90, HSV60, VACV70, KSHV120, and E. coli DNA at 5 μg/mL). The relative amount of IFN-β mRNA was normalized to the 18S ribosomal RNA level in each sample, and the fold differences between the treated samples compared with the mock samples were calculated. (B) IFN-β protein levels in HUVEC transduced cells were measured by ELISA 24 h posttransfection of various DNA fragments (ISD90, HSV60, VACV70, KSHV120, and E. coli DNA at 5 μg/mL). (C) Transduced EA.hy926 cells were treated, and IFN-β mRNA levels were measured as in A. (D) Transduced EA.hy926 cells were treated, and IFN-β protein levels were measured as in B. (E) Transduced HUVECs were infected by HSV-1 at an MOI of 10. IFN-β mRNA levels in these cells were measured by real-time qPCR 4 hpi. The relative amount of IFN-β mRNA was normalized to the 18S ribosomal RNA level in each sample, and the fold difference between the HSV-1–infected samples compared with the uninfected mock samples was calculated. (F) Transduced HUVECs were infected by HSV-1 at an MOI of 10. IFN-β protein levels were also measured by ELISA 24 hpi. (G) Transduced EA.hy926 cells were treated and IFN-β mRNA was measured as in E. (H) Transduced EA.hy926 cells were treated and IFN-β protein levels were measured as in F. Transduced HUVECs (I) or EA.hy926 cells (J) were infected with HSV-1 at various MOIs (0.01, 0.1, or 1). At 24 or 48 hpi, supernatants were subjected to a plaque assay to obtain the HSV-1 viral titer. (K) Cells from J were monitored by bright-field microscopy 24 hpi. (L) vIRF1 protein levels were monitored by immunoblotting in HUVECs or EA.hy926 cells transduced with EV or vIRF1-expressing lentivirus. Data are presented as mean ± SD from at least three independent experiments. * P < 0.05; **P < 0.01 (both by Student’s t test).
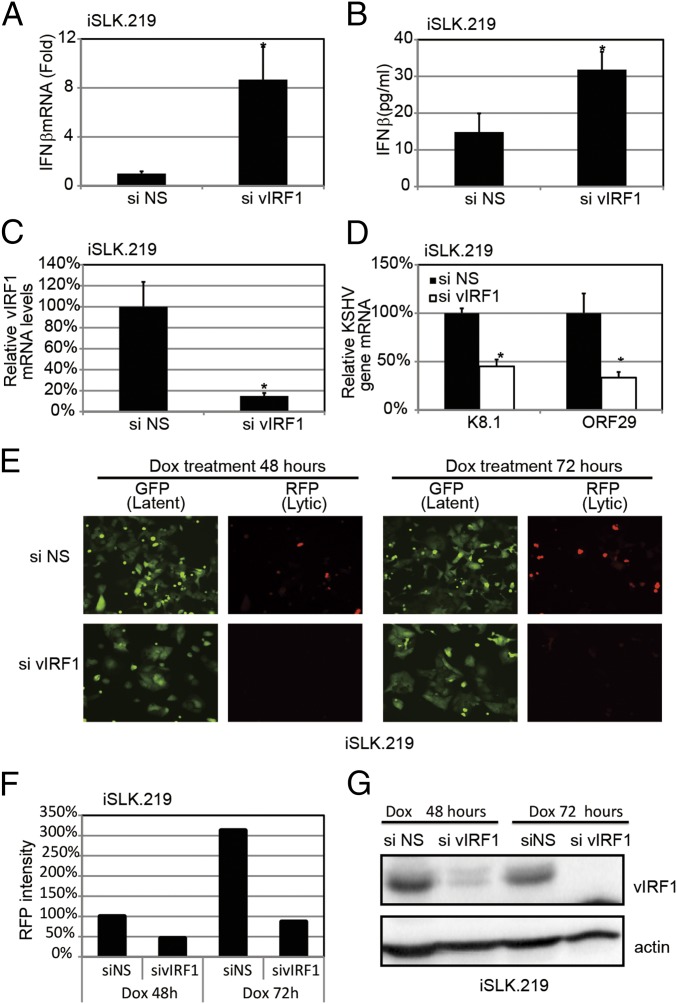
Next, we tested whether ablation of vIRF1 in KSHV-infected cells would affect KSHV replication, as well as the host immune response to KSHV infection. We used siRNA against vIRF1 (sivIRF1) to deplete vIRF1 in reactivated iSLK.219-infected cells, and we also used an NS control siRNA (siNS) (Fig. 6C). As shown in Fig. 6 A and B, knockdown of vIRF1 resulted in a higher amount of IFN-β gene expression and protein secretion in response to KSHV reactivation. Consistent with this observation, knockdown of vIRF1 also suppressed viral gene transcription and lytic viral replication, as indicated by quantitative real-time PCR (qPCR) (Fig. 6D) and red fluorescence in the reactivated iSLK.219 cells (Fig. 6 E and F). Furthermore, immunoblots of these samples confirmed endogenous vIRF1 knockdown at the protein level (Fig. 6G). Collectively, these data provide a physiological role for vIRF1 in ablating the host innate immune response during the KSHV life cycle.
Fig. 6.
Loss of KSHV vIRF1 results in elevated IFN-β production and attenuated KSHV reactivation and replication. The iSLK.219 cells were transfected with either vIRF1 or NS siRNA for 24 h and then treated with Dox for 24 h. (A) IFN-β mRNA levels were measured by qPCR. (B) IFN-β protein levels were measured by ELISA. (C) vIRF1 mRNA levels were measured by qPCR. (D) Transcription of KSHV viral genes was monitored using real-time qPCR. (E) GFP and RFP were monitored at 48 h and 72 h post-Dox treatment. (F) Average RFP intensities were calculated, and the reading of the siNS group at 48 h was set as 100%. Other groups were normalized to siNS group. (G) Immunoblot analysis of vIRF1 using cell lysate 48 h and 72 h post-Dox treatment. Data are presented as mean ± SD from at least three independent experiments. *P < 0.05; **P < 0.01 (both by Student’s t test).
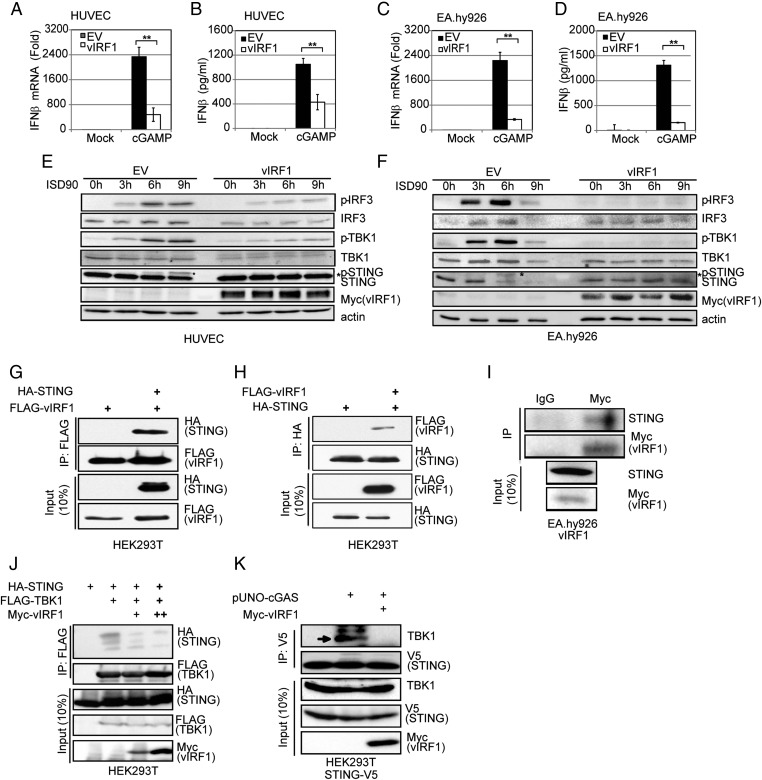
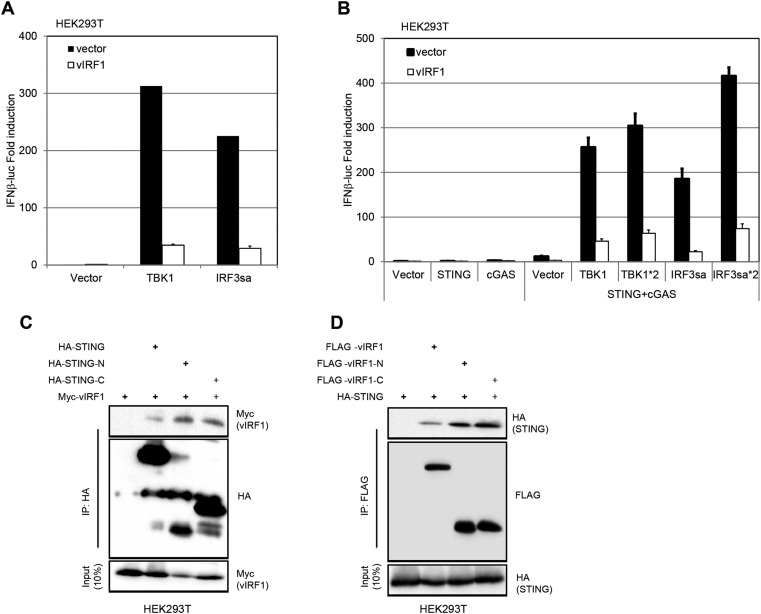
Next, we probed the mechanism of action of vIRF1 on the cGAS-STING pathway. cGAMP, the product of cGAS, activated IFN-β transcription (Fig. 7A) and protein production (Fig. 7B) in EV-expressing HUVECs, but this IFN activation was blocked in HUVECs expressing vIRF1. Similar results were seen in EV- and vIRF1-expressing EA.hy926 cells (Fig. 7 C and D). This result was seen in both EA.hy926 cell lines and HUVEC lines, suggesting that vIRF1 acted downstream of cGAS. It has been previously reported that vIRF1 can block IFN-β signaling downstream of IRF3 phosphorylation (22, 23). We cotransfected STING, cGAS, TBK1, IRF3sa (a constitutively activated form of IRF3), or a combination of these plasmids including an IFN-β promoter luciferase reporter plasmid, with either an EV- or vIRF1-expression plasmid, into HEK293T cells (Fig. S4 A and B). Thirty-six hours later, cells were harvested and luciferase activity was measured. We found that vIRF1 inhibited TBK1- or IRF3sa-triggered IFN-β luciferase activity in 293T cells, indicating that vIRF1 was able to block the cGAS-STING pathway downstream of the IRF3 phosphorylation step (Fig. S4 A and B). This result is consistent with earlier reports (22, 23).
Fig. 7.
KSHV vIRF1 inhibits the cGAS-STING DNA sensing pathway. HUVECs or EA.hy926 endothelial cells were transduced with EV or vIRF1-expressing lentivirus to generate EV- or vIRF1-expressing cells. These cells were used in the following experiments unless otherwise noted. (A) Transduced HUVECs were transfected with cGAMP (5 μg/mL) with Lipofectamine 2000 for 4 h before cells were harvested, and IFN-β mRNA levels were measured by real-time qPCR. The relative amount of IFN-β mRNA was normalized to the 18S ribosomal RNA level in each sample, and the fold difference between the cGAMP-transfected samples compared with the mock samples was calculated. (B) Transduced HUVECs were transfected with cGAMP (5 μg/mL) with Lipofectamine 2000 for 24 h before supernatants were harvested, and IFN-β protein levels were measured by ELISA. (C) Transduced EA.hy926 cells were treated, and IFN-β mRNA levels were measured as in A. (D) Transduced EA.hy926 cells were treated, and IFN-β protein levels were measured as in B. Transduced HUVECs (E) or EA.hy926 cells (F) were transfected with ISD90 for 0, 3, 6, and 9 h before harvest. Cells were lysed for immunoblot analysis. (G and H) Coimmunoprecipitation of HA-STING and FLAG-vIRF1 in HEK293T cells. HA-STING and FLAG-vIRF1 expression plasmids were cotransfected into HEK293T cells, followed by coimmunoprecipitation for STING using HA antibody or for vIRF1 using FLAG antibody. STING coimmunoprecipitates with vIRF1 (G), and vIRF1 coimmunoprecipitates with STING (H). (I) Coimmunoprecipitation of myc-vIRF1 and endogenous STING in EA.hy926-vIRF1 stable cells. Cell lysates were precipitated with anti-myc antibody and subjected to immunoblotting. (J) Coimmunoprecipitation of HA-STING and FLAG-TBK1 in HEK293T cells cotransfected with HA-STING and FLAG-TBK1 expression plasmids, with different doses of vIRF1 expression plasmid. Twenty-four hpi, protein lysates were subjected to coimmunoprecipitation and the immunoprecipitates were immunoblotted for the presence of STING, vIRF1, and TBK1 as indicated. (K) Coimmunoprecipitation of STING-V5 and endogenous TBK1 in 293T-STING-V5 stable cells in the presence or absence of myc-vIRF1. Cell lysates were precipitated with V5 antibody and subjected to immunoblotting. Data are presented as mean ± SD from at least three independent experiments. *P < 0.05; **P < 0.01 (both by Student’s t test).
Fig. S4.
Interaction of vIRF1 and STING. (A) 293T cells were transfected with the indicated plasmids and an IFN-β promoter luciferase reporter plasmid, and luciferase assays were performed 36 h after transfection. (B) 293T cells were transfected with the indicated plasmids and an IFN-β promoter luciferase reporter plasmid, and luciferase assays were performed 36 h after transfection. Forty-eight–well plates were used. Each well contained the following amounts of plasmid as labeled: IFN-β luciferase (IFNβ-luc) = 50 ng, pRL-CMV = 5 ng, STING = 2.5 ng, cGAS = 100 ng, TBK1/IRF3sa = 50 ng, and TBK1*2/IRF3sa*2 = 100 ng. (C) Coimmunoprecipitation of STING-HA mutants and myc-vIRF1 in HEK293T cells. Plasmids were cotransfected into HEK293T cells, followed by coimmunoprecipitation for STING mutants using an anti-HA antibody or for vIRF1 using an anti-myc antibody. (D) Coimmunoprecipitation (IP) of STING-HA and FLAG-vIRF1 mutants in HEK293T cells. Plasmids were cotransfected into HEK293T cells, followed by coimmunoprecipitation for STING mutants using anti-HA antibody or for vIRF1 using anti-FLAG antibody.
To determine if vIRF1 could also block a step before IRF3 phosphorylation, we stimulated the cGAS-STING pathway by ISD treatment in EV- or vIRF1-expressing EA.hy926 cells and HUVECs, and observed that phosphorylation of IRF3 and TBK1 was also inhibited in the vIRF1-expressing cells compared with EV-expressing cells, suggesting a novel mechanism of vIRF1 inhibition of this pathway (Fig. 7 E and F). Interestingly, it was previously reported that STING can be phosphorylated by TBK1 after DNA stimulation and that this phosphorylation correlated with activation and further signaling (9, 10, 15). Consistent with previous reports, we also observed phosphorylated STING running at a higher molecular weight following 6 h of ISD90 stimulation in both EA.hy926 and HUVEC control cells. However, we did not observe higher molecular weight bands for STING in cells stably expressing vIRF1, suggesting that the cGAS-STING pathway was also blocked by vIRF1 at the level of STING phosphorylation, in addition to the CBP/p300 level as previously reported (22, 23) (Fig. 7 E and F).
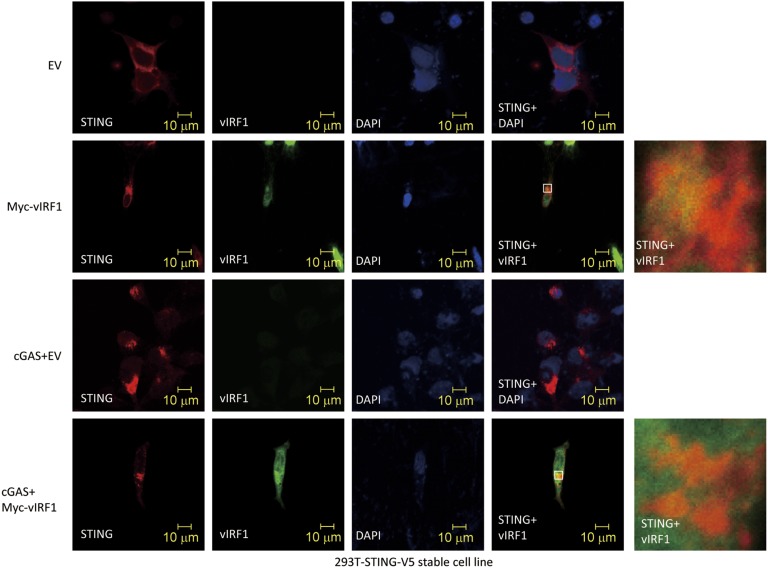
Importantly, when we ectopically coexpressed vIRF1 and STING plasmids in HEK293T cells, we found that vIRF1 pulled down STING and, reciprocally, STING coimmunoprecipitated vIRF1 (Fig. 7 G and H). We also tested the interaction between different domain mutants of vIRF1 (vIRF1-N, 1–223 aa; vIRF1-C, 200–449 aa) and STING (STING-N, 1–195 aa; STING-C, 181–379 aa) (13). It appears that multiple domains of vIRF1 and STING interact with each other when overexpressed in HEK293T cells (Fig. S4 C and D). We further confirmed the interaction between endogenous STING and stably expressed vIRF1 in EA.hy926-vIRF1–expressing cells, which is consistent with our finding in HEK293T cells (Fig. 7I). It was reported that TBK1 could directly associate with STING and phosphorylate STING (24, 25). Therefore, we tested if KSHV vIRF1, as a STING-associated protein, could disrupt the association of TBK1 and STING. We cotransfected STING and TBK1 expression plasmids in HEK293T cells with or without different amounts of vIRF1 expression plasmid (Fig. 7J). Consistent with previous reports, we were able to detect STING phosphorylation when TBK1 was overexpressed, and STING was successfully pulled down with TBK1. However, when vIRF1 was present, STING could no longer interact with TBK1. We also performed a semiendogenous coimmunoprecipitation assay for STING and TBK1 to investigate whether vIRF1 could inhibit their interaction. We made a stable V5 epitope-tagged STING HEK293 cell line and transfected pUNO-cGAS plasmid to activate the DNA sensing pathway. Cells were harvested, lysed, and subjected to coimmunoprecipitation with anti-V5 antibody. As shown in Fig. 7K, we were able to detect endogenous TBK1 being pulled down with STING. Furthermore, the interaction was disrupted in the presence of vIRF1, which is consistent with our earlier findings. Moreover, immunofluorescence data showed vIRF1 was located in both nuclear and cytosolic compartments, as previously reported (26), and partially colocalized with STING in 293T-STING-V5 cells. However, vIRF1 does not appear to block STING trafficking in HEK293T-STING-V5 cells when these cells were transfected with a cGAS expression plasmid (Fig. S5). Overall, our data suggest that by interacting with STING, vIRF1 is able to disrupt the TBK1–STING interaction and prevent STING phosphorylation and activation, which hinders innate immune activation in vIRF1-expressing cells.
Fig. S5.
vIRF1 does not block STING trafficking. vIRF1-myc and pUNO-cGAS were transfected as indicated in 293T-STING-V5 stable cells. Twenty-four hours later, cells were fixed and stained.
Discussion
Herpesviruses are readily transmitted in the human population and must encode for a number of viral proteins that allow the virus to evade innate immunity and establish lifelong persistence in the host. Depending on the cell type, detection of viral DNA may take place in the nucleus or in the cytoplasm due to premature release of the herpesviral DNA into the cytoplasm (7). It is plausible that defective herpesvirus virions release their genomic contents into the cytoplasm rather than the nucleus, triggering the activation of cytosolic DNA sensors. Additionally, herpesvirus infection has been shown to induce mitochondrial stress, which results in the release of mtDNA into the cytoplasm, thereby activating the cGAS-STING DNA sensing pathway (8). Either of these scenarios would result in activation of the cGAS-STING DNA sensing pathway in KSHV-infected cells; hence, it is plausible that viral proteins block this pathway.
We report that primary infection of endothelial cells with KSHV, as well as reactivation of KSHV from latency, results in the activation of type I IFN through a DNA sensing pathway mediated by cGAS and STING. Although the cGAS-STING pathway is activated upon KSHV infection, it is clear that the virus is still able to establish latency in cells, suggesting that the virus encodes proteins that down-regulate this pathway. To address this question, we developed and established a cGAS-STING–based assay for screening regulators of this pathway. Upon screening more than 80 KSHV viral proteins, we successfully identified a number of viral proteins that counteract the cGAS-STING pathway and inhibit IFN-β induction by affecting any step in this pathway. The steps downstream of TBK1 or IRF3 activation, for example, are shared by many other pathways, such as the RLR and TLR pathways. Thus, we cannot rule out the possibility that the candidates from this screening assay affect other pathways in addition to the cGAS-STING pathway we report here.
vIRF1 is present in both the cytoplasm and nucleus (26, 27) (Fig. S5), and we have identified it as one of the top inhibitors in our screen. vIRF1 broadly inhibited the cGAS-STING–mediated induction of IFN-β in endothelial cells. In fact, vIRF1 has previously been shown to inhibit IFN-β activation through multiple mechanisms, such as inhibiting p300 histone acetyltransferase or blocking IRF-3 recruitment of the CBP/p300 coactivators (22, 23). We examined if vIRF1 could affect STING trafficking and found that STING could still translocate to the perinuclear region even when vIRF1 was expressed, indicating that vIRF1 does not seem to affect STING translocation. Furthermore, it has been published that a point mutation at S366 of STING, which affects STING phosphorylation and IFN-β activation, does not seem to inhibit STING trafficking, suggesting that phosphorylation of STING occurs after trafficking (28). This report supports our findings that vIRF1 does not affect STING trafficking but, rather, that it might inhibit STING at a step after trafficking. Our data suggest that vIRF1 inhibits IFN-β signaling after IRF3 is phosphorylated (Fig. S4 A and B), which is in agreement with previous reports (23). However, we found that vIRF1 is also able to affect IFN-β induction in response to DNA stimulation before IRF3 phosphorylation, suggesting the existence of a distinct mechanism of vIRF1 from the previously reported recruitment of CBP/p300 (Fig. 7 E and F). Moreover, our data here show that vIRF1 can also inhibit TBK1 binding to STING. Therefore, vIRF1 is a broad inhibitor of the IFN-β response and can block the cGAS-STING–dependent DNA sensing pathway at multiple nodes in the pathway. This strategy of targeting multiple steps in an innate immune sensing pathway is a strategy shared by many viral proteins.
Importantly, we have shown that ablation of vIRF1 triggers a stronger IFN-β response and results in attenuated viral reactivation and replication. vIRF1 inhibited IFN-β production in response to multiple established inducers of the cGAS-STING pathway, such as specific DNA fragments, cGAMP, bacterial DNA, and DNA virus infection. Notably, the ability of KSHV vIRF1 to attenuate IFN responses to these DNA stimuli made vIRF1-expressing cells more susceptible to other pathogens, such as HSV-1, suggesting that KSHV could potentially modulate the host innate immune response to secondary pathogen infection.
It was previously reported that upon DNA stimulation, STING plays critical roles in recruiting both TBK1 and IRF3 (10, 15, 24). The formation of this complex facilitates TBK1 phosphorylation and activation, followed by STING and IRF3 phosphorylation by TBK1, thus leading to the activation of the IFN-β response (24, 25, 28). In our study, vIRF1 interacted with STING and significantly inhibited the binding of TBK1 to STING, as well as the TBK1-mediated phosphorylation and activation of STING, when cells were stimulated with ISD90 for up to 9 h. This result is also consistent with our findings that both TBK1 and IRF3 phosphorylation was greatly attenuated when vIRF1 was present in the cells, and that this decrease in phosphorylation of TBK1 and IRF3 is similar to the effects seen in cells depleted for STING or cGAS and transfected with KSHV120. Thus, we report that a viral protein can block STING’s interaction with TBK1 as well as TBK1-mediated STING phosphorylation, two steps that are critical for the response to pathogen infection.
In our cGAS-STING screen, we found that six KSHV ORFs could significantly suppress IFN-β promoter activity and protein levels induced by cGAS-STING activation. Although we identified multiple KSHV ORFs, only vIRF1 was further characterized in the context of the whole virus. We found that in infected cells, vIRF1 knockdown increased IFN-β protein levels approximately twofold (Fig. 6B) and decreased viral gene expression approximately twofold as well (Fig. 6D). This finding suggests that, together with vIRF1, other ORFs we found in our screen also play a role in inhibiting IFN-β even further. It is also possible that some of the hits we found are redundant with KSHV vIRF1 function while other hits might be synergistic with vIRF1 in inhibiting IFN induction. In summary, we demonstrate that the cGAS-STING pathway plays important roles in primary infection, as well as in viral reactivation of herpesviruses.
Methods
Cell Culture, Transfection, Plasmids, and Antibodies.
HEK293T cells, Vero cells [American Type Culture Collection (ATCC)], and EA.hy926 cells (from the tissue culture facility at the University of North Carolina at Chapel Hill) were grown in DMEM supplemented with FBS [10% (vol/vol)] and penicillin/streptomycin (1%). HUVECs were purchased from the ATCC and cultured in endothelial cell growth medium (EGM-2) supplied with growth factors obtained from an EGM-2 Bullet kit (Lonza). More details on cell culture, transfection, plasmids, and antibodies used in this study are provided in SI Methods. A description of siRNA and shRNA sequences is also provided in the SI Methods.
KSHV ORF Screen, Immunoblotting, and Coimmunoprecipitation Assays.
The KSHV ORF library has been previously described (29). Details on these assays are provided in SI Methods.
SI Methods
Cell Culture, Reagents, and Antibodies.
HEK293T cells, Vero cells (ATCC), and EA.hy926 cells (from the tissue culture facility from the University of North Carolina at Chapel Hill) were grown in DMEM supplemented with FBS [10% (vol/vol)] and penicillin/streptomycin (1%). HUVECs were purchased from the ATCC and cultured in EGM-2 media supplied with growth factors obtained from the EGM-2 Bullet kit. Human telomerase reverse transcriptase-immortalized HUVECs were cultured in the same EGM-2 medium supplemented with G418 (100 μg/mL) (18). iSLK.219 cells harboring latent rKSHV.219 were maintained in DMEM supplemented with 10% (vol/vol) FBS, 1% penicillin/streptomycin, G418 (250 μg/mL), hygromycin (400 μg/mL), and puromycin (10 μg/mL). All cells were maintained at 37 °C in a 5% (vol/vol) CO2 laboratory incubator subject to routine cleaning and decontamination. ISD90 (90-mer) used as dsDNA in this study was prepared as described previously (11). Canonical cGAMP (3′ to 5′ cGAMP) and E. coli genomic DNA were purchased from Invivogen. HSV60 and VACV70 were synthesized according to the previously described sequences (30). ISD90, HSV60, VACV70, KSHV DR1, KSHV DR2, and KSHV120 were reconstituted in PBS at 1 mg/mL, denatured at 65 °C for 30 min, and allowed to anneal at room temperature overnight. The sequences of KSHV-derived IFN stimulatory DNAs are as follows:
KSHV DR1 (69mer): ccgggaacctggtgccctcctccccgggaacctggtgccctcctccccgggaacctggtgccctcctcc
KSHV DR2 (69mer): cgcggcgcaccccaggaacccggcgcggcgcaccccaggaa-cccggcgcggcgcaccccaggaacccgg
KSHV120 (120mer): cgcggcgcaccccaggaacccggcgcggcgcaccccaggaacccgg-gcggcgcaccccagcctcctccccgggaacctggtgccctcctccccgggaacctggtgccctcctccccggg.
Antibodies were obtained from the following sources: rabbit anti-STING (13647), rabbit anti-IRF3 (4302), rabbit anti-TBK1 (3504), rabbit anti–p-TBK1 (5483), rabbit anti–HA-HRP (14031), FLAG-HRP (2044), and rabbit anti-V5 (13202S) (all from Cell Signaling); mouse anti c-myc–HRP (R951-25; Life Technologies); rabbit anti–p-IRF3 (76493; Abcam); and goat anti–β-actin (1615), mouse anti–c-myc (SC-40), and goat anti cGAS (sc-245858) (all from Santa Cruz Biotechnology). The antibody-conjugated systems used were EZview Red ANTI-FLAG M2 Affinity Gel and EZview Red ANTI-HA Affinity Gel (both from Sigma).
KSHV Production, Purification, and Infection.
KSHV was produced as described previously using iSLK.219 cells harboring latent rKSHV.219 (18). Briefly, cells were treated with 0.2 μg/mL Dox for 3–4 d. Cell debris was pelleted and filtered through a sterile 0.45-μm filter, followed by ultracentrifugation for 2.5 h at 100,000 × g. Supernatant was decanted, and virus pellets were resuspended in endotoxin-free PBS in 1% of the original volume.
Transfections and Lentivirus Infections.
Plasmid transfection in HEK293T cells or stimulatory DNA transfection in HUVECs or EA.hy926 cells was performed using Lipofectamine 2000 (Life Technologies) transfection reagents in Opti-MEM (Life Technologies) according to the manufacturer’s manual. HUVEC siRNA transfections were performed using a Lonza nucleofector HUVEC kit according to the manufacturer’s recommendations. EA.hy926 siRNA transfections were performed using Lipofectamine RNAiMAX reagent (Life Technologies) according to the manufacturer’s manual.
For lentiviral transductions, adherent cells were grown to 70% confluence and inoculated with lentivirus in the presence of 8 μg/mL polybrene. All transfection and transduction media were incubated for 48–72 h to allow for protein expression or knockdown.
For generating stable cell lines of shSTING, shcGAS, and vIRF1, appropriate medium with 1 μg/mL puromycin was added 72 h after lentivirus transduction for the selection. The medium was changed every 3 d, and stable cell lines were cultured in medium with 1 μg/mL puromycin to retain protein expression or knockdown. For 293T-STING-V5 generation, the same procedures were performed but using blasticidin at 10 μg/mL.
Transfection and Reactivation of iSLK.219 Cells.
The iSLK.219 cells were maintained as described above and were transfected using Lipofectamine RNAiMAX according to the manufacturer’s instructions. At 48 h posttransfection, the medium was changed to DMEM containing 1% penicillin/streptomycin, 10% (vol/vol) FBS, and 0.2 μg/mL Dox for reactivation (18). At 48 h or 72 h postreactivation, cells were collected and RNA was harvested via the RNeasy Plus Mini Kit (Qiagen) for analysis of levels of viral transcripts. Supernatant from the above samples was collected for ELISA analysis.
RNAi.
Chemically synthesized siRNA duplexes were obtained from Sigma: human NS siRNA (SIC001), human STING siRNA (SASI_Hs01_00031038), human cGAS siRNA (SASI_Hs01_00197468), and vIRF1 siRNA (5′-ATCAAGGATTGGATAGTATGT-3′). Lentivirus-based shRNA constructs were purchased from Sigma: pLKO.1-puro Non-Target shRNA Control Plasmid DNA (SHC016), human STING shRNA (TRCN0000134594): 5′-CCGGGTTTACAGCAACAGCATCTATCTCGAGATAGATGCTGTTGCTGTAAACTTTTTTG-3′, and human cGAS shRNA (TRCN0000146282): 5′-CCGGCTTTGATAACTGCGTGACATACTCGAGTATGTCACGCAGTTATCAAAGTTTTTTG-3′.
Plasmid Constructs.
pLenti-STING-V5 was obtained from General Electric Dharmacon (OHS6085_213578104). pRL-CMV renilla Vector was obtained from Promega. IFN-β promoter luciferase was a generous gift from Zhijian Chen, University of Texas Southwestern, Dallas. pUNO-IRF3sa was obtained from Invivogen. pcDNA3 vIRF1-FLAG was generated in our laboratory as described previously (21). pcDNA3 FLAG-vIRF1-N (1–224 aa) and pcDNA3 FLAG-vIRF1-C (200–449 aa) were generated in our laboratory based on a codon-optimized vIRF1 (created by Genescript and cloned into pcDNA3.1). The following primers were used for cloning: vIRF1-N (1–224 aa; forward: CGCGCCGCCACCATGGATTAC, reverse: TTGTCAGCCTTCCTGGAGCAGCCGGGC); vIRF1-C (200–449 aa; forward: TGCGTGGAGTGTGGAGTG, reverse: CTTGTCATCATCGTCCTTGTAATC), HA-STING, STING-HA-N (1–195 aa) and STING-HA-C (181-379 aa) (provided by G.N.B.) (13), pUNO1-hcGAS (Invivogen), and pUNO1-hcGAS-FLAG [generated based on the pUNO1-hcGAS plasmid, using a Q5 Site-Directed Mutagenesis Kit (New England Biolabs)]. The following primers were used: forward, AAAGACGATGACGACAAGTGACCTAGGTCTAGCTGG; reverse, GTAGTCAGAACCACCACCAAATTCATCAAAAACTGGAAACTC.
Real-Time qPCR.
Total RNA was isolated using an RNeasy RNA Extraction Kit (Qiagen), and cDNA synthesis was performed using an iScript cDNA Synthesis Kit (Bio-Rad) according to the manufacturers’ protocols. Real-time qPCR was performed using a ViiA 6 Real-Time PCR System and TaqMan Gene Expression Assays: hIFN-β (Hs00185375). The relative amount of IFN-β mRNA was normalized to the 18S ribosomal RNA level in each sample, and the fold difference between the treated and mock samples was calculated. Alternatively, an SYBR green assay from Bio-Rad was used for human sting and cgas, as well as for detection of some KSHV ORFs. Primers used for SYBR green were as follows:
human STING: 5′- GAGCAGGCCAAACTCTTCTG-3′, 5′TGCCCACAGTAACCTCTTCC-3′
human cGAS: 5′-ATGCAAAGGAAGGAAATGGT-3′, 5′-TTTAAACAATCTTTCCTGCAACA-3′
human actin: 5′-AAGACCTGTACGCCAACACA-3′, 5′-AGTACTTGCGCTCAGGAGGA-3′
vGPCR: 5′-CAGTGTTGTGTGCGTCAGTC-3′, 5′-ATGTTTCCCGCGTTCTCATA-3′
ORF24: 5′-CTGCACTTTCTCTTCGCAAT-3′, 5′-GACACGTTTAGCCCATCCTT-3′
ORF54: 5′-CAACATCTGCCTGTCTGCTT-3′, 5′-ATCGCCCCAATGCTAGAG-3′
ORF62: 5′-GTGTGTGGTACGGAAGTGGA-3′, 5′-AGGGTCAAGCCTACGTGTG-3′.
KSHV ORF Screen.
The KSHV ORF library has been described previously (29). The plasmids in the library are listed in Table S1.
Briefly, HEK293T cells were seeded on 48-well plates and were transiently transfected in each well with 2.5 ng of STING-HA, 50 ng of pUNO1-cGAS, and 50 ng of pIFN-β luciferase, together with a total of 100 ng of various expression plasmids or EV expression control plasmid. As an internal control, 10 ng of pRL-CMV plasmids expressing Renilla protein was transfected simultaneously. Thirty-six hours later, cells were lysed by adding passive lysis buffer at a rate of 80 μL per well, and luciferase activities of firefly and Renilla in the total cell lysate were measured using a luminometer.
Immunoblotting, Coimmunoprecipitation, and DNA Pull-Down Assay.
Cells were lysed in radioimmunoprecipitation assay buffer on ice, followed by centrifugation. Cell lysates were separated by SDS/PAGE, transferred to PVDF membranes and subjected to immunoblotting. For coimmunoprecipitation, expression vectors were transfected into HEK293T cells for 36–48 h, cells were lysed in ice-cold Nonidet P-40 immunoprecipitation buffer [50 mM Tris (pH 8.0), 150 mM NaCl, 0.5% Nonidet P-40, 50 mM NaF, 0.1 mM Na3VO4, 1 mM DTT] with a protease inhibitor tablet, and cell lysates were then precipitated with an appropriate amount of EZview Red ANTI-FLAG M2 Affinity Gel or EZview Red ANTI-HA Affinity Gel overnight at 4 °C. The next day, beads were washed with lysis buffer three times and boiled in an appropriate amount of 2× sample buffer before being analyzed by SDS/PAGE. A DNA pull-down assay was performed using the same Nonidet P-40 lysis buffer and method. Cell lysates were incubated with biotin-labeled DNA for 3 h before being precipitated with streptavidin beads. All precipitates were washed with lysis buffer three times, and proteins were released by 2× sample buffer after boiling and being analyzed by SDS/PAGE.
ELISA.
ELISAs for human IFN-β were performed using supernatants from cells in which values are expressed as picograms per milliliter ± SD as calculated from a standard curve derived from recombinant IFN-β provided in the ELISA kit (PBL Interferon Source; Life Technologies).
HSV-1 Plaque Assay.
HSV-1 (KOS strain) was obtained from the ATCC and propagated in Vero cells. The lentivirus-based EV- or vIRF1-transduced EA.hy926 cells or HUVECs were infected with HSV-1 (MOIs of 0.01, 0.1, and 1) for 24 h or 48 h. Supernatants from infected cells were harvested for plaque assay. Briefly, Vero cells were incubated with the supernatants from the above samples for 1 h, and the medium was then changed to regular medium. The cells were cultured in 0.3% methylcellulose containing DMEM for 3 d and then stained with 0.8% crystal violet in 50% (vol/vol) EtOH solution before plaque counting.
qPCR Viral Array.
We used a real-time qPCR array specifically to quantify all KSHV mRNAs. Briefly, 192 primer pairs were included to target multiple regions toward the 3′ end of each annotated ORF. Multiple reference genes for cellular transcripts were included for normalization. The array results in amplification reactions with similar efficiencies and annealing temperatures, and thus allows us to compare the expression levels directly among different mRNAs. The qPCR arrays were plated in 384-well plates using a Tecan Freedom Evo liquid handling robot and cycled using Roche LightCycler 480, as previously described. A detailed step-by-step protocol is available at www.med.unc.edu/vironomics/protocols.
Immunofluorescent Staining.
The 293T-STING-V5 cells were transfected with plasmids for 24 h. Cells were then fixed and stained as previously described (12).
Statistical Analysis.
The statistical significance of differences in cytokine levels, mRNA levels, viral titers, and luciferase intensity in reporter assay was determined using the Student’s t test (*P < 0.05; **P < 0.01).
Acknowledgments
We thank Dr. Gary Hayward (Johns Hopkins University) and Drs. Yuan Chang and Patrick Moore (University of Pittsburgh) for kindly providing us with the KSHV vIRF1 antibodies. We thank Marcia Sanders for technical assistance and Alex Petrucelli for helpful discussions. This work was supported by NIH Grants DE018281, AI107810, AI109965, and CA096500 (to B.D.); NIH Grants DE023946 and CA019014 (to D.P.D.), and NIH Grants CA160556 and CA136367 (to B.A.G.). B.D. is a Leukemia and Lymphoma Society Scholar, and B.D. and B.A.G. are both Burroughs Wellcome Fund Investigators in the Pathogenesis of Infectious Diseases Award.
Footnotes
The authors declare no conflict of interest.
This article is a PNAS Direct Submission.
This article contains supporting information online at www.pnas.org/lookup/suppl/doi:10.1073/pnas.1503831112/-/DCSupplemental.
References
- 1.Cesarman E, Chang Y, Moore PS, Said JW, Knowles DM. Kaposi’s sarcoma-associated herpesvirus-like DNA sequences in AIDS-related body-cavity-based lymphomas. N Engl J Med. 1995;332(18):1186–1191. doi: 10.1056/NEJM199505043321802. [DOI] [PubMed] [Google Scholar]
- 2.Chang Y, et al. Identification of herpesvirus-like DNA sequences in AIDS-associated Kaposi’s sarcoma. Science. 1994;266(5192):1865–1869. doi: 10.1126/science.7997879. [DOI] [PubMed] [Google Scholar]
- 3.Gregory SM, et al. Discovery of a viral NLR homolog that inhibits the inflammasome. Science. 2011;331(6015):330–334. doi: 10.1126/science.1199478. [DOI] [PMC free article] [PubMed] [Google Scholar]
- 4.West JA, Gregory SM, Damania B. Toll-like receptor sensing of human herpesvirus infection. Front Cell Infect Microbiol. 2012;2:122. doi: 10.3389/fcimb.2012.00122. [DOI] [PMC free article] [PubMed] [Google Scholar]
- 5.West JA, et al. An important role for mitochondrial antiviral signaling protein in the Kaposi’s sarcoma-associated herpesvirus life cycle. J Virol. 2014;88(10):5778–5787. doi: 10.1128/JVI.03226-13. [DOI] [PMC free article] [PubMed] [Google Scholar]
- 6.Kerur N, et al. IFI16 acts as a nuclear pathogen sensor to induce the inflammasome in response to Kaposi Sarcoma-associated herpesvirus infection. Cell Host Microbe. 2011;9(5):363–375. doi: 10.1016/j.chom.2011.04.008. [DOI] [PMC free article] [PubMed] [Google Scholar]
- 7.Horan KA, et al. Proteasomal degradation of herpes simplex virus capsids in macrophages releases DNA to the cytosol for recognition by DNA sensors. J Immunol. 2013;190(5):2311–2319. doi: 10.4049/jimmunol.1202749. [DOI] [PMC free article] [PubMed] [Google Scholar]
- 8.West AP, et al. Mitochondrial DNA stress primes the antiviral innate immune response. Nature. 2015;520(7548):553–557. doi: 10.1038/nature14156. [DOI] [PMC free article] [PubMed] [Google Scholar]
- 9.Ishikawa H, Barber GN. STING is an endoplasmic reticulum adaptor that facilitates innate immune signalling. Nature. 2008;455(7213):674–678. doi: 10.1038/nature07317. [DOI] [PMC free article] [PubMed] [Google Scholar]
- 10.Ishikawa H, Ma Z, Barber GN. STING regulates intracellular DNA-mediated, type I interferon-dependent innate immunity. Nature. 2009;461(7265):788–792. doi: 10.1038/nature08476. [DOI] [PMC free article] [PubMed] [Google Scholar]
- 11.Abe T, et al. STING recognition of cytoplasmic DNA instigates cellular defense. Mol Cell. 2013;50(1):5–15. doi: 10.1016/j.molcel.2013.01.039. [DOI] [PMC free article] [PubMed] [Google Scholar]
- 12.Ablasser A, et al. cGAS produces a 2′-5′-linked cyclic dinucleotide second messenger that activates STING. Nature. 2013;498(7454):380–384. doi: 10.1038/nature12306. [DOI] [PMC free article] [PubMed] [Google Scholar]
- 13.Sun L, Wu J, Du F, Chen X, Chen ZJ. Cyclic GMP-AMP synthase is a cytosolic DNA sensor that activates the type I interferon pathway. Science. 2013;339(6121):786–791. doi: 10.1126/science.1232458. [DOI] [PMC free article] [PubMed] [Google Scholar]
- 14.Liang Q, et al. Crosstalk between the cGAS DNA sensor and Beclin-1 autophagy protein shapes innate antimicrobial immune responses. Cell Host Microbe. 2014;15(2):228–238. doi: 10.1016/j.chom.2014.01.009. [DOI] [PMC free article] [PubMed] [Google Scholar]
- 15.Liu S, et al. Phosphorylation of innate immune adaptor proteins MAVS, STING, and TRIF induces IRF3 activation. Science. 2015;347(6227):aaa2630. doi: 10.1126/science.aaa2630. [DOI] [PubMed] [Google Scholar]
- 16.Sun C, et al. Evasion of innate cytosolic DNA sensing by a gammaherpesvirus facilitates establishment of latent infection. J Immunol. 2015;194(4):1819–1831. doi: 10.4049/jimmunol.1402495. [DOI] [PMC free article] [PubMed] [Google Scholar]
- 17.Sanchez DJ, et al. A repetitive region of gammaherpesvirus genomic DNA is a ligand for induction of type I interferon. J Virol. 2008;82(5):2208–2217. doi: 10.1128/JVI.01718-07. [DOI] [PMC free article] [PubMed] [Google Scholar]
- 18.Myoung J, Ganem D. Generation of a doxycycline-inducible KSHV producer cell line of endothelial origin: Maintenance of tight latency with efficient reactivation upon induction. J Virol Methods. 2011;174(1-2):12–21. doi: 10.1016/j.jviromet.2011.03.012. [DOI] [PMC free article] [PubMed] [Google Scholar]
- 19.Vieira J, O’Hearn PM. Use of the red fluorescent protein as a marker of Kaposi’s sarcoma-associated herpesvirus lytic gene expression. Virology. 2004;325(2):225–240. doi: 10.1016/j.virol.2004.03.049. [DOI] [PubMed] [Google Scholar]
- 20.Liu L, et al. The human herpes virus 8-encoded viral FLICE inhibitory protein physically associates with and persistently activates the Ikappa B kinase complex. J Biol Chem. 2002;277(16):13745–13751. doi: 10.1074/jbc.M110480200. [DOI] [PubMed] [Google Scholar]
- 21.Jacobs SR, et al. The viral interferon regulatory factors of kaposi’s sarcoma-associated herpesvirus differ in their inhibition of interferon activation mediated by toll-like receptor 3. J Virol. 2013;87(2):798–806. doi: 10.1128/JVI.01851-12. [DOI] [PMC free article] [PubMed] [Google Scholar]
- 22.Li M, et al. Inhibition of p300 histone acetyltransferase by viral interferon regulatory factor. Mol Cell Biol. 2000;20(21):8254–8263. doi: 10.1128/mcb.20.21.8254-8263.2000. [DOI] [PMC free article] [PubMed] [Google Scholar]
- 23.Lin R, et al. HHV-8 encoded vIRF-1 represses the interferon antiviral response by blocking IRF-3 recruitment of the CBP/p300 coactivators. Oncogene. 2001;20(7):800–811. doi: 10.1038/sj.onc.1204163. [DOI] [PubMed] [Google Scholar]
- 24.Zhong B, et al. The adaptor protein MITA links virus-sensing receptors to IRF3 transcription factor activation. Immunity. 2008;29(4):538–550. doi: 10.1016/j.immuni.2008.09.003. [DOI] [PubMed] [Google Scholar]
- 25.Tanaka Y, Chen ZJ. STING specifies IRF3 phosphorylation by TBK1 in the cytosolic DNA signaling pathway. Sci Signal. 2012;5(214):ra20. doi: 10.1126/scisignal.2002521. [DOI] [PMC free article] [PubMed] [Google Scholar]
- 26.Sander G, et al. Intracellular localization map of human herpesvirus 8 proteins. J Virol. 2008;82(4):1908–1922. doi: 10.1128/JVI.01716-07. [DOI] [PMC free article] [PubMed] [Google Scholar]
- 27.Choi YB, Sandford G, Nicholas J. Human herpesvirus 8 interferon regulatory factor-mediated BH3-only protein inhibition via Bid BH3-B mimicry. PLoS Pathog. 2012;8(6):e1002748. doi: 10.1371/journal.ppat.1002748. [DOI] [PMC free article] [PubMed] [Google Scholar]
- 28.Konno H, Konno K, Barber GN. Cyclic dinucleotides trigger ULK1 (ATG1) phosphorylation of STING to prevent sustained innate immune signaling. Cell. 2013;155(3):688–698. doi: 10.1016/j.cell.2013.09.049. [DOI] [PMC free article] [PubMed] [Google Scholar]
- 29.Davis ZH, et al. Global mapping of herpesvirus-host protein complexes reveals a transcription strategy for late genes. Mol Cell. 2015;57(2):349–360. doi: 10.1016/j.molcel.2014.11.026. [DOI] [PMC free article] [PubMed] [Google Scholar]
- 30.Unterholzner L, et al. IFI16 is an innate immune sensor for intracellular DNA. Nat Immunol. 2010;11(11):997–1004. doi: 10.1038/ni.1932. [DOI] [PMC free article] [PubMed] [Google Scholar]


