

Significance
Complement activation contributes to host defense and immunopathology. We recently discovered that membrane attack complexes (MAC), the terminal effector mechanisms of complement, activate proinflammatory functions in human endothelial cells (ECs) via noncanonical NF-ΚB signaling. Here we elucidate the initial steps of how MACs activate this pathway. MACs formed on the surface of human ECs are rapidly internalized via clathrin-mediated endocytosis into Rab5+ endosomes, which subsequently recruit activated Akt in a Rab5-dependent manner. Akt recruitment results in NIK protein stabilization on the surface of the endosome within 30 min, initiating noncanonical NF-ΚB signaling. MAC internalization in ECs lining human coronary arteries in vivo similarly activates noncanonical NF-ΚB signaling. Our findings suggest new therapeutic targets for controlling complement-mediated inflammation.
Keywords: inflammation, signaling, endothelial cell, complement, membrane attack complex
Abstract
Complement membrane attack complexes (MACs) promote inflammatory functions in endothelial cells (ECs) by stabilizing NF-κB–inducing kinase (NIK) and activating noncanonical NF-κB signaling. Here we report a novel endosome-based signaling complex induced by MACs to stabilize NIK. We found that, in contrast to cytokine-mediated activation, NIK stabilization by MACs did not involve cIAP2 or TRAF3. Informed by a genome-wide siRNA screen, instead this response required internalization of MACs in a clathrin-, AP2-, and dynamin-dependent manner into Rab5+endosomes, which recruited activated Akt, stabilized NIK, and led to phosphorylation of IκB kinase (IKK)-α. Active Rab5 was required for recruitment of activated Akt to MAC+ endosomes, but not for MAC internalization or for Akt activation. Consistent with these in vitro observations, MAC internalization occurred in human coronary ECs in vivo and was similarly required for NIK stabilization and EC activation. We conclude that MACs activate noncanonical NF-κB by forming a novel Akt+NIK+ signalosome on Rab5+ endosomes.
The complement system contributes to both host defense and immunopathology (1). Using serum with high-titer panel reactive antibody (PRA) from sensitized transplant candidates as a source of complement-fixing human anti-HLA alloantibodies, we identified noncanonical NF-κB signaling as a novel effector pathway used by complement membrane attack complexes (MACs) to induce proinflammatory changes in endothelial cells (ECs) that resulted in increased recruitment and activation of alloreactive effector memory T cells (2).
Noncanonical NF-κB signaling is generally initiated by ligand engagement of TNF receptor (TNFR) superfamily members (3, 4). In the absence of ligand, NF-κB–inducing kinase (NIK) protein is persistently translated and sequestered into a complex containing cIAP1, cIAP2, TRAF2, and TRAF3, where it is polyubiquitinylated by cIAP2 and targeted for proteasomal degradation (5). Following ligand activation, TRAF3 along with its associated proteins are recruited to the cytoplasmic tail of the activated receptor (5–7), where the ubiquitin ligase activity of cIAP2 is diverted away from NIK to TRAF3 (8), causing degradation of TRAF3 accompanied by release and stabilization of NIK, which initiates signaling. In this sequence, TRAF3 degradation is necessary and sufficient for NIK accumulation (9, 10). In contrast to canonical NF-κB activation by TNF-α or IL-1, which occurs rapidly within 15 min, noncanonical signaling typically requires ∼8 h for initial detection (11). Here we demonstrate that MAC stabilization of NIK occurs within 30 min independent of the cIAP2-TRAF3–containing signalosome, and that furthermore, an endosome-based Akt- and Rab5-dependent signaling mechanism mediates NIK stabilization by MACs.
Results
Stabilization of NIK by MACs Occurs Rapidly and Independently of cIAP2-TRAF3 Signalosome Formation.
We recently reported that cultured human umbilical vein ECs treated with high-titer PRA from sensitized transplant candidates selectively activated noncanonical but not canonical NF-κB signaling in a mechanism requiring formation of MACs (2). We compared noncanonical NF-κB activation by PRA with LIGHT, a cytokine activator of this pathway (12, 13). As expected, LIGHT caused a gradual increase in NIK (Fig. 1A), concurrent with cIAP2 induction and TRAF3 degradation (12). In contrast, PRA up-regulated NIK within 30 min without TRAF3 degradation (Fig. 1A). NIK induction occurred posttranscriptionally as NIK mRNA levels were unchanged (Fig. S1A), and NIK protein was decreased by inhibition of protein synthesis (Fig. S1B). Consistent with our previous results (2), NIK-dependent inflammatory genes were unaffected in human umbilical vein ECs (HUVECs) following siRNA-mediated knockdown of p65, but were reduced with NIK or RelB siRNA (Fig. S1C).
Fig. 1.
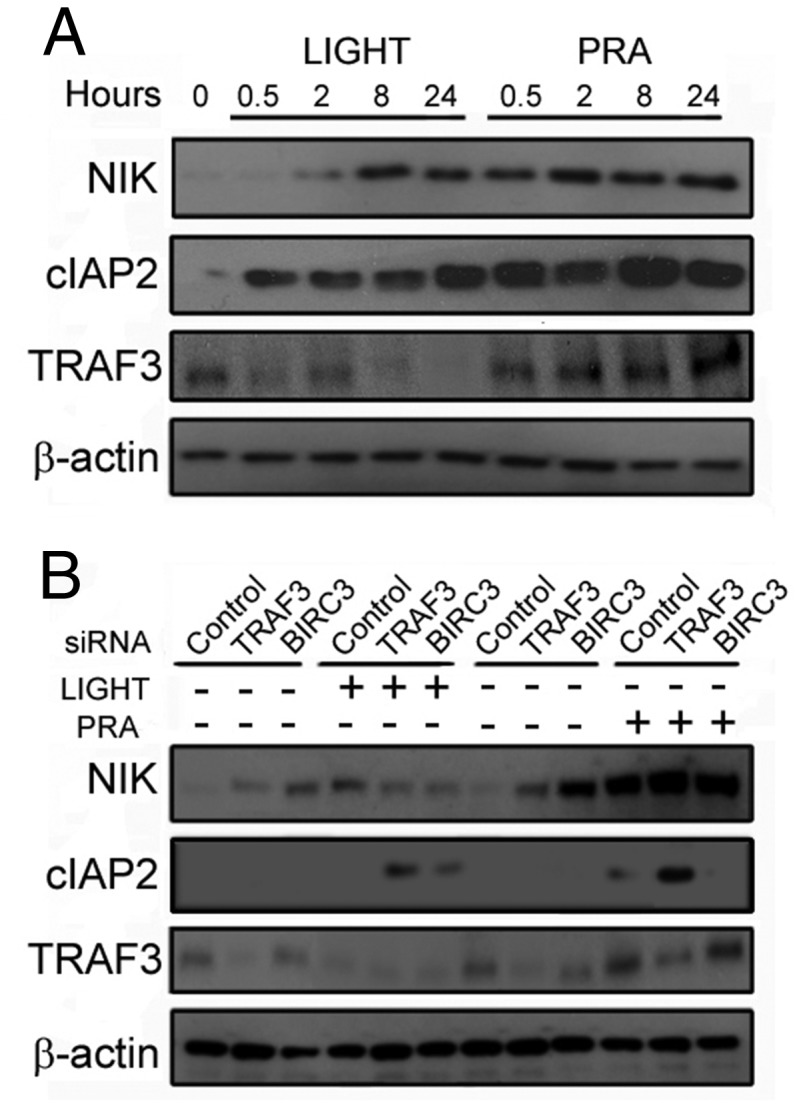
Stabilization of NIK by MACs occurs rapidly and independently of cIAP2-TRAF3 signalosome formation. (A) ECs were stimulated with LIGHT (100 ng/mL) or PRA (1:5 dilution) for the indicated times. (B) HUVECs were treated with control, TRAF3, or cIAP2 (BIRC3) siRNA and treated with either LIGHT for 24 h or PRA for 4 h. Each experiment was repeated two to five times, with similar results.
Fig. S1.

MAC-dependent induction of NIK requires protein synthesis, and MAC-dependent induction of inflammatory genes requires noncanonical NF-κB transcription factors. (A) NIK mRNA transcript was measured by real-time qRT-PCR at various times after PRA treatment. (B) NIK protein was assessed following treatment of ECs with LIGHT (100 ng/mL) or PRA (1:5 dilution) for 24 h or 4 h, respectively, in the presence or absence of cyclohexamide, a protein synthesis inhibitor. (C) Induction of NIK-dependent inflammatory genes was assessed in ECs containing control, p65, NIK, or RelB siRNA. Results are expressed in cycle time normalized to GAPDH expression, where a decrease in cycle time by x indicates an increase in gene expression by 2x. Experiments were repeated two to three times, with similar results.
We then compared the effects of NIK stabilization by LIGHT and PRA following siRNA-mediated knockdown of TNFR superfamily-associated signalosome components. Consistent with previous reports (9, 10), knockdown of TRAF3 or cIAP2 (BIRC3) was sufficient to stabilize NIK in the absence of ligand (Fig. 1B, top row, lanes 2, 3, 8, and 9). NIK protein expression induced by knockdown of TRAF3 or cIAP2 was not enhanced by the addition of LIGHT (Fig. 1B, top row, lane 2 vs. lane 5 and lane 3 vs. lane 6, respectively), suggesting that knockdown of these components and LIGHT affect the same pathway. In contrast, PRA robustly augmented NIK levels in ECs lacking TRAF3 or cIAP2 (Fig. 1B, top row, lane 8 vs. lane 11 and lane 9 vs. lane 12, respectively). Of note, at the time point examined, cIAP2, but not TRAF3, protein expression was actually increased by LIGHT as well as PRA treatments, consistent with previous reports indicating that cIAP2 is transcriptionally induced in response to noncanonical NF-κB activation (11). Taken together, these data suggest that the cIAP2-TRAF2-TRAF3 signalosome is not involved in the stabilization of NIK induced by MAC.
A Genome-Wide siRNA Screen Identifies Endocytosis and Vesicular Trafficking Genes Involved in MAC-Induced NIK Stabilization.
To elucidate alternative mechanism(s) of NIK stabilization by MACs, we performed a genome-wide siRNA screen. ECs were stably transduced with an NF-κB–responsive luciferase reporter responsive to both canonical (TNF-α) and noncanonical (LIGHT and PRA serum) NF-κB activators (Fig. S2A). Normal serum lacking significant anti-HLA IgG, the IgG+ fraction of PRA serum alone, or the IgG+ fraction of PRA combined with serum deficient in C6 lacking the capability to form MACs were all significantly weaker agonists than PRA serum (Fig. S2B). These data recapitulate our previous results identifying MACs as the primary activators of noncanonical NF-κB (2).
Fig. S2.

A genome-wide siRNA screen identifies vesicular trafficking genes involved in MAC-induced NIK stabilization. (A and B) ECs stably transduced with an NF-κB luciferase reporter were treated for 6 h as indicated. (C) Strategy for siRNA screening of PRA-treated ECs. (D) Genome-wide siRNA screening was performed twice. Pearson's correlation coefficient was calculated (r = 0.86), and genes with ≥2 SD robust z-scores were analyzed manually. (E and F) Selected genes were counterscreened with TNF-α (E), and genes with a average reduction in luciferase activity of PRA ≥50% and TNF-α ≤50% were subjected to pathway analysis and to deconvolution experiments in which individual siRNAs targeting unique exon regions from the original siRNA pool for each gene were tested in duplicate (F).
Transduced ECs were screened as diagrammed in Fig. S2C. Duplicate screening showed a highly reproducible Pearson's r coefficient of 0.86 (Fig. S2D, Left) and a nearly normal distribution of robust z-scores (Fig. S2D, Right). Genes with an average robust z-score of ≥2 (n = 831; Fig. S2D, Right) with cell viability ≥90% were defined as hits in the primary screen. From these hits, we identified 141 genes for counterscreening with TNF-α to select genes specific for noncanonical NF-κB (Fig. S2E). Counterscreening identified genes concurrently showing ≥50% siRNA-mediated inhibition of luciferase activity by PRA but ≤50% inhibition of the activity by TNF-α (gray dots in Fig. S2E). Many of these genes were functionally annotated to endocytosis and vesicular trafficking (n = 11). Individual siRNAs in the original pool of four were tested, and 10 of 11 genes showed ≥50% inhibition by two or more individual siRNAs (Fig. S2F).
MACs Are Internalized into Clathrin+ Vesicles and Transferred to Rab5+ Early Endosomes.
Based on siRNA screening results, we assessed the role of endocytosis of MACs in NIK stabilization. An average of 68 ± 27 total MACs were deposited per EC and 42 ± 16% of MACs were found intracellularly at 30 min after the addition of PRA (Fig. 2A). At this time point, MACs extensively colocalized with clathrin+ (Fig. 2B, Upper) and transferrin+ (Fig. 2B, Lower) vesicles (65 ± 3% and 69 ± 5%, respectively). Immune-electron microscopy (EM) of C9 at 5 min showed MACs within electron-dense surface invaginations anatomically consistent with clathrin-coated pits (arrowheads, Fig. 2C, first column) and showed colocalization of C9 within electron-dense coated vesicles at 30 min (Fig. 2C, second and third columns). Dual immune-EM on PRA-treated HUVECs confirmed colocalization of MAC and clathrin (Fig. 2D).
Fig. 2.

MACs are internalized into clathrin+ vesicles and transferred to Rab5+ early endosomes. (A) Total and surface C9 were quantified after treatment with PRA for 30 min. (B) C9, clathrin, and transferrin levels were assessed by IF after a 30-min treatment with PRA. (C and D) ECs treated with PRA for 5 min (C, arrowheads, first column) or 30 min (C, arrowheads, second and third columns) were subjected to immune-EM for C9. Dual immune-EM staining of vesicles was done following 30 min of PRA for C9 (D, arrowheads) and clathrin (D, arrows). (Scale bars: 10 μm in A and B; 100 nm in C and D). (E) ECs were treated with PRA for 30 min and stained as indicated. (F) Immune-EM of C9 (arrowheads) and Rab5 (arrows) in ECs treated with PRA for 30 min. Each experiment was repeated three to six times with microscopic analysis of ≥10 cells per experiment, with similar results. (Scale bar: 100 nm.)
We then analyzed the endosomal distribution of C9 using Rab5 (early endosomes), Rab7 (late endosomes), Rab11 (recycling endosomes), and LAMP-1 (lysosomes) (Fig. S3A and Table S1). At 30 min, when NIK was stabilized, a much greater percentage of Rab5+ endosomes colocalized with C9 (40 ± 2%; Fig. 2E) compared with Rab7+, Rab11+, or LAMP-1+ endosomes. We observed concomitant high percent colocalization of two Rab5 effectors associated with early endosomes, APPL1 and EEA1 (41 ± 7% and 44 ± 9%, respectively; Fig. S3B) with MAC+ vesicles. Dual detection by immune-EM at this time point confirmed colocalization of Rab5 (Fig. 2F, arrows) and C9 (Fig. 2F, arrowheads).
Fig. S3.

Endosome distribution of MACs. (A) ECs were treated with PRA for 30 min, followed by two-color immunostaining with C9 and Rab5 for early endosomes, Rab7 for late endosomes, Rab11 for recycling endosomes, or LAMP1 for lysosomes, as indicated. (B) ECs treated with PRA for 30 min were immunostained for the Rab5 effectors APPL1 and EEA1. Experiments were repeated twice, analyzing >10 cells per treatment group, with similar results. (Scale bar: 10 μm.)
Table S1.
Endosome distribution of MACs
| Endosomal marker | % of colocalizing MACs |
| Rab5 | 40 ± 2% |
| Rab7 | 22 ± 3% |
| Rab11 | 10 ± 2% |
| LAMP1 | 25 ± 3% |
| EEA1 | 44 ± 9% |
| APPL1 | 41 ± 7% |
Clathrin-Mediated Endocytosis of MACs Is Required for NIK Stabilization.
To examine the connection between clathrin-mediated endocytosis (CME) of MACs and noncanonical NF-κB signaling, we treated ECs transfected with control siRNA or clathrin siRNA with PRA and analyzed them for the percent colocalization of C9 with Rab5+ vesicles (Fig. S4A). An 86 ± 12% reduction of clathrin (as assessed by Western blot analysis) reduced the number of MAC+Rab5+ vesicles per EC to 19 ± 3, compared with 36 ± 4 per EC transfected with control siRNA (P = 0.03; Fig. S4A and Fig. 3A) and dramatically reduced the levels of NIK protein (Fig. 3B) without affecting TRAF3 levels.
Fig. S4.

Analysis of the effects of clathrin-mediated endocytosis and Rab5 activity on MAC internalization. Compared with ECs treated with control siRNA, ECs transfected with clathrin or AP2 siRNA (A) or with DNM2 siRNA (B) showed reduced numbers of Rab5+C9+ vesicles. EC were transduced with either empty vector, Rab5 WT, or Rab5 DN and stained as indicated (C).
Fig. 3.

CME of MACs is required for NIK stabilization. (A) HUVECs treated with control, clathrin, or AP2 siRNA were analyzed for C9 colocalization with Rab5. (B) Western blot analysis of ECs treated with LIGHT (100 ng/mL) or PRA (1:5 dilution) for 24 h or 4 h, respectively, in the presence of control, clathrin, or AP2 siRNA as indicated. (C) Following treatment with control or dynamin siRNA, colocalization between C9 and Rab5 was quantified. (D) ECs were treated with dynasore, DNM2 siRNA, or DNM2 DN or the relevant control and analyzed after 4 h of PRA treatment. Each experiment was repeated two to four times, with similar results. Quantitation of the data in A and C are represented as mean ± SEM. *P < 0.05. (Scale bars: 10 μm.)
Because clathrin also may participate in vesicle trafficking from internal membranes (14–16), we performed siRNA knockdown of clathrin adaptor protein, AP2 (17, 18), which exclusively regulates endocytosis of clathrin-coated vesicles from the cell surface (19–21). Western blot analysis revealed a 90 ± 14% reduction in AP2 protein levels. AP2-deficient ECs, like clathrin-deficient ECs, showed significantly reduced numbers of MAC+Rab5+ endosomes compared with controls (20 ± 3 vs. 31 ± 3; P = 0.02; Fig. S4A and Fig. 3A). AP2 knockdown similarly resulted in a marked reduction in NIK without affecting TRAF3 levels (Fig. 3B). In contrast, knockdown of AP2 or clathrin in LIGHT-treated HUVECs showed little effect on PRA-induced NIK stabilization (Fig. 3B).
Similarly, a 93 ± 8% siRNA-mediated reduction of dynamin, which mediates scission of clathrin-coated vesicles from the plasma membrane (22), also significantly reduced the number of MAC+Rab5+ vesicles compared with controls (17 ± 2 vs. 39 ± 4; P = 0.002; Fig. S4B and Fig. 3C) and ablated NIK induction (Fig. 3D). We verified these results in ECs treated with dynasore, a pharmacologic dynamin inhibitor, and in ECs transfected with a dynamin-2–dominant negative (DN) construct. Compared with respective controls, these treatments ablated NIK stabilization without affecting TRAF3 levels (Fig. 3D). In contrast, similar treatments in LIGHT-treated ECs did not significantly alter NIK or prevent TRAF3 degradation (Fig. 3D).
A MAC+NIK+ Signalosome Forms on Rab5+ Endosomes.
Given our finding that CME of MACs is required for NIK stabilization, and because MAC heavily colocalized with Rab5+ endosomes, we hypothesized that NIK might be stabilized on the surface of these vesicles. We first investigated whether the cIAP1-cIAP2-TRAF2-TRAF3 signalosome is formed on MAC-containing vesicles. cIAP1 and cIAP2 showed a predominantly cytoplasmic distribution with some nuclear colocalization, whereas TRAF2 and TRAF3 staining appeared punctate, suggestive of vesicular colocalization. However, we did not observe any significant colocalization of C9+ endosomes with cIAP1, cIAP2, TRAF2, or TRAF3 (8 ± 1%, 8 ± 1%, 14 ± 2%, and 13 ± 2%, respectively; Fig. S5A). In contrast, we found extensive colocalization of both NIK and phosphorylated IKK-α (pIKK-α), a downstream NIK effector, with C9+ vesicles (64 ± 9% and 74 ± 6%, respectively; Fig. S5B, Middle and Bottom). Subsequent three-color confocal microscopy showed colocalization of C9, NIK, and Rab5 in 11 ± 2% of Rab5+ vesicles (Fig. 4A). A similar percentage was observed for C9+Rab5+pIKK-α+ vesicles (13 ± 4%; Fig. 4B). These findings were corroborated by dual immune-EM, which revealed vesicles that costained for C9 and NIK (3 ± 5% ; Fig. 4C).
Fig. S5.

NIK, but not conventional noncanonical NF-κB signaling components, colocalizes on MAC+ endosomes. (A) Confocal images of TRAF2, TRAF3, cIAP1, and cIAP2 were analyzed for MAC colocalization (C9) in ECs treated with PRA for 30 min. (B) NIK and pIKK-α were assessed by IF for MAC colocalization (C9) in ECs treated with PRA for 30 min.(Scale bar: 10 μm.)
Fig. 4.

MAC+NIK+ signalosome forms on Rab5+ endosomes. (A and B) Three-color staining of NIK, C9, and Rab5 (A) and pIKK-α, C9, and Rab5 (B). (C) Immune-EM of C9 (arrowheads) and NIK (arrows) in ECs treated with PRA for 30 min. (Scale bar: 100 nm.) (D) ECs were transfected with Rab5-GFP and treated with MACs containing labeled C9-Alexa Fluor 647. Subcellular fractions containing endosomes were analyzed by Coomassie blue staining (Left), followed by Western blot analysis (Right). Each experiment was repeated two to three times, with similar results.
We further confirmed these morphological observations through biochemical analyses of isolated vesicles (23). ECs were transfected with Rab5-GFP and then treated with vehicle or PRA serum containing Alexa Fluor 647-labeled C9. The intact cell and subcellular fractions were identified (Fig. S6A), and the GFP+ and Alexa Fluor 647+ subcellular fractions were isolated by FACS, analyzed by Coomassie blue staining (Fig. 4D, Left), and subjected to Western blot analysis. C9+ fractions (lanes 2 and 3) from PRA-treated ECs, but not from vehicle-treated ECs (lane 1), contained both NIK and pIKK-α, but not TRAF3 (Fig. 4D, Right). Equivalent levels of IKK-α and TRAF3 were found in control and PRA-treated fractions of intact cells (Fig. S6B). These data suggest that a MAC+Rab5+ compartment that excludes conventional noncanonical NF-κB signaling components functions as a platform for NIK stabilization and recruitment of downstream noncanonical NF-κB effectors like pIKK-α.
Fig. S6.

Flow cytometry isolation of MAC+Rab5+ endosomes. (A) Intact cell and subcellular fractions were isolated using the gating strategy indicated. (B) Intact cell fractions were analyzed by Coomassie blue staining (Left) and Western blot analysis (Right). Each experiment was repeated two times, with similar results.
Rab5-Dependent Recruitment of Activated Akt to MAC+Rab5+ Endosomes Is Required for NIK Stabilization by MACs.
Akt is implicated in IKK-α phosphorylation (24, 25). Furthermore, Rab5 endosomes, the sites at which MAC stabilizes NIK (Fig. 4A), are enriched in phosphatidylinositol 3,4,5-trisphosphate, to which Akt binds. Immunofluorescence (IF) confocal microscopy revealed colocalization of phosphorylated Akt (pAkt) with both C9 and Rab5 (58 ± 6% and 31 ± 7%, respectively; Fig. 5A). Moreover, Akt coimmunoprecipitated with C9, Rab5, NIK, and pIKK-α, but not with TRAF3, in PRA-treated ECs (Fig. 5B). Subsequent knockdown of Akt unexpectedly blocked NIK (Fig. 5C). Transfection of ECs with a constitutively active form of Akt, myristolated Akt (myr-Akt), but not a kinase-dead form of Akt (KD-Akt), induced NIK stabilization and cIAP2 induction without TRAF3 degradation (Fig. 5D), indicating that Akt induces NIK through its kinase activity. Blocking CME in ECs with clathrin-specific siRNA had no effect on Akt phosphorylation (Fig. 5E), indicating that MAC internalization of MAC and Akt activation are not coupled during MAC-induced NIK stabilization.
Fig. 5.

Rab5-dependent recruitment of activated Akt to MAC+Rab5+ endosomes is required for NIK stabilization by MACs. (A) ECs treated with PRA for 30 min were evaluated by IF for phosphorylated AktSer473 (pAkt), C9, and Rab5. (B) ECs were treated with vehicle or PRA for 45 min, Akt was immunoprecipitated, and lysates were probed as indicated. (C) ECs transfected with control or Akt siRNA were treated with PRA for 4 h and probed as indicated. (D) ECs transduced with empty vector, myr-Akt, or KD-Akt were probed by Western blot analysis as indicated. (E) ECs transfected with either control or clathrin siRNA were treated with PRA for 4 h and probed as indicated. (F) ECs transfected with either Rab5 WT or Rab5 DN constructs were analyzed by confocal microscopy for C9+Rab5+ and C9+NIK+ vesicles following treatment with PRA for 30 min. (G) ECs transfected with empty vector, Rab5 WT, or Rab5 DN were probed by Western blot analysis as indicated. (H) Rab5 colocalization with C9 and pAkt in Rab5 WT and Rab5 DN mutants was assessed in ECs treated with PRA for 30 min (Left), and results were quantified (Right). (I) ECs transfected with empty vector, Rab5 WT, or Rab5DN constructs were treated with vehicle or PRA for 45 min. Akt was immunoprecipitated, and lysates were probed as indicated. Each experiment was repeated two to five times, with similar results. Data are presented as mean ± SEM. *P < 0.05. (Scale bar: 10 μm.)
To determine whether Rab5 GTPase activity is required for forming the MAC+Rab5+Akt+NIK+ signalosome, we transfected ECs with either Rab5-GFP wild-type (WT) or DN and assessed for MAC and/or NIK colocalization with C9+ vesicles (Fig. S4C and Fig. 5F). Compared with Rab5 WT EC, Rab5 DN ECs showed similar levels of C9+Rab5+ vesicles but dramatically decreased percentages of C9+ vesicles colocalizing with NIK (6 ± 2% vs. 60 ± 5%; P < 0.001; Fig. S4C and Fig. 5F). In fact, the overall numbers of NIK+ vesicles in Rab5 DN vs. Rab5 WT was reduced (4 ± 2 vs. 23 ± 3; P = 0.005). Furthermore, on Western blot analysis, ECs transfected with Rab5 DN showed reduced levels of both NIK and pIKK-α, but not of pAkt (Fig. 5G), compared with ECs transfected with Rab5 WT. These data suggest that active Rab5 is not essential for MAC delivery to Rab5+ endosomes but is required to stabilize NIK once MACs reach Rab5+ compartments.
We next examined by confocal microscopy whether Rab5 activity was required for Akt recruitment to C9+ vesicles. The number of pAkt+ vesicles was not significantly different between Rab5 DN and Rab WT (38 ± 7 vs. 50 ± 9; P = 0.09), consistent with our observation that Rab5 DN did not affect pAkt protein levels (Fig. 5G). However, at high magnification, we observed that pAkt+ vesicles in Rab5 DN EC samples were closely apposed but were not colocalized with Rab5+ vesicles (Fig. 5H, Bottom), thereby significantly reducing the percentage of pAkt colocalizing with Rab5 DN endosomes compared with Rab5 WT controls (12 ± 4% vs. 52 ± 5%; P = 0.004) (Fig. 5H, Right).
To verify these results, we pulled down Akt in PRA-treated HUVECs carrying Rab5 WT or Rab5 DN constructs. Compared with Rab5 WT ECs, NIK did not coimmunoprecipitate with activated Akt and C9 in Rab5 DN ECs (Fig. 5I). Collectively, these data show that Rab5-independent activation and Rab5-dependent recruitment of Akt to MAC+Rab5+ vesicles are separate but necessary processes for assembly of the endosome-associated signalosome mediating NIK.
MAC Internalization Occurs in Human Coronary Arteries and Is Required for NIK Stabilization in Vivo.
Finally, to determine whether MAC internalization is required for NIK stabilization in ECs in vivo, we administered i.v. injections of PRA to immunodeficient SCID/beige mice in which a human coronary artery xenograft had been interpositioned into the infrarenal aorta, a treatment that deposits murine MACs on human ECs, induces NIK, and activates inflammatory genes (2). Immune-EM revealed internalized MACs within PRA-treated graft ECs (5 ± 4), but not in grafts treated with IgG-depleted PRA serum (1 ± 0; Fig. 6A).
Fig. 6.

MAC internalization occurs in human coronary arteries and is required for NIK stabilization in vivo. (A) SCID/beige mice bearing human coronary arteries were treated with PRA serum depleted of IgG (IgG− serum) or PRA serum. Grafts were harvested at 18 h after injection and analyzed by immune-EM (n = 2 pairs of mice). (Scale bar: 10 nm.) (B and C) Grafts were harvested at 18 h after PRA injection (B), and MFI of the indicated stains was analyzed by IF (C) (n = 5 pairs of mice). (D) Schematic of events triggered by MACs to activate noncanonical NF-κB. Quantitation of the data is represented as mean ± SEM. *P < 0.05. (Scale bars: 200 μm.)
To test whether MAC internalization is required for NIK, we pretreated grafts with vehicle or dynasore before i.v. injection of PRA serum. We validated the ability of dynasore to block PRA-induced inflammatory changes in ECs in vitro, along with pitstop 2, a cell-permeable clathrin inhibitor (26). Pretreatment of ECs with dynasore or pitstop 2 significantly reduced NF-κB–dependent luciferase activity (Fig. S7A) and attenuated NIK-dependent inflammatory gene induction (Fig. S7B). Dynasore was subsequently chosen based on its efficacy in vitro and its tolerability in vivo (27). We then tested the ability of dynasore to inhibit CME in vivo. Mice bearing human artery grafts were treated with dynasore or vehicle and then injected with PRA and with DiI-LDL, after which grafts were harvested for analysis. In grafts from animals pretreated with vehicle, we observed uptake of DiI-LDL in the intima and media (Fig. S7C, Upper Row). In contrast, grafts from dynasore-treated animals showed significantly reduced mean fluorescence intensity (MFI) of DiI-LDL without concurrent intimal loss, as measured by MFI of human CD31 staining (Fig. S7C, Lower Row). These data indicate functionally successful, noncytotoxic drug dosing.
Fig. S7.

Dynasore inhibits noncanonical NF-κB–dependent Inflammatory genes in vitro and blocks clathrin-mediated endocytosis in vivo. HUVECs carrying an NF-κB–responsive luciferase reporter were pretreated for 30 min with vehicle, dynasore (80 μM), or pitstop 2 (30 μM), followed by exposure to PRA for 6 h, followed by analysis for luciferase activity (A) or for 4 h before assessment for NIK-dependent inflammatory gene induction (B). Results are expressed in cycle time normalized to GAPDH expression, where a decrease in cycle time by x indicates an increase in gene expression by 2x. (C) Grafts were treated with vehicle or dynasore before i.v. injection of PRA and DiI-LDL, a ligand used for clathrin-mediated endocytosis. *P < 0.05. n = 3 pairs of mice. (Scale bar: 100 μm.)
Finally, we tested whether inhibiting endocytosis could block MAC-induced NIK and EC activation. In hosts treated with PRA, MACs were detected in the intima of arterial grafts along with NIK and markers of EC activation, including E-selectin and VCAM-1 adhesion molecules (Fig. 6B, Upper). Compared with controls, dynasore-treated animals had significantly attenuated levels of NIK and adhesion molecules (Fig. 6B, Lower), as indicated by MFI values (Fig. 6C). Interestingly, MAC surface levels were significantly reduced in dynasore-treated hosts compared with controls. We conclude that internalization of MACs by ECs is required for NIK stabilization and EC activation in vivo.
Discussion
MAC-induced noncanonical NF-κB is known to potentiate EC activation and exacerbate allograft rejection in human coronary arteries (2). Here we investigated the unknown signaling pathway connecting MAC formation to NIK stabilization. Alloantibody-induced MACs on EC surfaces were rapidly internalized via clathrin-mediated endocytosis and transferred to Rab5+ endosomes. Akt was then activated in a Rab5-independent fashion and recruited to MAC+Rab5+ endosomes in a Rab5-dependent manner. Activated Akt isoforms localized on endosomes then mediated NIK stabilization, IKK-α phosphorylation, and proinflammatory gene signaling (Fig. 6D). This novel mechanism contrasts with the widely held view that MACs initiate signaling from the cell surface via electrolyte (e.g., calcium) flux (28).
Our studies reveal a requirement for activated Akt in stabilizing NIK, a step upstream of IKK-α activation. Rab5-dependent Akt localization on endosomes suggests that Rab5 allows active Akt to phosphorylate substrates on MAC+Rab5+ endosomes, which may include NIK and other undefined substrates. Thus, Akt may represent a critical point for regulating MAC-induced noncanonical NF-κB.
Materials and Methods
Cell Culture, Reagents, and Culture Treatments.
All protocols were approved by the Yale University Institutional Review Board. HUVEC culture, treatment with PRA, Western blot analysis, real-time quantitative RT-PCR (qRT-PCR), and IF staining were performed as described previously (2). The protocol is described in detail in SI Materials and Methods.
Animal Studies.
All protocols were approved by Yale University’s Institutional Animal Care and Use Committee. Human coronary arteries were interposed into the descending aortae of adult female C.B-17 SCID/beige mice (Taconic) as described previously (2). Details of the IF staining procedure are provided in SI Materials and Methods.
Statistical Methods.
Statistical analyses were performed using Origin software (OriginLab). Absolute numbers and percentages of vesicles were analyzed using the Student t test and χ2 test, respectively. A P value < 0.05 was considered statistically significant. SEs are reported throughout the text. Endosome numbers were quantified using Volocity software (PerkinElmer). Colocalization was quantified using ImageJ image analysis software with the Just Another Colocalization Plugin (JACoP; National Institutes of Health).
SI Materials and Methods
siRNA Screening.
HUVECs were pretreated with IFN-γ (50 ng/mL) for 72 h before harvesting and robot-assisted replating at 800 cells/well in EGM2-MV medium (Lonza) in 384-well microtiter plates (PerkinElmer) containing plate-bound pools of four siRNAs targeting different exon segments per gene each at a concentration of 20 μM (Dharmacon). Cells were reverse-transfected using RNAiMax (Invitrogen). Plates were centrifuged briefly to allow settling of cells and then cultured for 72 h at 37 °C with 5% CO2. On the day of harvest, wells were washed once, and gelatin veronal buffer containing a 1:10 dilution of PRA serum or TNF-α (5 ng/mL; Invitrogen) in EGM2-MV buffer was added for 6 h. At 1 h before harvest, HUVECs were treated with a viability dye (Celltiter Fluor; Promega) and analyzed according to the manufacturer's specifications. Cell lysis and substrate addition to measure luciferase activity were performed according to the manufacturer’s specifications (Promega; catalog no. E1501) and analyzed using a plate luminometer (Envision; PerkinElmer). Pearson's correlation coefficients were calculated between duplicate plates. Each screening plate contained in singlicate 320 library siRNAs as well as 16 negative control wells [nontargeting siRNA #3 (NT3); Dharmacon) and 16 positive control wells. Wells containing NT3 and Akt2 siRNA (Cell Signaling Technology) served as negative and positive controls, respectively, for functional validation of the screen.
To ensure screening quality, mean and SD of control samples were used to calculate signal to background, coefficients of variation, and Z' statistical parameters for each screening plate. Primary screening was performed twice. To enable data comparison for all screening plates, raw reporter data for the library samples from each plate were normalized to the control data from the same plate. The percent effect for all library siRNAs was calculated relative to the mean of 16 AKT2 siRNA wells (set as 100% effect) and the mean of 16 NT3 siRNA wells (set as 0% effect). Robust z-score an outlier-insensitive statistical method that measures the number of median absolute deviations from the overall screen median, was then calculated for each library siRNA. Mean robust z-scores across duplicate screens were used for results ranking and hit selection. Robust z-scores ≥2 were defined as hits in the primary screen.
Primary screening results were analyzed manually, and selected genes were counterscreened with TNF-α to select genes specifically involved in noncanonical NF-κB activation. Both manual curation and bioinformatic analysis using MetaCore software (Thomson Reuters) was performed for data mining and gene ontology (GO) pathway analysis of counterscreened hits. During deconvolution, genes were considered validated if at least two out of four individual siRNAs showed a ≥50% reduction of PRA-stimulated luciferase signal. GO pathway analysis was performed on genes concurrently showing ≥50% inhibition with PRA and ≤50% inhibition with TNF-α. Screening statistics were analyzed using ActivityBase software (IDBS).
Serum Fractionation.
Where indicated, PRA serum was separated into IgG+ and IgG− fractions. Total IgG concentrations were first determined in intact serum by ELISA before fractionation (Invitrogen). Then, using a MAbTrap Kit (GE Healthcare), in accordance with the manufacturer’s specifications, 500 μL of neat serum was diluted 1:1 in binding buffer and passed through the provided column, which had been pre-equilibrated with binding buffer. The column was washed with 5 mL of binding buffer to collect IgG− fractions, and the IgG+ fraction was eluted using 5 mL of elution buffer containing 650 μL of neutralizing buffer. The 5-mL volumes of IgG+ and IgG− fractions were then serially concentrated and rediluted in PBS using an UltraCel 10K centrifugal filter device (EMD Millipore). All IgG+ fractions were brought to a final concentration equivalent to the total IgG concentration before serum fractionation. All isolated fractions were then used at 1:5 dilution in gelatin veronal buffer.
Viral Transduction of ECs.
A lentiviral NF-κB luciferase reporter (SABiosciences) was transduced using two cycles of transduction at a multiplicity of infection (MOI) of 10 in 80–90% confluent HUVEC cultures for 8 h, followed by washing, culturing with EGM2-MV medium overnight, and then selection with puromycin (1 μg/mL) for 48 h. A lentiviral Rab5-GFP reporter (AMS Biotechnology) was transduced using two cycles of transduction with an MOI of 10 in 80–90% confluent HUVEC cultures for 48 h before washing, culturing with EGM2-MV medium overnight, and then selection with puromycin for 48 h. To generate retrovirus encoding KD-Akt, myr-Akt, or empty vector (pBABE puro or pLZRS), Phoenix cells (a gift from G. Nolan, Stanford University, Stanford, CA) were transfected, using Lipofectamine 2000, with plasmids encoding myr-Akt (Addgene; plasmid 15294) which was deposited by W. Hahn (Dana-Farber Cancer Institute, Boston, MA). Viral supernatants were collected and used to transduce ECs.
Confocal IF Microscopy.
ECs were treated, fixed, and permeabilized with ice-cold methanol, blocked with PBS containing 0.01% Tween-20 and 5% (vol/vol) FBS, and stained using anti-C9 (Vector Laboratories; 1:50 dilution) or anti-clathrin (1:200), anti-pAktSer473 (1:100), anti-NIK (1:100), anti-pIKK-α (1:100), anti-EEA1 (1:200), anti-APPL (1:200), anti-Rab5 (1:200), anti-Rab7 (1:200), anti-Rab11 (1:200), or anti-LAMP1 (1:200) (all from Cell Signaling Technology). Negative controls were stained with secondary antibody only. Transferrin-Alexa Fluor 488 (Invitrogen) was added at 50 μg/well. Secondary antibodies (Molecular Probes) were added at 1:500 dilution in PBS-T for 1 h at room temperature. Fluorescent staining was visualized using a Leica TCS SP8 confocal microscope.
Electron Microscopy.
Treated HUVECs were fixed in 4% (vol/vol) paraformaldehyde, blocked and permeabilized with PBS containing 0.01% saponin, and incubated with mouse anti-C9 (Vector Laboratories; 1:50 dilution), rabbit anti-clathrin (Cell Signaling Technology; 1:200), rabbit anti-Rab5 (Cell Signaling; 1:200), or rabbit anti-NIK (Cell Signaling Technology; 1:100) for 4 °C overnight. Secondary anti-mouse 2.5-nm nanogold antibody (Invitrogen) and anti-rabbit 12-nm colloidal gold antibody (Jackson ImmunoResearch) were added at 1:500 for 1 h at room temperature. Samples were fixed in 2% gluteraldehyde in 0.1 M sodium cacodylate buffer (pH 7.4) and silver-enhanced for 4 min (Nanoprobes). Samples were postfixed in 0.1% osmium tetroxide before being embedded in EMbed 812 epoxy resin (Electron Microscopy Sciences). Blocks were cut into 60-nm sections using a Leica UltraCut UC7 and then stained with 2% (wt/vol) uranyl acetate and lead citrate, and grids were viewed in a FEI Tencai Biotwin transmission electron microscope at 80 kv. Images were obtained using a Morada CCD camera and iTEM software (Olympus).
Transfection of siRNA, Dynamin-GFP, and Rab5-GFP Constructs in ECs.
HUVECs were pretreated with IFN-γ for 48 h before siRNA transfection. Small interfering (si)RNAs (Dharmacon) targeting clathrin, AP2, and DNM2, as well as nontargeting siRNAs ((Dharmacon; target sequence UAA CGA CGC GAC GAC GUA A) were purchased commercially and transfected into HUVECs at ∼60–70% confluency in 24-well plates (BD Falcon) at 20 nM concentration. siRNAs were diluted at 20 nM in Gibco Opti-MEM culture medium (Life Technologies) and mixed at equal volumes with RNAiMax transfection reagent (Invitrogen) diluted 1:50 in Opti-MEM for 30 min at room temperature in accordance with the manufacturer's specifications. This mixture was then added to HUVEC cultures at 37 °C for 6 h, followed by washing and buffer exchange with EGM2-MV medium. Cells were then analyzed by Western blot analysis, luciferase assay, qRT-PCR, or T-cell functional assays at 72 h after transfection.
Dynamin-GFP and Rab5-GFP WT and DN constructs were gifts from Dr. Michael Simons (Yale University School of Medicine, New Haven, CT). To transfect plasmids, ECs at 60–70% confluency in 24-well dishes were pretreated with IFN-γ as above for 48 h, followed by transfection of dynamin or Rab5 WT and DN constructs using lipofectomy. Then 500 ng of each construct was mixed with 0.4 μL of PLUS reagent (Invitrogen) in 200 μL/well of Opti-MEM for 5 min at room temperature, followed by the addition of 1.5 μL of Lipofectamine 2000 (Invitrogen) for 30 min at room temperature. This mixture was added to cultured HUVECs at 37 °C for 8 h, followed by washing and buffer exchange with EGM2-MV medium. Using this protocol, ∼30–50% of ECs remained viable for analysis. The transfection efficiency calculated using flow cytometry measuring GFP fluorescence was typically >45%. GFP+ ECs were then sorted and replated to yield homogeneous cultures carrying each respective construct.
Real Time qRT-PCR.
RNA was isolated from treated HUVECs according to the manufacturer's specifications (Qiagen) and reverse-transcribed (Applied Biosystems). Respective cDNA was amplified in a CFX Real-Time System (Bio-Rad) in a volume of 20 μL containing dilutions of 1:20 of TaqMan probe (Applied Biosystems), 1:2 of TaqMan Gene Expression Master Mix (Applied Biosystems), and 1:10 of cDNA in double-distilled H2O. The following qRT-PCR gene probes were purchased from Applied Biosystems: CCL5 (Hs00174575_m1), CCL20 (Hs01011368_m1), IL6 (Hs00985639_m1), SELE (Hs00950401_m1), VCAM-1 (Hs01003372_m1), and GAPDH (Hs02758991_g1). For amplification, samples were heated to 50 °C for 2 min for one cycle, to 95 °C for 10 min for one cycle, and then to 95 °C for 15 s preceded by 60 °C for 1 min for 40 cycles. Cycle times were subsequently normalized to the average GAPDH cycle time for all samples such that a relative decrease in cycle number by x indicates gene induction by 2x.
Western Blot Analysis and Immunoprecipitation.
Western blot analysis was performed using rabbit anti- AP2M1 (Abcam) and anti-clathrin, anti-cIAP2, anti-TRAF2, anti-TRAF3, and anti-NIK (Cell Signaling Technology), and mouse anti-p52 (Santa Cruz Biotechnology) and anti–β-actin (Sigma-Aldrich), all at 1:1,000 dilution. For immunoprecipitation, lysates were prepared using RIPA buffer without SDS (Cell Signaling Technology), precleared using 20 μL of protein G-conjugated agarose beads (Pierce), incubated with 10 μL of primary antibody overnight, and then collected with protein G-conjugated agarose beads before Western blot analysis.
C9 Fluorescent Labeling and Endosome Sorting.
Recombinant C9 protein (Sigma-Aldrich) was labeled with FITC (Invitrogen; F10240) or Alexa Fluor 647 (Invitrogen; A20173) according to the manufacturer's specifications. For each labeling reaction, 800 μg of C9 protein was used. Labeled C9 eluted from the manufacturer's column was then serially concentrated and rediluted in PBS through five 30-min spins at 2,100 × g in an Amicon Ultracel 10K centrifugal filter device (EMD Millipore), and then brought up in a final volume of 200 μL PBS. To measure C9 internalization, 5 μL of FITC-labeled C9 was added to 20 μL of PRA and 175 μL of gelatin veronal buffer, and this mixture was then added to IFN-γ–pretreated HUVECs in 24-well plates at 37 °C for 20 min to detect total C9. HUVECs were then fixed with 4% PFA without permeabilization and counterstained with anti-FITC eFluor 660 antibody at 1:1,000 dilution to detect surface C9.
To isolate C9-containing endosomes by cell sorting, recombinant C9 protein was labeled with Alexa Fluor 647 as above, and 75 μL of Alexa Fluor 647-labeled C9 was added to 500 μL of PRA and 1925 μL of gelatin veronal buffer and then added to IFN-γ pretreated HUVECs carrying a Rab5-GFP reporter in a T175 flask at 37 °C for 45 min. Cells were harvested, washed, and resuspended in 0.5 mL of endosome buffer [10 mM Hepes-NaOH pH 7.4, 1 mM EDTA, and 0.25 M sucrose containing one protease inhibitor tablet (Roche) per 10 mL of buffer] and mechanically disrupted by three cycles of 10–15 passes with a Dounce homogenizer, freezing–thawing of the sample, and vortexing for 30–60 s. Subcellular fractions were identified, and Rab5-GFP+C9-Alexa Fluor 647+ subcellular fractions were sorted (FACSAria; BD Biosciences) using the gating strategies indicated.
Animal Studies.
Human coronary arteries were interposed into the descending aortae of adult female C.B-17 SCID/beige mice (Taconic Biosciences). At 30 d later, the mice were injected i.p. with vehicle (DMSO) or 100 μg of dynasore (Sigma-Aldrich) for 3 d, and then given 200 μL of neat PRA serum i.v. at 6 h before harvest. At 45 min before harvest, then mice were injected i.v. with 100 μg of DiI-LDL (Invitrogen). Frozen sections of harvested grafts were prepared and then analyzed using biotinylated Ulex Europeus Agglutinin I (Vector Laboratories), rabbit anti-mouse C4d (a gift from William Baldwin III, Cleveland Clinic, Cleveland, OH), rabbit anti-polyC9 (Calbiochem), rabbit anti-NIK (Cell Signaling Technology), and mouse anti-VCAM1 (clone E16.15), all at 1:200 dilution. Secondary antibodies (Invitrogen)were added at 1:200 dilution, and IF was visualized using a Zeiss Axiovert 200M fluorescence microscope.
Acknowledgments
J.S.P. was supported by a grant from the National Institutes of Health (R01 HL109455). D.J. was supported by fellowships from Merck/American College of Cardiology and the National Institutes of Health (5T32A1089704-02 and 5T32HL007974-13).
Footnotes
The authors declare no conflict of interest.
This article is a PNAS Direct Submission.
This article contains supporting information online at www.pnas.org/lookup/suppl/doi:10.1073/pnas.1503535112/-/DCSupplemental.
References
- 1.Carroll MC. The complement system in regulation of adaptive immunity. Nat Immunol. 2004;5(10):981–986. doi: 10.1038/ni1113. [DOI] [PubMed] [Google Scholar]
- 2.Jane-Wit D, et al. Alloantibody and complement promote T cell-mediated cardiac allograft vasculopathy through noncanonical nuclear factor-κB signaling in endothelial cells. Circulation. 2013;128(23):2504–2516. doi: 10.1161/CIRCULATIONAHA.113.002972. [DOI] [PMC free article] [PubMed] [Google Scholar]
- 3.Oeckinghaus A, Hayden MS, Ghosh S. Crosstalk in NF-κB signaling pathways. Nat Immunol. 2011;12(8):695–708. doi: 10.1038/ni.2065. [DOI] [PubMed] [Google Scholar]
- 4.Sun SC. The noncanonical NF-κB pathway. Immunol Rev. 2012;246(1):125–140. doi: 10.1111/j.1600-065X.2011.01088.x. [DOI] [PMC free article] [PubMed] [Google Scholar]
- 5.Li C, et al. Structurally distinct recognition motifs in lymphotoxin-beta receptor and CD40 for tumor necrosis factor receptor-associated factor (TRAF)-mediated signaling. J Biol Chem. 2003;278(50):50523–50529. doi: 10.1074/jbc.M309381200. [DOI] [PubMed] [Google Scholar]
- 6.Ni CZ, et al. Key molecular contacts promote recognition of the BAFF receptor by TNF receptor-associated factor 3: Implications for intracellular signaling regulation. J Immunol. 2004;173(12):7394–7400. doi: 10.4049/jimmunol.173.12.7394. [DOI] [PubMed] [Google Scholar]
- 7.Ni CZ, et al. Molecular basis for CD40 signaling mediated by TRAF3. Proc Natl Acad Sci USA. 2000;97(19):10395–10399. doi: 10.1073/pnas.97.19.10395. [DOI] [PMC free article] [PubMed] [Google Scholar]
- 8.Sanjo H, Zajonc DM, Braden R, Norris PS, Ware CF. Allosteric regulation of the ubiquitin:NIK and ubiquitin:TRAF3 E3 ligases by the lymphotoxin-beta receptor. J Biol Chem. 2010;285(22):17148–17155. doi: 10.1074/jbc.M110.105874. [DOI] [PMC free article] [PubMed] [Google Scholar]
- 9.Vallabhapurapu S, et al. Nonredundant and complementary functions of TRAF2 and TRAF3 in a ubiquitination cascade that activates NIK-dependent alternative NF-kappaB signaling. Nat Immunol. 2008;9(12):1364–1370. doi: 10.1038/ni.1678. [DOI] [PMC free article] [PubMed] [Google Scholar]
- 10.Zarnegar BJ, et al. Noncanonical NF-kappaB activation requires coordinated assembly of a regulatory complex of the adaptors cIAP1, cIAP2, TRAF2 and TRAF3 and the kinase NIK. Nat Immunol. 2008;9(12):1371–1378. doi: 10.1038/ni.1676. [DOI] [PMC free article] [PubMed] [Google Scholar]
- 11.Razani B, Reichardt AD, Cheng G. Non-canonical NF-κB signaling activation and regulation: Principles and perspectives. Immunol Rev. 2011;244(1):44–54. doi: 10.1111/j.1600-065X.2011.01059.x. [DOI] [PubMed] [Google Scholar]
- 12.Madge LA, Kluger MS, Orange JS, May MJ. Lymphotoxin-alpha 1 beta 2 and LIGHT induce classical and noncanonical NF-kappa B–dependent proinflammatory gene expression in vascular endothelial cells. J Immunol. 2008;180(5):3467–3477. doi: 10.4049/jimmunol.180.5.3467. [DOI] [PMC free article] [PubMed] [Google Scholar]
- 13.Madge LA, May MJ. Classical NF-kappaB activation negatively regulates noncanonical NF-kappaB–dependent CXCL12 expression. J Biol Chem. 2010;285(49):38069–38077. doi: 10.1074/jbc.M110.147207. [DOI] [PMC free article] [PubMed] [Google Scholar]
- 14.Raiborg C, Bache KG, Mehlum A, Stang E, Stenmark H. Hrs recruits clathrin to early endosomes. EMBO J. 2001;20(17):5008–5021. doi: 10.1093/emboj/20.17.5008. [DOI] [PMC free article] [PubMed] [Google Scholar]
- 15.Deborde S, et al. Clathrin is a key regulator of basolateral polarity. Nature. 2008;452(7188):719–723. doi: 10.1038/nature06828. [DOI] [PMC free article] [PubMed] [Google Scholar]
- 16.McMahon HT, Boucrot E. Molecular mechanism and physiological functions of clathrin-mediated endocytosis. Nat Rev Mol Cell Biol. 2011;12:517–533. doi: 10.1038/nrm3151. [DOI] [PubMed] [Google Scholar]
- 17.Motley A, Bright NA, Seaman MN, Robinson MS. Clathrin-mediated endocytosis in AP-2–depleted cells. J Cell Biol. 2003;162(5):909–918. doi: 10.1083/jcb.200305145. [DOI] [PMC free article] [PubMed] [Google Scholar]
- 18.Boucrot E, Saffarian S, Zhang R, Kirchhausen T. Roles of AP-2 in clathrin-mediated endocytosis. PLoS One. 2010;5(5):e10597. doi: 10.1371/journal.pone.0010597. [DOI] [PMC free article] [PubMed] [Google Scholar]
- 19.Kural C, et al. Dynamics of intracellular clathrin/AP1- and clathrin/AP3-containing carriers. Cell Reports. 2012;2(5):1111–1119. doi: 10.1016/j.celrep.2012.09.025. [DOI] [PMC free article] [PubMed] [Google Scholar]
- 20.Kirchhausen T. Adaptors for clathrin-mediated traffic. Annu Rev Cell Dev Biol. 1999;15:705–732. doi: 10.1146/annurev.cellbio.15.1.705. [DOI] [PubMed] [Google Scholar]
- 21.Robinson MS, Bonifacino JS. Adaptor-related proteins. Curr Opin Cell Biol. 2001;13(4):444–453. doi: 10.1016/s0955-0674(00)00235-0. [DOI] [PubMed] [Google Scholar]
- 22.Lee MY, et al. Dynamin 2 regulation of integrin endocytosis, but not VEGF signaling, is crucial for developmental angiogenesis. Development. 2014;141(7):1465–1472. doi: 10.1242/dev.104539. [DOI] [PMC free article] [PubMed] [Google Scholar]
- 23.Chasan AI, Beyer M, Kurts C, Burgdorf S. Isolation of a specialized, antigen-loaded early endosomal subpopulation by flow cytometry. Methods Mol Biol. 2013;960:379–388. doi: 10.1007/978-1-62703-218-6_28. [DOI] [PubMed] [Google Scholar]
- 24.Gustin JA, Korgaonkar CK, Pincheira R, Li Q, Donner DB. Akt regulates basal and induced processing of NF-kappaB2 (p100) to p52. J Biol Chem. 2006;281(24):16473–16481. doi: 10.1074/jbc.M507373200. [DOI] [PubMed] [Google Scholar]
- 25.Taniguchi R, et al. RelB-induced expression of Cot, an MAP3K family member, rescues RANKL-induced osteoclastogenesis in alymphoplasia mice by promoting NF-κB2 processing by IKKα. J Biol Chem. 2014;289(11):7349–7361. doi: 10.1074/jbc.M113.538314. [DOI] [PMC free article] [PubMed] [Google Scholar]
- 26.von Kleist L, et al. Role of the clathrin terminal domain in regulating coated pit dynamics revealed by small molecule inhibition. Cell. 2011;146(3):471–484. doi: 10.1016/j.cell.2011.06.025. [DOI] [PubMed] [Google Scholar]
- 27.Chen CL, et al. Inhibitors of clathrin-dependent endocytosis enhance TGFbeta signaling and responses. J Cell Sci. 2009;122(Pt 11):1863–1871. doi: 10.1242/jcs.038729. [DOI] [PMC free article] [PubMed] [Google Scholar]
- 28.Rus HG, Niculescu FI, Shin ML. Role of the C5b-9 complement complex in cell cycle and apoptosis. Immunol Rev. 2001;180:49–55. doi: 10.1034/j.1600-065x.2001.1800104.x. [DOI] [PubMed] [Google Scholar]