Significance
X-chromosome inactivation (XCI) is initiated by the long noncoding RNA Xist. Here we view Xist RNA and the Xi at 20-nm resolution using STochastic Optical Reconstruction Microscopy (STORM) and observe dynamics at the single-cell level not predicted by epigenomic analysis. Only 50–100 Xist molecules and ∼50 PRC2 foci are observed per Xi, contrasting with the chromosome-wide “coat” observed by deep sequencing and conventional microscopy. Xist knock-off experiments enable visualization of dissociation and relocalization dynamics, and support a functional tethering of Xist and PRC2. Thus, Xist-PRC2 complexes are less numerous than expected, implying that the Xist-PRC2 complexes methylate nucleosomes in a hit-and-run model.
Keywords: super resolution microscopy, Xist RNA, Polycomb, X inactivation, chromosome
Abstract
X-chromosome inactivation (XCI) is initiated by the long noncoding RNA Xist, which coats the inactive X (Xi) and targets Polycomb repressive complex 2 (PRC2) in cis. Epigenomic analyses have provided significant insight into Xist binding patterns and chromatin organization of the Xi. However, such epigenomic analyses are limited by averaging of population-wide dynamics and do not inform behavior of single cells. Here we view Xist RNA and the Xi at 20-nm resolution using STochastic Optical Reconstruction Microscopy (STORM) in mouse cells. We observe dynamics at the single-cell level not predicted by epigenomic analysis. Only ∼50 hubs of Xist RNA occur on the Xi in the maintenance phase, corresponding to 50–100 Xist molecules per Xi and contrasting with the chromosome-wide “coat” observed by deep sequencing and conventional microscopy. Likewise, only ∼50 hubs PRC2 are observed. PRC2 and Xist foci are not randomly distributed but showed statistically significant spatial association. Knock-off experiments enable visualization of the dynamics of dissociation and relocalization onto the Xi and support a functional tethering of Xist and PRC2. Our analysis reveals that Xist-PRC2 complexes are less numerous than expected and suggests methylation of nucleosomes in a hit-and-run model.
X-chromosome inactivation (XCI) silences a whole X chromosome in the early mammalian female embryo and is maintained through life to balance gene dosage between sexes (1–4). Silencing requires the long noncoding Xist RNA (5), which is expressed only from the inactive X (Xi) and is known to “coat” the Xi in cis (6). Biochemical and genetic analyses have shown that expression of Xist RNA initiates XCI by targeting Polycomb repressive complex 2 (PRC2) to a nucleation site located at the X-inactivation center (7–9). Upon leaving the nucleation site, the Xist-PRC2 complex spreads together along the X-chromosome to establish silencing by depositing the repressive trimethylated histone H3-lysine 27 (H3K27me3) mark (9–13). Understanding how silencing factors spread in cis has been advanced by employment of next-generation sequencing techniques. For example, CHART-seq (capture hybridization analysis of RNA targets with deep sequencing) and ChIP-seq analyses have provided a first molecular examination of Xist binding patterns (10, 14) and localization dynamics of various chromatin epitopes (11, 15) at a population-wide level. Developmental profiling demonstrates that Xist RNA and PRC2 initially localize to broad gene-rich, multimegabase clusters and later spread into intervening gene-poor regions.
Although these epigenomic studies have yielded high-resolution views, they have also been limited by the population averaging of millions of input cells, masking the dynamics and potential variations at the level of single cells or single chromosomes. Although conventional light microscopy has provided critical single-cell perspectives over the past five decades, its resolving power of 200–300 nm has precluded analysis at the subchromosomal level. By conventional light microscopy, Xist RNA appears as a μm-scale “cloud” in interphase cells (e.g., Fig. 1A) (6) and as broad discontinuous bands on mitotic chromosomes (16, 17), with broad overlapping staining of PRC2 and other chromatin epitopes (9, 13, 18, 19). To push the resolving power of light microscopy, two recent studies used structured illumination microscopy (SIM) with a resolving power of ∼100 nm to examine the relationship of Xist RNA to nuclear markers (20, 21). One report surprisingly concluded that Xist RNA does not colocalize with PRC2 and H3K27me3 and called into question the idea that Xist RNA and PRC2 are functionally tethered (20). Here we turn to a superresolution microscopic technique with substantially higher resolution. By Stochastic Optical Reconstruction Microscopy (STORM) (22–24), we visualize the relationship between Xist, PRC2, and the Xi, to elucidate their stoichiometry and spatial association, which support a model in which Xist and PRC2 are functionally tethered with each other.
Fig. 1.
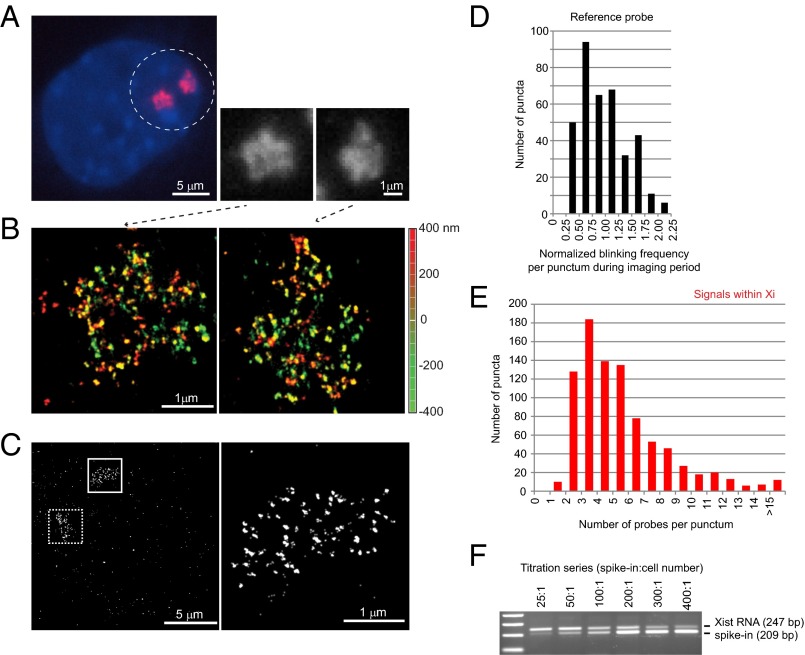
Xist RNA at 20-nm resolution reveals discrete puncta and only 50–100 copies per chromosome. (A) Conventional microscopy shows amorphous Xist clouds (circled) in MEF cell by RNA FISH. Two Xist clouds are seen because the immortalized MEF cells are tetraploid. The two clouds are magnified in the black and white panels. (B) The same cell shown in A is imaged by 3D-STORM, revealing discrete RNA puncta on the two Xi. Depth in the z-plane is color-coded from red (+400 nm) to green (−400 nm). (C) Determination of Xist:Xi stoichiometry: A mixture of three end-labeled unique probes was used in RNA FISH of Xist (boxed area, Left). Higher magnification of the solid boxed area is shown (Right). (D) Distribution of normalized blinking frequencies for each punctum in the reference probes during the imaging period. The normalized blinking frequency was determined as the number of blinks in a given punctum divided by the mean blinking frequency of puncta outside of the Xi but across the entire imaging field. (Note: A blink represents a single burst of emission from one fluorophore. Because a fluorophore can blink multiple times during the imaging window, quantitation required normalization to single-fluorophore reference probes.) (E) Distribution of normalized blinking frequencies of Xist puncta within the Xi territory. For individual Xist clouds, blinking frequencies were counted for each punctum inside the Xi and internally normalized to the mean blinking frequencies of the reference probe outside of the Xi in the same imaging field. (F) Confirmation of stoichiometry by quantitative RT-PCR. Absolute copy numbers were estimated by including a spike-in that was quantitated by spectrophotometry. The ratio of spike-in molecules relative to cell number is shown above the gel panel. A titration series from 25:1 to 400:1 was performed. Identical Xist primers were used for PCR, with the spike-in molecule distinguishable by a 38-bp deletion in the amplicon. Equivalence was reached at ∼100:1.
Results and Discussion
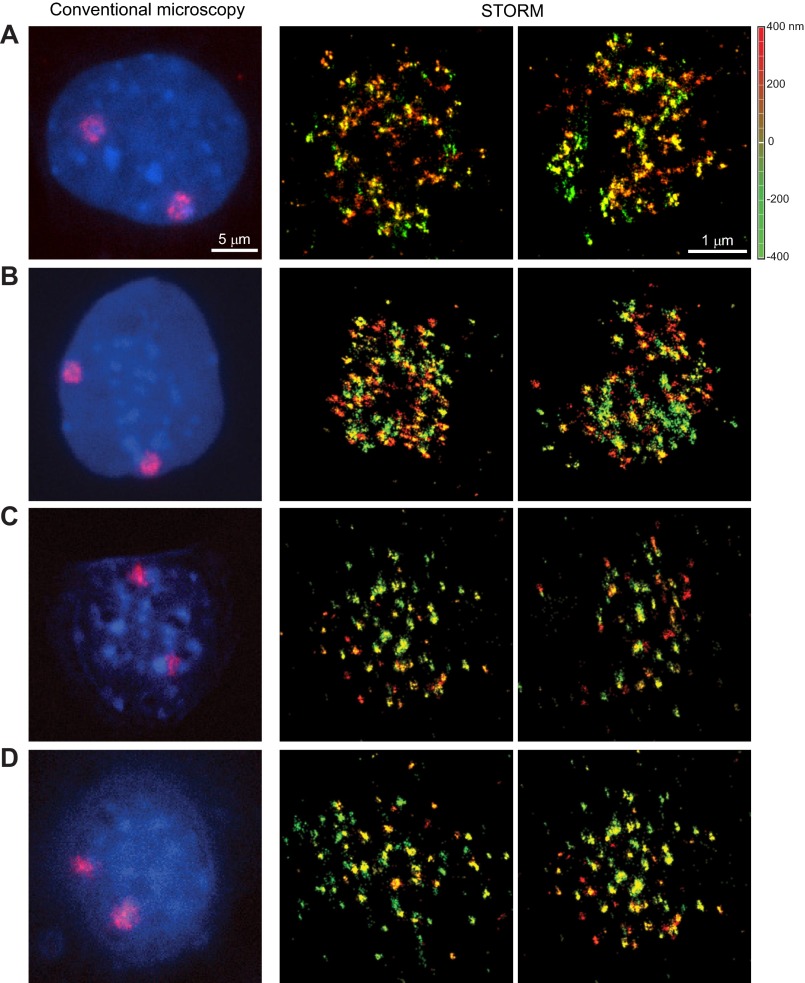
Using 3D STORM, we examined the spatial organization of the Xi in female mouse embryonic fibroblasts (MEFs) at 20-nm lateral and 50-nm axial resolution. Xist transcripts that were evident as an amorphous cloud by conventional microscopy (Fig. 1A) now appeared as discrete Xist puncta within the Xi territory (Fig. 1B and Fig. S1). Interestingly, we observed an average of only 53 Xist puncta per cloud (s.d. of 13.9, n = 50, Fig. 1C). This estimate is considerably lower than the previously published estimates of 300–2,000 Xist transcripts in ES cells and mouse tissues (25, 26), raising the possibility that each punctum could harbor an aggregate of transcripts rather than a single molecule.
Fig. S1.
3D STORM imaging of Xist RNA is not affected by various fixation methods. (A) Cells were fixed in PFA and then permeablized in Triton-X 100 before RNA FISH. (B) Cells were preextracted in CSK + 0.5% Triton-X 100 before fixation in PFA. (C) Cells were fixed and permeablized in cold MeOH. (D) Cells were fixed and permeablized in cold Carnoy fixative (MeOH:acetic acid = 3:1). Depth in the z-plane was color-coded from red (+400 nm) to green (−400 nm).
To quantitate the number of Xist molecules within each punctum, we measured the number of “blinking” events (fluorescence emissions) per punctum. Because blinking is stochastic over time and each fluorophore can blink multiple times during the imaging window, we normalized blinking frequencies to a reference unit derived from singly labeled probes bound to the slide (Fig. 1 D and E). Each Xist probe contained a mixture of three single occupancy oligonucleotide probes, each end-labeled by a single fluorophore. By normalizing to the reference unit, we derived the number of probes per Xist punctum in the Xi territory. Although there was a range of blinking frequencies due to the stochastic nature in dye chemistry, labeling, and detection, we observed that a majority of puncta harbored 2–6 probes, with a peak occurring at ∼3 probes (Fig. 1E). This outcome suggested that, if the hybridization efficiency were close to perfect, each punctum would represent 1–2 Xist molecules. This finding would imply that the Xi is covered only by 70–100 Xist molecules in MEF cells.
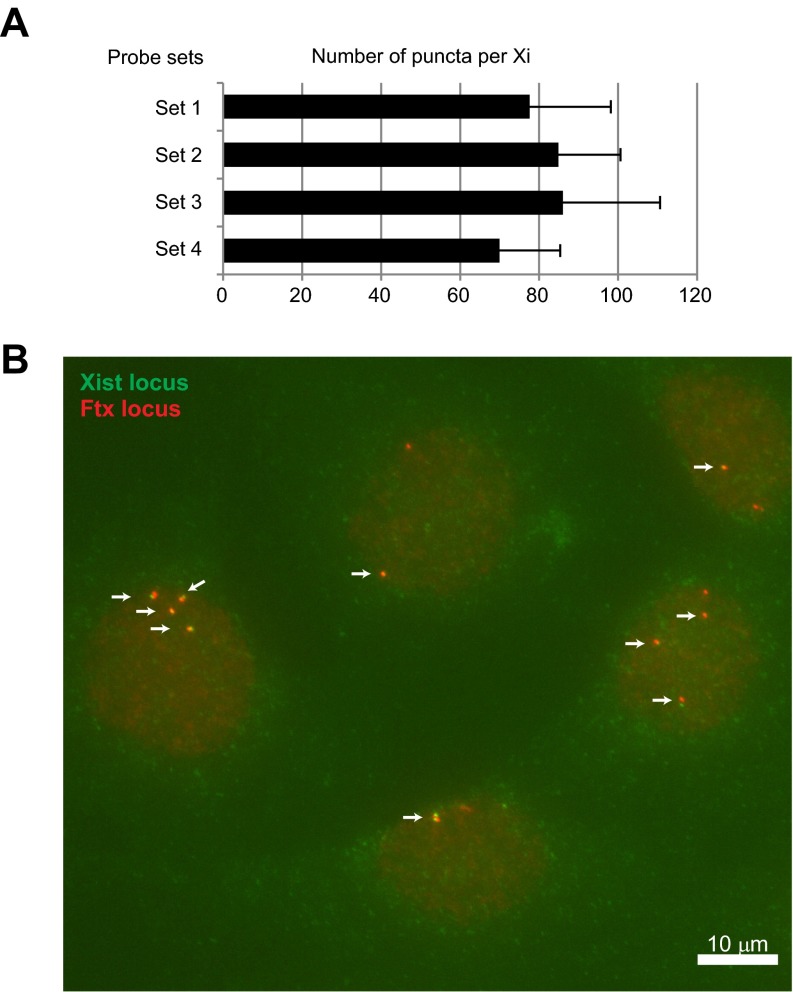
We compared the number of detected Xist puncta with one, three, or eight probes in the probe set (Fig. S2A). The number of puncta was similar regardless of whether we used one or more oligos in the RNA FISH, even when the eight-probe mixture targeting Repeats C and E (totaling >30 potential occupancies per Xist transcript) was used. Measuring the blinking frequency using a single probe (Fig. S2A, set 1) yielded a similar result of 1.3 probes per punctum, consistent with the above estimate of 1–2 Xist molecules per Xist punctum. Given potential limitations of incomplete probe hybridization, we validated this assumption using an independent approach. By quantitative RT-PCR, we determined the absolute copy numbers of Xist RNA per cell. We performed a titration series in which we spiked into the whole cell extract a known quantity of a modified Xist amplicon (distinguishable by a 38-bp deletion) (Fig. 1F) (26). Xist RNA and the control amplicon reached molar equivalence at ∼100 spiked-in copies per cell. Because the immortalized MEF cell line contained a mixture of diploid and tetraploid cells (averaging 1.6 Xist clouds per cell), qPCR analysis suggested an absolute Xist RNA copy number of ∼63 per Xi, an estimate very close to the estimate provided by STORM quantitation. Even if we allowed for a reduced hybridization efficiency of 50% as previously reported for RNA FISH (27), our analysis would still suggest only 100–200 molecules of Xist per Xi. Thus, STORM and PCR quantitation together argue that each Xist cloud contains not much more than 50–100 Xist transcripts.
Fig. S2.
Hybridization efficiency of FISH experiments. (A) Probes reached saturating conditions for RNA FISH at the puncta level. The number of Xist puncta with different probe sets were counted in MEF cells after RNA FISH. Four different probe sets were tested in RNA FISH: Set 1 with a single probe containing five labels; Set 2 with three probes of five labels each; Set 3 with three probes of one label each (used in Fig. 1C); or Set 4 containing a pool of eight probes targeting Repeats C and E and the three-probe set (Set 2). The detected signals did not differ statistically, indicating that RNA FISH has reached saturating conditions. Please note that higher number of puncta here compared with Fig. 1C probably due to experimental variation. (B) DNA FISH of the Xist using probe Set 4 and an Ftx-containing BAC probe as a control shows efficient detection of single-copy Xist targets. Arrows indicate loci detected by both Xist oligoprobe and control Ftx BAC probe.
Thus, the stoichiometry of Xist RNA to the Xi is much lower than previously thought (25, 26). At only 50–100 transcripts, there would be sufficient RNA to cover only 1% of the Xi at any one time, or only one gene out of every 10–20. This stoichiometry visualized at the single cell level contrasts sharply with the broad domains of Xist coverage shown by CHART-seq (10, 14), on the basis of which one might imagine that nearly every nucleotide on the Xi is covered by Xist RNA. These contrasts highlight the need to couple powerful epigenomic tools with single-cell technologies for direct visualization at the subchromosomal level.
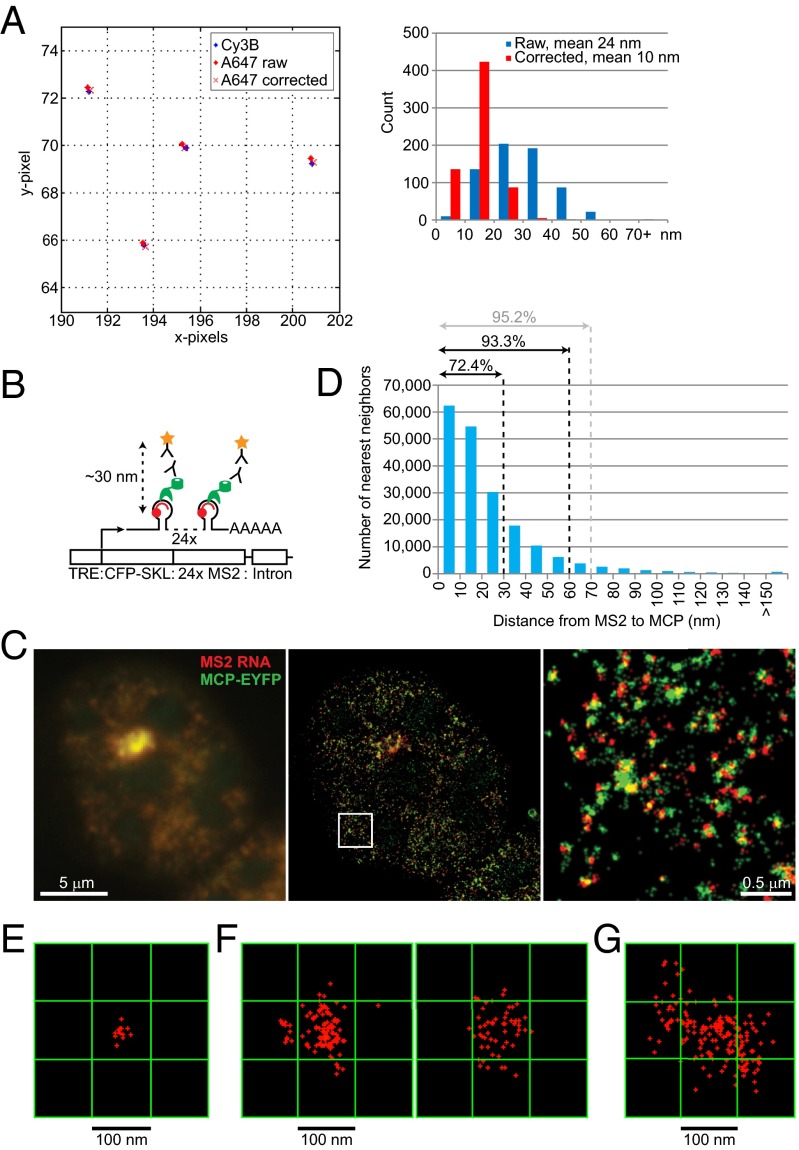
The unexpectedly low number of Xist transcripts led us to question how Xist can target PRC2 so broadly to the Xi, resulting in the chromosome-wide enrichment of H3K27me3 as demonstrated by ChIP-seq analysis (11, 15) and by conventional microscopic techniques (7, 9, 12, 13, 17, 28). Moreover, although biochemical analysis indicates that Xist and PRC2 directly interact (7, 29, 30) and it is known that they nucleate together at the Xic (8), whether Xist and PRC2 stay together as they spread along the Xi has not been answered definitively by epigenomic analyses (10, 11, 15). Additionally, a recent analysis using 3D-SIM with 100-nm resolution suggested that Xist RNA and PRC2 are spatially separated on the Xi, to a degree that called into question the idea that Xist recruits PRC2 to the Xi (20). We therefore addressed the localization of Xist and PRC2 using superresolution STORM. To visualize two factors simultaneously, we used two-color STORM. At a resolution of 20 nm, physical factors, such as chromatic aberration, could have major effects on measurements of point-to-point distances. To correct for chromatic aberration, images from green and red channels were aligned using fluorescent TetraSpeck beads with 561- and 647-nm lasers, and a polynomial function was derived using Matlab to map localization coordinates between channels. The mapping process was then applied to all two-color STORM acquisitions to align the two color channels (Fig. 2A).
Fig. 2.
Defining colocalization events. (A) Correcting for chromatic aberration: A representative two-color STORM image using Tetraspeck beads is shown (Left) with notable separation due to chromatic aberration before correction. A histogram of distances between channels is shown (Right). The mean distance between two channels was 24 nm before correction and reduced to 10 nm after correction. (B) Correcting for space occupied by components pf the detection system: Schematic diagram of the 2-6-3 cell system used as a control, adapted and simplified from Janicki et al. (31). MS2 stem-loop sequence was detected by an Alexa 647-labeled complementary oligo probe (red), whereas MCP-EYFP (green) was detected by a primary anti-GFP antibody and Cy3B-labeled secondary antibody (star). (C) Conventional microscopy of MS2 RNA FISH (red) and MCP IF (green) shows overlapping signals (Left). STORM images of the same nucleus (Center) with higher magnification (Right) show an obvious separation due to components of the detection system. (D) Distances from MS2 RNA to the nearest MCP are plotted. (E) One Xist punctum in MEF cells measured ∼30 × 30 nm2 when visualized by one oligonucleotide probe. Red crosses represent individual blinking events. (F) Xist puncta enlarged to >100 × 100 nm2 when 5′-to-3′ tiling probes were used in MEF cells. Two representative Xist puncta are shown. (G) Xist puncta appeared even larger (up to 200 × 200 nm2) in differentiating ES cells going through XCI and chromosome conformational changes for the first time.
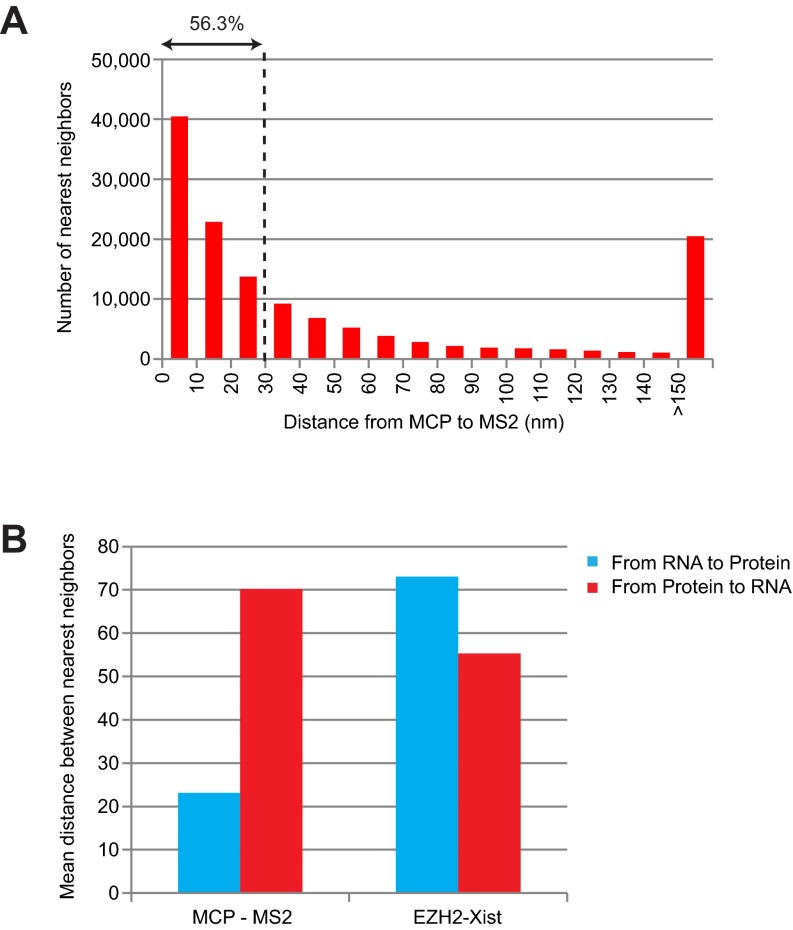
At a 20-nm resolution, a major consideration for point-to-point measurements is the volume occupied by components of the detection system. In the immuno RNA FISH system, there are typically five degrees of separation between the two fluorophore dyes: The fluorophore-conjugated secondary antibody recognizes the primary antibody, which binds to the epitope of interest, which binds the RNA, which is in turn recognized by a fluorophore-conjugated oligonucleotide probe. We empirically measured the range of distances caused by these separations using the control MCP-MS2 system, in which an expressed fusion RNA containing 24 repeats of the MS2 stem-loop is recognized by an MCP:EYFP fusion protein (31) (Fig. 2B). We determined the additional point-to-point distance generated by the size of the fluorophore-conjugated anti-GFP antibodies (star), the MCP-EYFP epitope (green), and the MS2 oligo probe (red). By conventional microscopy, no spatial separation between the RNA probe (red, MS2 RNA) and antibody (green, against MCP-EYFP) was evident (Fig. 2C, Left), as the superimposed red and green signals resulted in a yellow signal. However, at super resolution, the two molecules were discrete and spatially separated (Fig. 2C, Center and Right). The red (MS2) and green signals (MCP) were tightly juxtaposed and, in some instances, overlapping (yellow; most likely due to 3D rotations that led to stacking of the two factors in the z-plane and also the multimerized MS2 repeats). As a result, Pearson’s correlation coefficient (r) was a mere 0.3, and Mander’s colocalization coefficient was <0.5 when calculated in either direction (MS2-to-MCP versus MCP-to-MS2), falsely giving the impression that MS2 and MCP were not colocalized in the superresolution image. To account for the artificial physical separation created by detection system, we calculated the nearest neighbor distance between MS2 and MCP (Fig. 2D). This analysis indicated that 72.4% of MS2:MCP associations were measured within 30 nm, 93.3% within 60 nm, and 95.2% within 70 nm (Fig. 2D). Thus, events separated by 30–50 nm might be considered “colocalized” in this system.
The length of nucleic acids could also artificially increase the apparent point-to-point distance. Given that Xist RNA is 20-kb, the placement of probes relative to the protein binding site could be a significant factor. We could not use two-color STORM to estimate the extra distance because, although Cy3B or Alexa 568 dyes have been successfully combined for two-color FISH for STORM when they are conjugated on antibodies, these dyes do not have sufficient blinking frequencies for STORM imaging when conjugated on oligonucleotides. Therefore, we estimated the additional distance created by the 20-kb probe separation by determining the difference between Xist particle sizes when visualized by a single oligonucleotide versus a set of Xist tiling probes. When Xist RNA was visualized using only one oligonucleotide harboring a total of five dyes, Xist puncta measured as a cluster of blinks covering an area of ∼30 nm × 30 nm, near the lateral resolution of STORM imaging (Fig. 2E). Puncta of MS2 RNA (1.2-kb sequences) also appeared as 30-nm × 30-nm spots. Given that the lateral resolution of STORM is 20 nm for Alexa 647 dye using a single-objective detection scheme, the 30-nm × 30-nm area indicates that we were operating nearly at the resolution limit under our imaging condition when using a single probe. On the other hand, when visualized using a mixture of tiling probes spanning the 5′ and 3′ ends of Xist RNA (totaling 34 oligonucleotides with maximum 74 occupancies per transcript), Xist puncta measured greater than 100 nm × 100 nm in MEF (Fig. 2F). In differentiating ES cells where XCI is establishing de novo, Xist puncta were as much as 200 nm × 200 nm in differentiating ES cell (Fig. 2G), a somewhat larger area likely due to the Xi not being fully condensed during this establishment phase. Thus, a 20-kb probe separation within Xist RNA could increase point-to-point distances by an additional 100 nm in MEF cells, depending on where the Xist probe is set relative to the fluorescently labeled antibodies. These empirical observations imply that it would be physically impossible for the fluorophores in an immuno RNA FISH experiment to be perfectly overlapped.
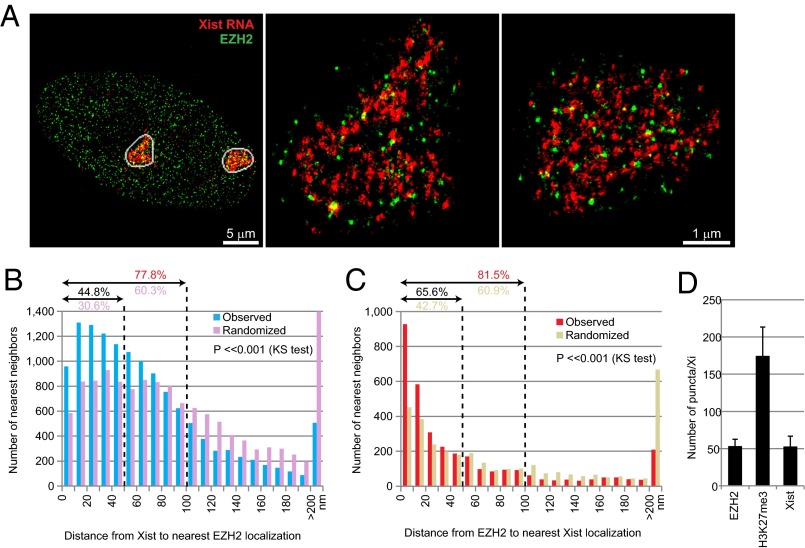
We therefore took a statistical approach to examining the localization of PRC2 relative to Xist RNA on the Xi by two-color STORM. To visualize PRC2, we used an antibody to EZH2, the catalytic subunit of PRC2 (32, 33). To visualize Xist end to end, we used the mixture of tiling oligonucleotides. The immuno RNA FISH revealed that Xist and EZH2 puncta were indeed nonoverlapping, but nonetheless appeared close to each other in the Xi territory (Fig. 3A). We quantified the relationship by measuring the point-to-point distance between nearest neighbors, from each Xist localization (single STORM blink) to the nearest EZH2 blink (Fig. 3B) and reciprocally from one EZH2 blink to the nearest Xist blink (Fig. 3C). We then compared the distribution of these nearest neighbor distances to that of a randomized model in we randomly shuffled the Xist blink within the Xi territory. Significantly, there was an enrichment of Xist-EZH2 pairs in the shortest bins (0–50 nm) [Fig. 3B; Kolmogorov–Smirnov (KS) test, P < <0.001]. Approximately 45% of Xist -EZH2 pairs were within 50 nm of each other (30.6% in randomized control), and 77.8% were within 100 nm (60.3% in randomized control), within the range of distances that would be consistent with physical colocalization, in view of the imaging caveats raised above. Reciprocally, there was a similar enrichment of EZH2-Xist pairs in the 0–20 nm bins (Fig. 3C; KS test, P < <0.001). Approximately 66% of pairs were within 50 nm of each other (42.7% in randomized control), and 81.5% were within 100 nm (60.9% in randomized control) again, consistent with the idea of colocalization punctum (rather than to the nearest EZH2 blink), we obtained similar statistically significant results compared with a randomized model (Fig. S3A). Reciprocal measurements from the center of each EZH2 punctum to the closest Xist blink also yielded the same findings (Fig. S3B).
Fig. 3.
STORM and statistical analysis indicate the physical proximity between Xist RNA and EZH2 on the Xi. (A) STORM imaging of Xist RNA (red) and EZH2 (green) in a MEF cell (Left). Two Xi (white circles) are shown at a higher magnification (Center and Right). (B and C) Distribution of nearest neighbor distances from Xist to the nearest EZH2 localization (B) or from EZH2 to the nearest Xist localization (C). The percentages (%) within 50 and 100 nm distances (dotted lines) are indicated. P values [Kolmogorov–Smirnov (KS) test] for observed versus randomized distributions are shown in each plot. (D) Average numbers of Xist, EZH2, and H3K27me3 puncta per Xi are shown with s.d. Sample size (n) = 50 for Xist, 8 for EZH2, 12 for H3K27me3.
Fig. S3.
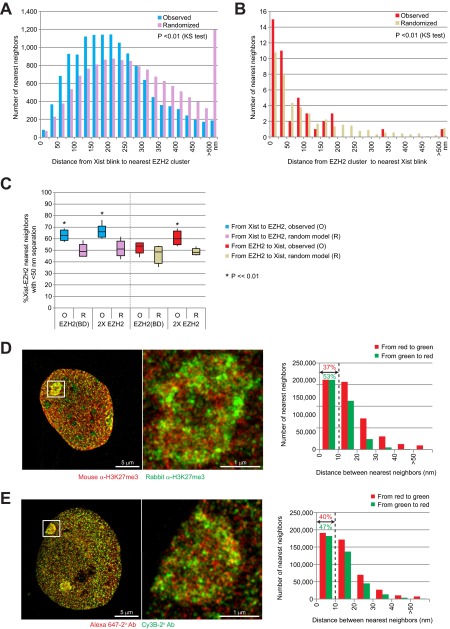
Control experiments provide evidence that components of the detection system contribute to physical separation between epitopes. (A and B) Reanalysis of Fig. 3 B and C by measuring nearest neighbor distances from each Xist localization (single STORM blink) to the center of the nearest EZH2 cluster (A) or from the center of EZH2 cluster to the nearest Xist blink, instead of measuring blink-to-blink distances (B). Center coordinates of EZH2 clusters were randomized within the Xist cloud as a control analysis. Histogram of randomized control represents mean values from 100 randomization results. Median nearest neighbor’s distances from Xist to EZH2 cluster or from EZH2 cluster to Xist are 205 nm or 37 nm, respectively. Mean of median nearest neighbor’s distances from Xist to randomized controls or from randomized control to Xist are 260 nm or 66 nm, respectively. Kolmogorov–Smirnov (KS) tests were performed between observed and each of 100 randomized controls. P values for all 100 KS tests were smaller than 0.01. (C) Association between Xist and EZH2 was observed regardless of choice of EZH2 antibodies. Shown is the percent of Xist-EZH2 nearest neighbors with <50-nm separation using various EZH2 antibodies or combinations. EZH2 (BD), BD Bioscience BD612666; 2xEZH2, a pool of two antibodies (Cell Signaling Technology CST3147 and BD Bioscience BD612666). The results were similar to those obtained using a mouse monoclonal antibody (Fig. 3, Cell Signaling Technology CST3147). (D) When two different primary antibodies to H3K27me3 were used (rabbit H3K27me3 Active Motif AM39155 versus mouse H3K27me3 Active Motif AM39535), nearest neighbors were separated by 10–30 nm. (Right) Immunofluorescence. (Left) Quantitation of nearest neighbor distances. (E) Even when two different secondary antibodies were used to detect a single primary antibody against rabbit H3K27me3, clear separations of 10–30 nm were evident between nearest neighbors. The secondary antibodies were labeled either by Alexa 647 or by Cy3B to one primary antibody against H3K27me3. (Right) Immunofluorescence. (Left) Quantitation of nearest neighbor distances.
Similar results were obtained when using either a different EZH2 antibody or a pool of two EZH2 antibodies (Fig. S3C), arguing against the possibility of an antibody detection issue. Furthermore, we noted that when the same protein epitope (H3K27me3) was imaged using two primary antibodies by indirect immunofluorescence, the degree of separation between fluorophores was significant, with nearest neighbors being separated by 10–30 nm (Fig. S3D). When a mixture of two different secondary antibodies was used to detect the same primary antibody, the spatial separations of 10–30 nm were also observed between nearest neighbors (Fig. S3E). Thus, the detection system indeed contributes significantly to the spatial separation observed between two epitopes. We conclude that Xist and EZH2 are found close to each other more often than by chance alone, supporting the idea of functional tethering between Xist RNA and PRC2.
Next we examined EZH2 and Xist RNA’s cytological stoichiometry. STORM analysis showed that, like Xist RNA, EZH2 does not form a uniform cloud over the Xi (Fig. 3A). EZH2 patterns were highly punctate, contrasting with previously reported ChIP-seq profiles where EZH2 binding was observed at thousands of positions along the Xi across a cell population (11). Interestingly, by STORM quantitation, we observed only 54 EZH2 puncta per Xi, a number consistent with the deduced number of Xist puncta per Xi (Fig. 3D). These puncta could represent either a single PRC2 complex or an aggregate of PRC2 (Fig. 3 A and D). The latter could be more likely because of varying intensities of PRC2 staining between foci and because of our previous ChIP-seq findings of ∼150 major Polycomb stations (11). Nevertheless, STORM analysis indicates an essentially “stoichiometric” relationship between Xist and EZH2 puncta on the Xi, furthering supporting the idea of a functional tethering between the two factors. Importantly, their proximity and nearly equal stoichiometries argue that Xist and PRC2 remain associated as they spread along the Xi. However, we note that, because a small minority (∼20%) of PRC2 puncta showed >100-nm separation from Xist RNA (Fig. 3 B and C), a subset of Xi-bound PRC2 molecules may dissociate, at least transiently, from Xist RNA during spreading. Overall, it is likely that Xist and PRC2 nucleate together at the Xic and comigrate along the Xi.
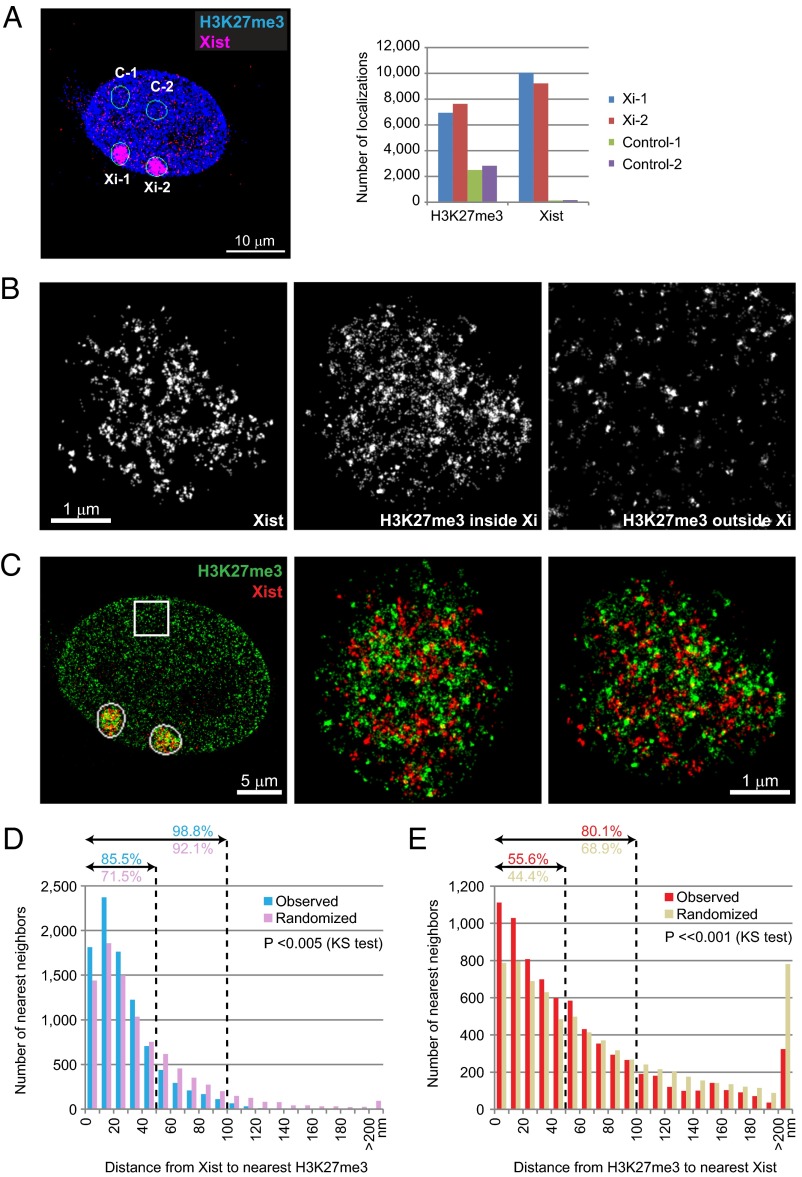
PRC2’s relationship to H3K27me3 was substoichiometric (Fig. 3D), consistent with PRC2 being a catalytic factor (32, 33). By CHART-seq analysis, H3K27me3 was observed to parallel both Xist binding and PRC2 localization, covering broad swaths of the Xi (10, 14). Given differences between single-cell and population-wide views for Xist and EZH2, we examined localization of the repressive H3K27me3 mark on the Xi and its geographic relationship to Xist RNA and EZH2. As with EZH2, H3K27me3 epitopes were present throughout the nucleus as discrete puncta, but were enriched in the Xi territory (Fig. 4A). Notably, the pattern of H3K27me3 signals within the Xi was distinct from those elsewhere in the nucleus: Whereas large H3K27me3 clusters were observed in both the Xi and other genomic regions, the Xi was distinguished by the presence of numerous smaller and fainter puncta (Fig. 4B, compare Center and Right). At the single-cell level, the total number of H3K27me3 localizations was at least three- to fourfold higher within the Xist cloud than in other regions of the nucleus (Fig. 4 A and B), consistent with ChIP-seq data demonstrating a similar overall enrichment across the cell population (11). This quantity should be considered a minimum of H3K27me3 puncta, as the large of number of fine-grained H3K27me3 puncta and the occurrence of many overlapping signals rendered the absolute quantitation difficult. We also note the caveat that, as with all immunofluorescence experiments, detection may be limited by antibody avidity and occupancy. Because labeling density of antibodies and the affinity of different antibodies cannot be controlled precisely enough, the exact stoichiometry between EZH2 and H3K27me3 could not be determined. Therefore, we could not exclude the possibility that greater detection of H3K27me3 on the Xi is due to higher affinity of the H3K27me3 antibody. However, our proposed substoichiometric relationship of EZH2 relative to H3K27me3 is in general agreement with ChIP-seq studies and with the known catalytic relationship between EZH2 and H3K27me3. Moreover, within the Xi territory (Fig. 4B), Xist and H3K27me3 localizations were intermixed but showed only a minimal direct overlap (Fig. 4C, Pearson’s r < 0.1). As was the case for Xist and EZH2 localizations, statistical analysis showed that Xist and H3K27me3 localizations were observed to be moderately, but statistically significantly, closer to each other than expected by chance. This was the case regardless of whether we measured distances from Xist to the closest H3K27me3 localizations (Fig. 4D, KS test, P <<0.001) or from H3K27me3 to the closest Xist localizations (Fig. 4E; P <<0.001).
Fig. 4.
Relationship between Xist particles and H3K27me3 marks on the Xi. (A) H3K27me3 enrichment on the Xi. Numbers of localizations of H3K27me3 and Xist were plotted the Xi (Xi-1, Xi-2) versus control nucleoplasmic regions of same size and shape (C-1, C-2). H3K27me3 localizations were enriched ∼threefold on the Xi over nucleoplasm, whereas Xist localization is very specific. (B) High magnifications of images in C, rendered in black and white for visualization of contrast. H3K27me3 outside Xi is boxed area in C. (C) Color renditions of Xi-1 and Xi-2 showing the relationship between Xist RNA and H3K27me3 signals. (D and E) Distribution of nearest neighbor distances from Xist to the nearest H3K27me3 localization (D) or from H3K27me3 to the nearest Xist localization (E). The percentages (%) within 50- and 100-nm distances (dotted lines) are indicated. P values (KS test) for observed versus randomized distributions are shown in each plot.
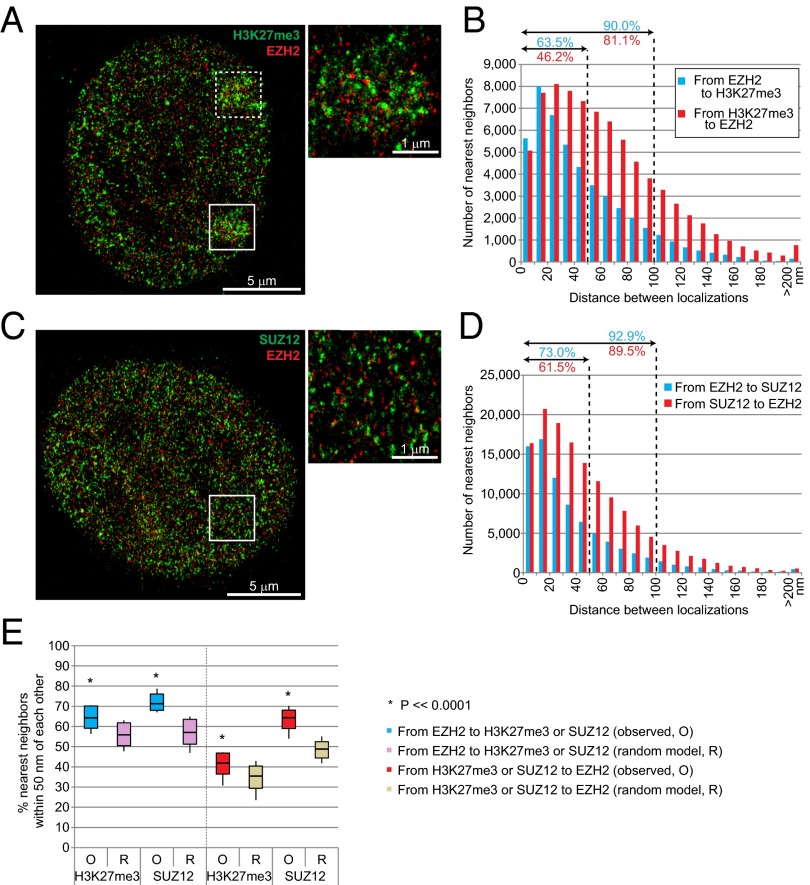
Based on our analysis, we suggest that the surprising finding of Cerase et al. (20) may have been a result of the spatial separation due to components of the detection system or the inefficient detection of target molecules. Notably, in their analysis, intersubunit distances within a single PRC2 complex were measured to be much greater (∼110 nm) than distances measured by electron microscopy (16 nm × 7 nm) (34). For comparison, we also measured distances between EZH2 and another PRC2 subunit, SUZ12, which should in principle be perfectly colocalized with EZH2. As expected, their signals were not superimposed, due to the space occupied by the antibody detection system and the less than 100% binding efficiency of the antibodies. Approximately 73% of EZH2 puncta was observed within 50 nm of SUZ12, and 92% within 100 nm (Fig. 5D). Reciprocally, more than 61% of SUZ12 was observed within 50 nm of EZH2, and 89% within 100 nm. The average separations between EZH2 and SUZ12 were 37 nm in one direction and 47 nm in the reverse direction. Nearest neighbor separations were generally smaller for EZH2-SUZ12 pairs than for EZH2-H3K27me3 pairs (Fig. 5 B, D, and E). Statistical analysis confirmed that colocalization of the two epitopes was nonrandom (Fig. 5E; P <<<0.0001).
Fig. 5.
Relationship between EZH2, SUZ12, and H3K27me3 localizations. (A) Representative STORM images of EZH2 and H3K27me3 in MEFs. Two distinct Xi’s are marked in solid and broken boxes. Higher magnification image of the solid boxed Xi is shown in the upper right. (B) Distances between nearest neighbors are plotted reciprocally between EZH2 and H3K27me3. The percentages (%) within 50- and 100-nm distances (dotted lines) are indicated. (C) Representative STORM image of EZH2 and SUZ12 in MEFs. Higher magnification image of the boxed area is shown in the upper right. (D) Distances between nearest neighbors are plotted reciprocally between EZH2 and SUZ12. The percentages (%) within 50- and 100-nm distances (dotted lines) are indicated. (E) EZH2 exhibited a high degree of colocalization with H3K27me3 and SUZ12. Boxes represent mean ± SD. Median is shown as a horizontal line within box. Vertical lines cover range of values. Student’s two-tailed t test, P <<< 0.0001 for all pairwise combinations.
Another problematic issue in the study of Cerase et al. was that use of population averages might have led to an artificially high separation distance, as pairs with extreme values (e.g., >150–200 nm separation) skewed the average considerably (20). Such averaging for our control MS2-MCP analysis would have also been misleading (Fig. S4): Most of the MS2 RNA molecules tightly paired with MCP, giving rise to short measured distances. However, because MCP might be expressed in excess of MS2 RNA, a fraction of MCP protein had no pairing partner and this fraction pushed the population average to 70 nm (Fig. S4B), giving the false impression that MS2 and MCP do not bind each other. A similar logic applied to Xist-EZH2 measurements (Fig. S4B): The number of events in the >200-nm bin (Fig. 3) was not negligible and these events skewed the population average to give the false impression of large spatial separations. By contrast, in the control experiments of Fig. S3D and S3E, the lack of pairing was not an issue (as the antibodies were detecting the same epitope), such that the number of nearest neighbors in the >50-nm bin was nearly negligible. Our statistical approach for nearest neighbor analysis circumvented the potential issues created by population averaging (Figs. 3 and 4).
Fig. S4.
Potential artifacts created by averaging nearest neighbor distances. (A) Distribution of nearest neighbor distances from MCP to MS2 RNA for the cell in Fig. 2C. Note the nonnegligible number of pairs in the >150-nm bin, most likely due to excess MCP proteins (unbound to MS2). These outliers significantly skew the average distance, creating the false impression that MS2 and MCP are not colocalized. (B) Mean of nearest neighbor distances from MS2 to MCP (left, blue bar) indicates tight association between MS2 and MCP; the reciprocal analysis from MCP to MS2 suggests greater separation for the reason indicated above (unbound MCP). A similar pattern was observed with Xist-EZH2 associations (see also Fig. 3).
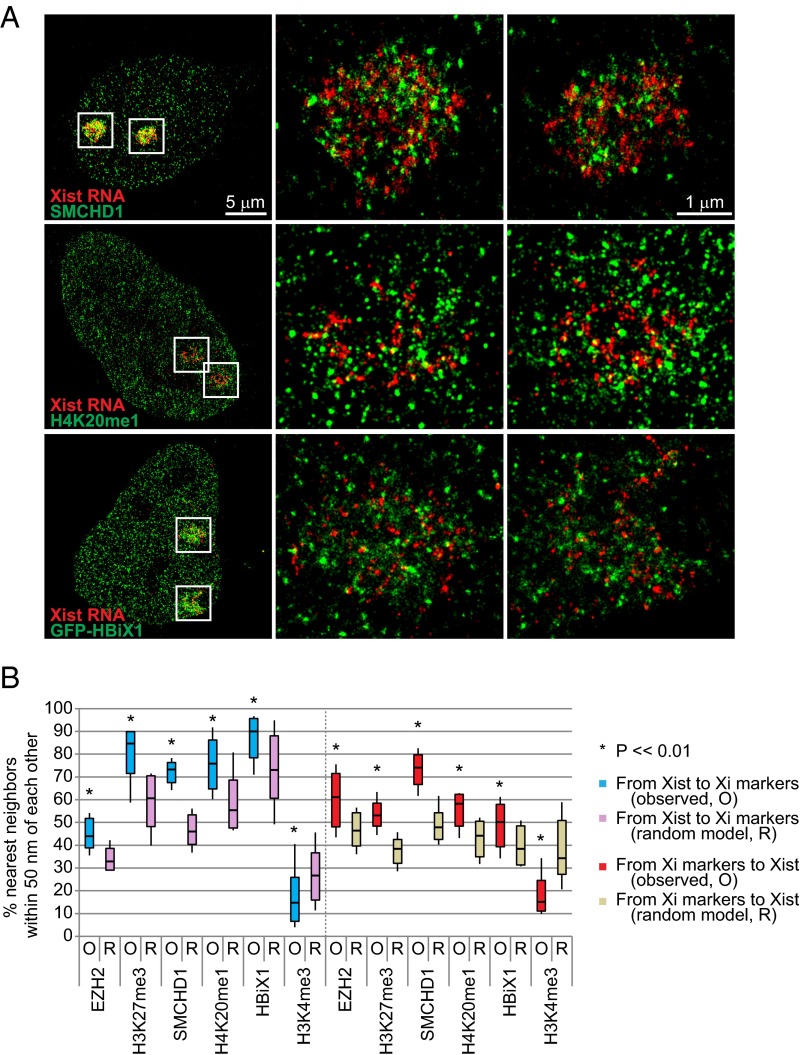
Taken together, our STORM analysis supports a functional tethering of Xist and PRC2 on the Xi. Although PRC2, YY1, ATRX, and hnRNP U are currently the only known directly interacting chromatin factors for Xist RNA (7, 8, 35, 36), several others have been shown to associate with the Xi in an Xist-dependent manner, including the condensin-like protein, SMCHD1 (37), the repressive histone mark, H4K20me1 (12), and a novel protein, HBiX1 (19). Here we examined their relationship to Xist RNA by STORM imaging and observed that all three epitopes showed a highly punctate staining pattern (Fig. 6A). None showed direct visual overlap but their localizations showed geographic proximity to Xist (Fig. 6A), measuring statistically significantly more molecules within 50 nm of the closest Xist signals than the randomized distribution (Fig. 6B). Again, empirically observed distances for all pairwise combinations were significantly lower than those predicted by randomized models (Fig. 6B; P <<0.01). By contrast, our negative control active chromatin mark, H3K4me3, showed significantly less proximity to Xist RNA and the measured distances between Xist and H3K4me3 exceeded those of the randomized model, consistent with H3K4me3 signals being outside of the Xi territory (Fig. 6B).
Fig. 6.
Association of Xist RNA with other Xi markers in MEFs. (A) STORM images of Xist RNA and SMCHD1 (Top), H4K20me1 (Middle), and GFP-HBiX1 (Bottom) in representative MEF cells. Two Xi territories are boxed and shown in at higher magnification in middle and right panels. (B) Summary of frequencies of Xist colocalization with several Xi markers. An active chromatin marker, H3K4me3 serves as a negative control. O, observed. R, random model. Boxes represent mean ± SD. Median is shown as a horizontal line within box. Vertical lines cover range of values. Student’s two-tailed t test: P <<0.01 for all pairwise combinations.
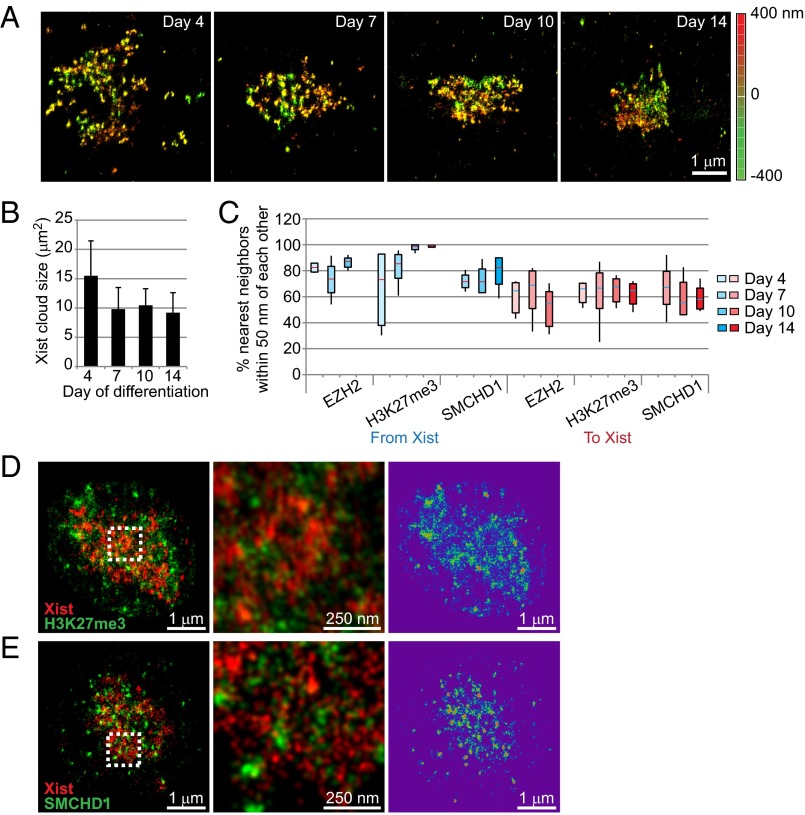
Next, we asked whether Xist RNA localization dynamics differ during the establishment phase of XCI and performed perturbation experiments to examine how Xist RNA and PRC2 relocalize onto the Xi. In differentiating mouse embryonic stem (ES) cells establishing XCI de novo, we observed that, although Xist RNA was as punctate in early differentiating ES cells as in MEFs, the density of puncta over the Xi increased (Fig. 7A) and the area occupied by the Xist cloud decreased (Fig. 7B) as differentiation progressed. At day 4, Xist puncta were relatively discernible, with Xist molecules spread across a larger territory than in later-stage differentiating ES cells. Between days 4 and 14, compaction of the cloud by up to 30% was evident, with individual Xist puncta becoming more difficult to discern by days 10 and 14 (Fig. 7 A and B). We then examined the differentiation dynamics for H3K27me3, EZH2, and SMCHD1 relative to Xist RNAs (Fig. 7 C–E). Interestingly, when nearest neighbor distances were calculated, Xist’s colocalization frequencies for the three Xi markers were higher than those in MEF (compare Fig. 7C to Fig. 6D). For example, the percentage of Xist-EZH2 distances that were ≤50 nm was significantly higher during ES cell differentiation (73–86%) than that MEF cells (45%). By day 10, almost all Xist RNA signals were tightly associated with H3K27me3, consistent with previous Xist binding data (10, 14). The differences between differentiating ES cells and MEF cells suggest that, during the de novo establishment of XCI (ES cells), a greater stoichiometry of Xist, PRC2, and other repressive chromatin factors may be recruited to convert an uncondensed active X to the fully repressed and compacted state of the Xi and that, during the maintenance state, relatively fewer molecules of the Xist complexes may be required. Indeed, although we estimate the Xist stoichiometry to be 50–100 per Xi in MEF cells (Fig. 1), previous estimates in differentiating ES cells using the same RT-PCR method with spike-in control of in vitro transcribed RNA suggested 300 transcripts per cell (26).
Fig. 7.
Organization of inactive X chromosome during differentiation of female ES cells. (A) 3D STORM of Xist RNA during ES cell differentiation from days 4–14. Depth in the z-plane is color-coded from red (+400 nm) to green (−400 nm). (B) The Xist cloud became compacted between days 4 and 7 of differentiation (error bar of SD). (C) Patterns of association with Xist RNA for three Xi markers (EZH2, H3K27me3, and SMCHD1) during ES cell differentiation. Boxes represent mean ± SD. Median is shown as a horizontal line within box. Vertical lines cover range of values. (D, Left) A representative STORM image of Xist (red) and H3K27me3 (green) from a day 14 ES cell is shown. (Center) Boxed area is shown at a higher magnification. (Right) H3K27me3 signals are shown in a rainbow map where red is most dense and purple is least dense. (E, Left) A representative STORM image of Xist (red) and SMCHD1 (green) from a day 14 ES cell is shown. (Center) Boxed area is shown at a higher magnification. (Right) H3K27me3 signals are shown in a rainbow map where red is most dense and purple is least dense.
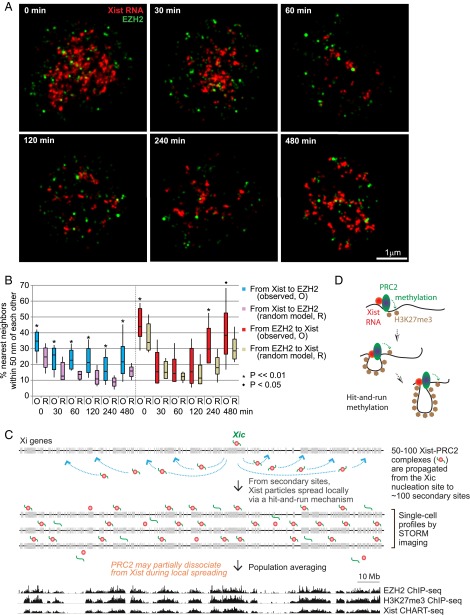
Finally, we investigated the behavior of PRC2 when Xist is acutely displaced from the Xi using the Xist “knock-off” technology (38). We administered to cells a locked nucleic acid (LNA) antisense oligonucleotide (ASO) directed against Xist RNA’s Repeat C region (38), the region which binds to YY1 and enables loading of the Xist-PRC2 complex to the Xi nucleation center (8). Consistent with previous conventional microscopy (38) and CHART-seq (32), STORM demonstrated that Xist RNA was stripped off of the Xi within 30–60 min of LNA treatment and remained displaced over a 6–8 h time course. At the resolution of single cells and single chromosomes, STORM analysis showed that the number of Xist puncta dropped dramatically between 0–3 h of treatment, with nearly all Xist molecules lost on the Xi by 1 h (Fig. 8A, red signals). Xist RNA remained largely displaced until the 8-h mark, when the number of Xist puncta began to approximate the unperturbed state. This rapid dissociation and eventual return provided a time window during which we could observe PRC2’s behavior, creating a proxy for real-time visualization, which is currently impossible by FISH or antibody labeling. Significantly, EZH2 puncta decreased in parallel with Xist RNA during the Xi-dissociation phase and reappeared next to Xist during the Xi-reassociation phase (Fig. 8A, green signals). The Xist and EZH2 puncta remained nonrandomly coclustered during the dynamic transitions surrounding delocalization and relocalization (Fig. 8 A and B). At the early time points (30, 60, and 120 min), the colocalization frequencies were not statistically significant for the EZH2-to-Xist measurements, most likely due to population averaging of distances. Indeed, when distributions were examined for each Xist cloud, KS tests revealed statistical significance (P < 0.05). Altogether, these data provided strong support for the functional tethering of Xist and PRC2 and the idea that they travel together as they spread along the length of the Xi.
Fig. 8.
Knock-off analysis indicates tethering of Xist and PRC2 during dissociation and relocalization, supporting a comigration along the Xi. (A) Representative STORM images of Xist and EZH2 immuno RNA FISH are shown at various time points after LNA treatment to knock off Xist-PRC2 complexes. (B) The percentage of nearest neighbors located within 50 nm of each other is shown, and differences between values for the observed (O) versus randomized (R) models at each time point were tested for statistical significance (Student’s two-tailed t test). (C) Summary: High-resolution single-cell view of Xist on the Xi, versus epigenomic profiling across a population. ChIP-seq (11) and CHART-seq (10) data as published. (D) One possible hit-and-run model: Xist-PRC2 complexes are anchored at secondary sites and serially methylate nucleosomes, looping out chromatin as it processes locally along the Xi.
In summary, based on our STORM analysis, we propose a unifying model that reconciles differences between population-based and single-cell analyses (Fig. 8C). The Xist-PRC2 complex first loads onto a single nucleation site at the Xic (8) and then spreads to 100 or so secondary sites on the Xi (11). With only 50–100 Xist-PRC2 complexes revealed at the single-cell level at a single point in time, we propose that complexes targeted to the secondary sites spread locally to methylate nucleosomes in a hit-and-run fashion. In one possible model, Xist and PRC2 are anchored at secondary sites and serially methylate nucleosomes, looping out chromatin substrates as they process along the chromosome (Fig. 8D). Each complex would have an average range of 1–3 Mb or 10–20 genes of the Xi. Because of hit-and-run movements, 50–100 such Xist-PRC2 complexes are visualized within the Xi territory at any given time. When summed over millions of cells, a number typically used for CHART-seq and ChIP-seq experiments, broad swaths of Xist and PRC2 binding are observed along the Xi, giving the impression of an RNA-protein “coat.” Interestingly, because ∼20% of PRC2 puncta showed a >100-nm separation from Xist RNA (Fig. 3 B and C), a subset of Xi-bound PRC2 molecules may dissociate, at least transiently, from Xist RNA during spreading, potentially aiding in the promulgation of PRC2 and H3K27me3 along the length of the Xi. Thus, STORM analysis at the single cell level has provided a high-resolution view of XCI dynamics and revealed a stoichiometry that could not be appreciated by epigenomic analysis.
Materials and Methods
RNA FISH and Immuno RNA FISH.
RNA FISH and immuno RNA FISH were performed as described elsewhere with minor modifications (39). After staining, cells were dehydrated in series of ethanol and stored in dark until STORM imaging. Detailed methods of cell and probe preparation and antibodies are listed in the SI Materials and Methods.
Measuring Xist RNA Copy Numbers by RT-PCR.
RT-PCR with in vitro transcribed spike-in Xist RNA harboring a 38-nt deletion was performed as described elsewhere (26). From a plate, 106 MEF cells were used for RT-PCR while a small fraction was used to count the number of Xist cloud by RNA FISH using a pool of eight oligonucleotide probes. The number of Xist cloud per cells was determined based on the number of observed Xist cloud and the number of nuclei counter stained by Hoechst 33342.
STORM Imaging and Analysis.
STORM imaging was performed on an N-STORM (Nikon) equipped with 100×/1.4 N.A. λ objective lens. For two color STORM imaging, sequential imaging with appropriate emission filters (Cy5 em filter for Alexa 647 and Cy3 em filter for Cy3B) was adapted to suppress any crosstalk. After a polynomical function was fitted between two channel STORM imaging of 100 nm TetraSpeck beads (Life Technology) by Matlab (Mathworks), all two-color STORM data sets were corrected accordingly. Xist cloud was identified based on localization density. Distances were measured from any Xist localization to all localizations of Xi markers within the cloud to determine nearest Xi marker localizations. For localization of Xi markers, reciprocal calculation was performed. To create the random model, Xist coordinates were randomly shuffled within the already defined area of each Xist cloud. Nearest neighbor’s distance between randomized Xist and Xi markers was calculated as described above.
SI Materials and Methods
Cell Culture.
Transformed MEF cell are grown on a gelatin coated glass coverslip. ES cells were grown on γ-irradiated MEF for 3 d before differentiation. Cells were trypsinized and feeders were moved. ES cells allowed differentiating in suspension, forming embryoid bodies (EB), for 4 d. For day 4 differentiation ES cells, cells were trypsinized and allowed to attach to a Cell-Tak (BD Biosciences) coated glass coverslip for 20 min at room temperature before harvest. For later time point, EBs were settled down on gelatin coated coverslip at day 4 and allowed further differentiation until harvest.
Probe Preparation.
For initial Xist RNA FISH (Fig. 1A), eight Alexa 647-labeled oligonucleotide probes were synthesized by IDT. Among them, three oligos bind to Xist at an equimolar ratio and were used to estimate Xist copy numbers. For single probe FISH, a 50mer oligonucleotide with five amine modifications (three internal amines and both terminal amines) was synthesized on Expedite 8909 oligonucleotide synthesizer (Applied Biosystems) and labeled by NHS-Alexa 647 (Life Technology). For immuno RNA FISH, a set of tiling probes (total 37 oligonucleotides) was used. Oligos with 5′ amine modification was synthesized by IDT and labeled by NHS-Alexa 647.
RNA FISH and Measuring Hybridization Efficiency.
RNA FISH was performed as described elsewhere with minor modifications (39). Cells on glass coverslip were rinsed in PBS and fixed in 4% (wt/vol) paraformaldehyde. After permeablized in PBS/0.5% Triton X-100 on ice, cells were washed in PBS and dehydrated in series of ethanol. Hybridization buffer contains 25% (vol/vol) formamide (for oligos shorter than 30-nt) or 50% (vol/vol) formamide (for long oligos of 50-nt), 2× SSC, 10% (wt/vol) dextran sulfate, 1mg/mL yeast tRNA and various oligonucleotide probes. RNA FISH was performed in a humidified chamber at 42 °C for 4–5 h for short tiling oligonucleotide probes or overnight for 50-nt long oligonucleotides. Cells were washed in 2× SSC and dehydrated in series of ethanol. Cells were air-dried and stored in dark until STORM imaging.
To calculate hybridization efficiency, the number of Xist puncta was counted after STORM imaging of RNA FISH using single probe, triple probes or eight probes. Assuming the detection probability by single probe p and the number of Xist n, binomial function was used. Simply, the number of puncta by single probe is n × p. Because STORM imaging enables single molecule detection, the probability of undetected Xist by any probe is (1 − p)3 if triple probes are used. Therefore, the number of puncta in triple probe FISH is n × (1 − (1− p) 3).
Measuring Xist RNA Copy Numbers.
A part of Xist harboring a 38-nt deletion (26) was in vitro transcribed using Maxiscript (Life Technology) according to the manufacturer’s instructions. Full length RNA was separated on a urea PAGE, eluted, and quantified by Nanodrop (Thermo Scientific). MEF cells are trypsinzed, counted, and split into two tubes, one for RNA isolation and the other for RNA FISH. As a spike-in reference, a determined number of in vitro transcribed Xist RNA ranging from 25 time to 400 time excess was added directly into TRIzol (Life Technology) lysate of 106 MEF cells. After RNA isolation, RT-PCR was performed using a primer set flanking the deletion site and PCR products (247-bp for endogenous Xist and 209-bp for spike-in reference) were separated on 2% (wt/vol) agarose gel. At the same time, MEF cells were cytospun to a slide and fixed in 4% (wt/vol) paraformaldehyde. (Cytospinning was used only for this experiment; all others below, except for day 4 differentiation ES cells, used cells grown on coverslips.) After permeablized in PBS/0.5% Triton X-100 briefly, RNA FISH was performed as described above using a pool of eight Alexa 647-labeled Xist oligonucleotide probes. The number of Xist cloud per cells was determined based on the number of observed Xist cloud and the number of nuclei counter stained by Hoechst 33342. Cells were observed on Nikon 90i microscope equipped with 60×/1.4 N.A. VC objective lens, Orca ER CCD camera (Hamamatsu), and Volocity software (Perkin-Elmer).
Immuno RNA FISH.
Immunofluorescence RNA FISH was performed as described elsewhere with minor modifications (39). Briefly, cells grown on coverslips were rinsed in PBS, pre-extracted in CSK/0.5% Triton X-100 on ice, washed in CSK, and fixed in 4% (wt/vol) paraformaldehyde. After blocked in 1% BSA for 20 min supplemented with 10 mM vanadyl ribonucleoside complex (New England Biolab) and protector RNase inhibitor (Roche), primary antibodies were incubated at room temperature for 1 h. Cells washed three times in PBS/0.02% Tween-20. After incubating with secondary antibody at room temperature, cells were washed again in PBS/0.02% Tween-20. Cell were fixed in 4% (wt/vol) paraformaldehyde and dehydrated in series of ethanol. RNA FISH was performed using a pool of Alexa 647-labeled Xist tiling oligonucleotides for 4–6 h at 42 °C in a humid chamber as described above. Cells were washed in 2× SSC, and dehydrated and stored at room temperature until imaging.
Antibodies.
The following primary antibodies were used; rabbit H3K27me3 (Active Motif, AM39155), mouse H3K27me3 (Active Motif, AM39535), and rabbit H4K20me1 (Active Motif, AM39727), rabbit SMCHD1 (Abcam, ab122555), mouse EZH2 (Cell Signaling Technology, CST3147, and BD Biosciences, BD612666), rabbit GFP (Abcam, ab290). Secondary antibodies were purchased from Millipore (Donkey anti mouse) or Jackson immune laboratory (Donkey anti rabbit). One hundred micrograms of secondary antibodies were labeled using various amounts of NHS-Cy3B (GE Healthcare), NHS-Alexa 405 (Life Technology), or NHS-Alexa 647. Labeled antibodies were purified using NAP-5 column (GE Healthcare) according to manufacturer’s instructions. Labeling stoichiometry of each antibody was checked by measuring OD280 and OD at λmax of specific dyes on Nanodrop.
STORM Imaging.
STORM imaging was performed on an N-STORM (Nikon) equipped with 100×/1.4 N.A. λ objective lens, ion ×3 EM CCD camera (Andor), and with 647-nm (300 mW), 561-nm (150 mW) and 405-nm lasers (100 mW) according to Nikon’s recommendation and previous publication (23). Imaging buffer containing 147 mM βME and GluOX (Sigma) was used to promote blinking and reduce photo-bleaching. For 3D STORM imaging, cylindrical lens was inserted to the optical path to introduce astigmatism. Z calibration was performed using 100-nm TetraSpeck beads (Life Technology). For two color STORM imaging, sequential imaging with appropriate emission filters (Cy5 em filter for Alexa 647 and Cy3 em filter for Cy3B) was adapted to suppress any crosstalk. Briefly, imaging of Alexa 647 was done only with a 647-nm laser and Cy5 emission filter for the first 10,000 frames. After that, emission filter was changed to Cy3 emission filter, 561-nm laser was turned on, and 647-nm laser was turned off to acquire Cy3B channel. N-STORM module in Element software (Nikon) was used to control microscopes, acquire images, and perform 2D and 3D STORM localizations.
Alignment of Two-Color STORM.
100-nm TetraSpeck beads were used to correct chromatic aberration by MatLab (Mathworks). In brief, single molecule localization was performed on TetraSpeck beads with 561-nm and 646-nm lasers using Nikon Element’s N-STORM module for Cy3B and Alexa 647 channels, respectively. Coordinates of STORM localizations for two channels were imported into Matlab. Cp2tform function in Matlab was used to fit a polynomial function between two channel localizations. All two color STORM data set was corrected accordingly.
Analysis of STORM Data.
After Cy3B localization data set was extracted by MatLab, drift in Cy3B localization was corrected by N-STORM software. Correction formula for chromatic aberration was applied to the drift-corrected Cy3B STORM data by MatLab. Finally, Cy3B channel data were combined to Alexa 647 channel data set. Calculation of distance between two nearest neighbors was performed in MatLab. Briefly, the coordinates of individual Xist localization (single STORM blinking) was binned to according to its x and y pixel position to generate a density map. Gaussian filter was applied and holes were filled by imfill function. Kmeans function was used to identify the boundary of Xist cloud. Distances were measured from any Xist localization within determined cloud to all localizations of Xi markers within surrounding 5 × 5 pixels to optimize computing time. Minimum value was stored for each Xist localization. If there was no nearest neighbor within 200 nm, 200 nm was used as maximum possible distances. For localization of Xi markers, reciprocal calculation was performed. Histogram of nearest neighbor distances were plotted to find portion of colocalization. To create the random model, Xist coordinates were randomly shuffled within the already defined area of Xist cloud. Nearest neighbor’s distance between randomized Xist and Xi markers was calculated as described above.
To measure the nearest distance between Xist localizations and EZH2 localization clusters, EZH2 clusters were identified from Gaussian rendered STORM images in MatLab. Briefly, the image of EZH2 within the Xist cloud was processed by median filter (medfilt2) and converted to a binary image using a threshold (graythresh). After small objects were removed (bwareaopen), identified clusters of EZH2 were cross-correlated with EZH2 localization coordinates (xcorr2). From corresponding EZH2 localizations, the center of each EZH2 cluster (mean) was used to calculate the nearest neighbors’ distance between Xist localizations and EZH2 clusters. The center coordinates of EZH2 clusters were randomized within Xist cloud and used as a randomized control.
LNA Transfection.
MEF cells were transfected as described (38). Briefly, 2 × 10⁶ MEF cells were resuspended in 100 μL of Nucleofector MEF II solution (Lonza) containing 2 μM repeat C LNA (Exiqon). After nucleofection was performed according to manufacturer’s recommendation, cells were diluted in PBS and allowed to settle on a Cell-Tak coated coverslip for 10 min at room temperature. Complete media was added and cells were cultured in CO2 incubator until harvest at various time.
Acknowledgments
We thank Dr. Xiaowei Zhuang for critical comments on the manuscript and many helpful discussions regarding STORM. We also thank members of the Lee laboratory for support and valuable discussions; D. Spector (Cold Spring Harbor Laboratory) for the 2-6-3 cell line; Benjamin Heuberger (Massachusetts General Hospital) for oligo synthesis; Do-hyun Kim (Food and Drug Administration), Christopher E. Carr (MGH), Hongshin Sunwoo, and Doory Kim (Zhuang laboratory) for help with MatLab programming. H.S. was supported by the MGH Fund for Medical Discovery. J.Y.W. was supported by National Science Foundation Graduate Research fellowship. J.T.L. was supported by NIH RO1-GM090278. J.T.L. is an Investigator of the Howard Hughes Medical Institute.
Footnotes
The authors declare no conflict of interest.
This article is a PNAS Direct Submission.
This article contains supporting information online at www.pnas.org/lookup/suppl/doi:10.1073/pnas.1503690112/-/DCSupplemental.
References
- 1.Starmer J, Magnuson T. A new model for random X chromosome inactivation. Development. 2009;136(1):1–10. doi: 10.1242/dev.025908. [DOI] [PMC free article] [PubMed] [Google Scholar]
- 2.Wutz A. Gene silencing in X-chromosome inactivation: Advances in understanding facultative heterochromatin formation. Nat Rev Genet. 2011;12(8):542–553. doi: 10.1038/nrg3035. [DOI] [PubMed] [Google Scholar]
- 3.Disteche CM. Dosage compensation of the sex chromosomes. Annu Rev Genet. 2012;46:537–560. doi: 10.1146/annurev-genet-110711-155454. [DOI] [PMC free article] [PubMed] [Google Scholar]
- 4.Lee JT. Gracefully ageing at 50, X-chromosome inactivation becomes a paradigm for RNA and chromatin control. Nat Rev Mol Cell Biol. 2011;12(12):815–826. doi: 10.1038/nrm3231. [DOI] [PubMed] [Google Scholar]
- 5.Brown CJ, et al. The human XIST gene: Analysis of a 17 kb inactive X-specific RNA that contains conserved repeats and is highly localized within the nucleus. Cell. 1992;71(3):527–542. doi: 10.1016/0092-8674(92)90520-m. [DOI] [PubMed] [Google Scholar]
- 6.Clemson CM, McNeil JA, Willard HF, Lawrence JB. XIST RNA paints the inactive X chromosome at interphase: Evidence for a novel RNA involved in nuclear/chromosome structure. J Cell Biol. 1996;132(3):259–275. doi: 10.1083/jcb.132.3.259. [DOI] [PMC free article] [PubMed] [Google Scholar]
- 7.Zhao J, Sun BK, Erwin JA, Song JJ, Lee JT. Polycomb proteins targeted by a short repeat RNA to the mouse X chromosome. Science. 2008;322(5902):750–756. doi: 10.1126/science.1163045. [DOI] [PMC free article] [PubMed] [Google Scholar]
- 8.Jeon Y, Lee JT. YY1 tethers Xist RNA to the inactive X nucleation center. Cell. 2011;146(1):119–133. doi: 10.1016/j.cell.2011.06.026. [DOI] [PMC free article] [PubMed] [Google Scholar]
- 9.Silva J, et al. Establishment of histone h3 methylation on the inactive X chromosome requires transient recruitment of Eed-Enx1 polycomb group complexes. Dev Cell. 2003;4(4):481–495. doi: 10.1016/s1534-5807(03)00068-6. [DOI] [PubMed] [Google Scholar]
- 10.Simon MD, et al. High-resolution Xist binding maps reveal two-step spreading during X-chromosome inactivation. Nature. 2013;504(7480):465–469. doi: 10.1038/nature12719. [DOI] [PMC free article] [PubMed] [Google Scholar]
- 11.Pinter SF, et al. Spreading of X chromosome inactivation via a hierarchy of defined Polycomb stations. Genome Res. 2012;22(10):1864–1876. doi: 10.1101/gr.133751.111. [DOI] [PMC free article] [PubMed] [Google Scholar]
- 12.Kohlmaier A, et al. A chromosomal memory triggered by Xist regulates histone methylation in X inactivation. PLoS Biol. 2004;2(7):E171. doi: 10.1371/journal.pbio.0020171. [DOI] [PMC free article] [PubMed] [Google Scholar]
- 13.Plath K, et al. Role of histone H3 lysine 27 methylation in X inactivation. Science. 2003;300(5616):131–135. doi: 10.1126/science.1084274. [DOI] [PubMed] [Google Scholar]
- 14.Engreitz JM, et al. The Xist lncRNA exploits three-dimensional genome architecture to spread across the X chromosome. Science. 2013;341(6147):1237973. doi: 10.1126/science.1237973. [DOI] [PMC free article] [PubMed] [Google Scholar]
- 15.Calabrese JM, et al. Site-specific silencing of regulatory elements as a mechanism of X inactivation. Cell. 2012;151(5):951–963. doi: 10.1016/j.cell.2012.10.037. [DOI] [PMC free article] [PubMed] [Google Scholar]
- 16.Duthie SM, et al. Xist RNA exhibits a banded localization on the inactive X chromosome and is excluded from autosomal material in cis. Hum Mol Genet. 1999;8(2):195–204. doi: 10.1093/hmg/8.2.195. [DOI] [PubMed] [Google Scholar]
- 17.Chadwick BP, Willard HF. Multiple spatially distinct types of facultative heterochromatin on the human inactive X chromosome. Proc Natl Acad Sci USA. 2004;101(50):17450–17455. doi: 10.1073/pnas.0408021101. [DOI] [PMC free article] [PubMed] [Google Scholar]
- 18.Gendrel AV, et al. Smchd1-dependent and -independent pathways determine developmental dynamics of CpG island methylation on the inactive X chromosome. Dev Cell. 2012;23(2):265–279. doi: 10.1016/j.devcel.2012.06.011. [DOI] [PMC free article] [PubMed] [Google Scholar]
- 19.Nozawa RS, et al. Human inactive X chromosome is compacted through a PRC2-independent SMCHD1-HBiX1 pathway. Nat Struct Mol Biol. 2013;20(5):566–573. doi: 10.1038/nsmb.2532. [DOI] [PubMed] [Google Scholar]
- 20.Cerase A, et al. Spatial separation of Xist RNA and polycomb proteins revealed by superresolution microscopy. Proc Natl Acad Sci USA. 2014;111(6):2235–2240. doi: 10.1073/pnas.1312951111. [DOI] [PMC free article] [PubMed] [Google Scholar]
- 21.Smeets D, et al. Three-dimensional super-resolution microscopy of the inactive X chromosome territory reveals a collapse of its active nuclear compartment harboring distinct Xist RNA foci. Epigenetics Chromatin. 2014;7:8. doi: 10.1186/1756-8935-7-8. [DOI] [PMC free article] [PubMed] [Google Scholar]
- 22.Rust MJ, Bates M, Zhuang X. Sub-diffraction-limit imaging by stochastic optical reconstruction microscopy (STORM) Nat Methods. 2006;3(10):793–795. doi: 10.1038/nmeth929. [DOI] [PMC free article] [PubMed] [Google Scholar]
- 23.Dempsey GT, Vaughan JC, Chen KH, Bates M, Zhuang X. Evaluation of fluorophores for optimal performance in localization-based super-resolution imaging. Nat Methods. 2011;8(12):1027–1036. doi: 10.1038/nmeth.1768. [DOI] [PMC free article] [PubMed] [Google Scholar]
- 24.Huang B, Wang W, Bates M, Zhuang X. Three-dimensional super-resolution imaging by stochastic optical reconstruction microscopy. Science. 2008;319(5864):810–813. doi: 10.1126/science.1153529. [DOI] [PMC free article] [PubMed] [Google Scholar]
- 25.Buzin CH, Mann JR, Singer-Sam J. Quantitative RT-PCR assays show Xist RNA levels are low in mouse female adult tissue, embryos and embryoid bodies. Development. 1994;120(12):3529–3536. doi: 10.1242/dev.120.12.3529. [DOI] [PubMed] [Google Scholar]
- 26.Sun BK, Deaton AM, Lee JT. A transient heterochromatic state in Xist preempts X inactivation choice without RNA stabilization. Mol Cell. 2006;21(5):617–628. doi: 10.1016/j.molcel.2006.01.028. [DOI] [PubMed] [Google Scholar]
- 27.Femino AM, Fay FS, Fogarty K, Singer RH. Visualization of single RNA transcripts in situ. Science. 1998;280(5363):585–590. doi: 10.1126/science.280.5363.585. [DOI] [PubMed] [Google Scholar]
- 28.Wang J, et al. Imprinted X inactivation maintained by a mouse Polycomb group gene. Nat Genet. 2001;28(4):371–375. doi: 10.1038/ng574. [DOI] [PubMed] [Google Scholar]
- 29.Cifuentes-Rojas C, Hernandez AJ, Sarma K, Lee JT. Regulatory interactions between RNA and polycomb repressive complex 2. Mol Cell. 2014;55(2):171–185. doi: 10.1016/j.molcel.2014.05.009. [DOI] [PMC free article] [PubMed] [Google Scholar]
- 30.Davidovich C, et al. Toward a consensus on the binding specificity and promiscuity of PRC2 for RNA. Mol Cell. 2015;57(3):552–558. doi: 10.1016/j.molcel.2014.12.017. [DOI] [PMC free article] [PubMed] [Google Scholar]
- 31.Janicki SM, et al. From silencing to gene expression: Real-time analysis in single cells. Cell. 2004;116(5):683–698. doi: 10.1016/s0092-8674(04)00171-0. [DOI] [PMC free article] [PubMed] [Google Scholar]
- 32.Simon JA, Kingston RE. Occupying chromatin: Polycomb mechanisms for getting to genomic targets, stopping transcriptional traffic, and staying put. Mol Cell. 2013;49(5):808–824. doi: 10.1016/j.molcel.2013.02.013. [DOI] [PMC free article] [PubMed] [Google Scholar]
- 33.Di Croce L, Helin K. Transcriptional regulation by Polycomb group proteins. Nat Struct Mol Biol. 2013;20(10):1147–1155. doi: 10.1038/nsmb.2669. [DOI] [PubMed] [Google Scholar]
- 34.Ciferri C, et al. Molecular architecture of human polycomb repressive complex 2. eLife. 2012;1:e00005. doi: 10.7554/eLife.00005. [DOI] [PMC free article] [PubMed] [Google Scholar]
- 35.Hasegawa Y, et al. The matrix protein hnRNP U is required for chromosomal localization of Xist RNA. Dev Cell. 2010;19(3):469–476. doi: 10.1016/j.devcel.2010.08.006. [DOI] [PubMed] [Google Scholar]
- 36.Sarma K, et al. ATRX directs binding of PRC2 to Xist RNA and Polycomb targets. Cell. 2014;159(4):869–883. doi: 10.1016/j.cell.2014.10.019. [DOI] [PMC free article] [PubMed] [Google Scholar]
- 37.Blewitt ME, et al. SmcHD1, containing a structural-maintenance-of-chromosomes hinge domain, has a critical role in X inactivation. Nat Genet. 2008;40(5):663–669. doi: 10.1038/ng.142. [DOI] [PubMed] [Google Scholar]
- 38.Sarma K, Levasseur P, Aristarkhov A, Lee JT. Locked nucleic acids (LNAs) reveal sequence requirements and kinetics of Xist RNA localization to the X chromosome. Proc Natl Acad Sci USA. 2010;107(51):22196–22201. doi: 10.1073/pnas.1009785107. [DOI] [PMC free article] [PubMed] [Google Scholar]
- 39.Sunwoo H, et al. MEN epsilon/beta nuclear-retained non-coding RNAs are up-regulated upon muscle differentiation and are essential components of paraspeckles. Genome Res. 2009;19(3):347–359. doi: 10.1101/gr.087775.108. [DOI] [PMC free article] [PubMed] [Google Scholar]


