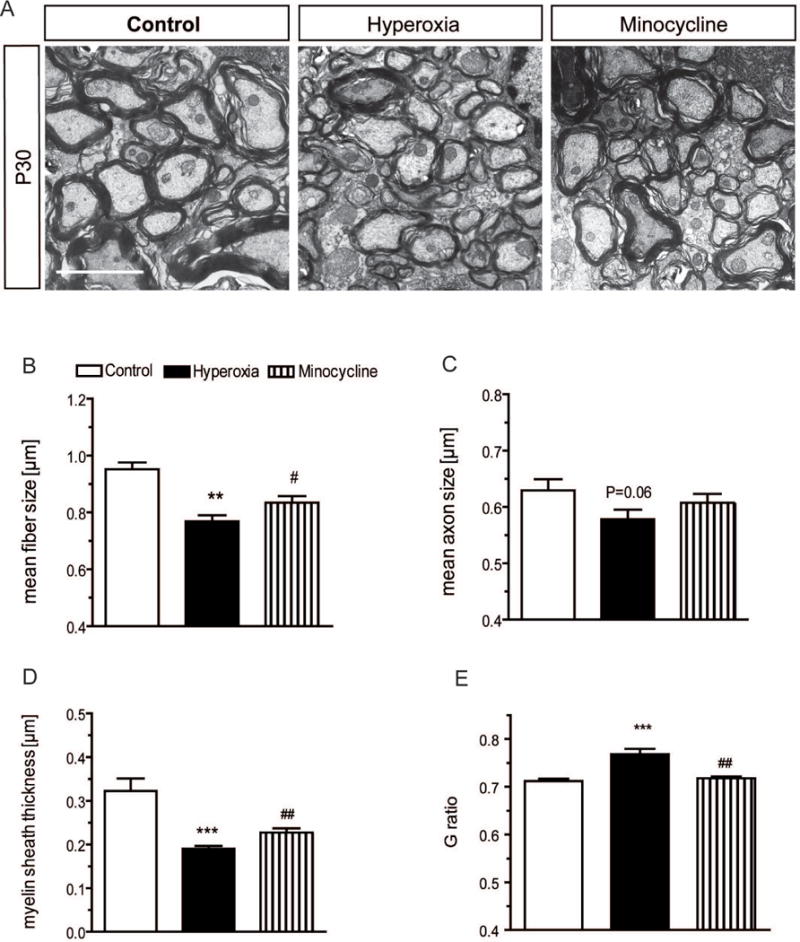
Figure 6. Electron microscopy of myelinated axons in the cerebellum.

Electron microscopy was performed in sagittal sections of the cerebellum of P30 rats to analyze ultrastructure of myelinated axons (A). Mean size of fibers (B) (i.e., inner axon plus myelin sheath) and myelin sheath thickness (D) are significantly diminished after hyperoxia in comparison to control litters. (C) Mean size of axons tended to be lower after hyperoxia, indicating only borderline axonopathy. (E) In accordance with pronounced reduction of myelin sheath, G ratio is higher in radial images of axons obtained from hyperoxia rats. In animals that received minocycline during exposure to hyperoxia, fiber size and myelin sheath thickness were significantly higher, and G ratio was significantly lower in comparison to hyperoxia-exposed rats without drug treatment (A-E). Images are taken at 10,000-fold magnification. Scale bar indicates 1 μm. (n=3 per group, 500 axons per animal; **P<0.01 and ***P<0.001 vs. control; #P<0.05, ##P<0.01 vs. hyperoxia; ANOVA with consecutive t-test).
