

Abstract
Purpose
To investigate associations between imaging features and mutational status of clear cell renal cell carcinoma (ccRCC).
Materials and methods
This multi-institutional, multi-reader study included 103 patients (77 men; median age 59 years, range 34–79) with ccRCC examined with CT in 81 patients, MRI in 19, and both CT and MRI in three; images were downloaded from The Cancer Imaging Archive, an NCI-funded project for genome-mapping and analyses. Imaging features [size (mm), margin (well-defined or ill-defined), composition (solid or cystic), necrosis (for solid tumors: 0%, 1%–33%, 34%–66% or >66%), growth pattern (endophytic, <50% exophytic, or ≥50% exophytic), and calcification (present, absent, or indeterminate)] were reviewed independently by three readers blinded to mutational data. The association of imaging features with mutational status (VHL, BAP1, PBRM1, SETD2, KDM5C, and MUC4) was assessed.
Results
Median tumor size was 49 mm (range 14–162 mm), 73 (71%) tumors had well-defined margins, 98 (95%) tumors were solid, 95 (92%) showed presence of necrosis, 46 (45%) had ≥50% exophytic component, and 18 (19.8%) had calcification. VHL (n = 52) and PBRM1 (n = 24) were the most common mutations. BAP1 mutation was associated with ill-defined margin and presence of calcification (p = 0.02 and 0.002, respectively, Pearson’s χ2 test); MUC4 mutation was associated with an exophytic growth pattern (p = 0.002, Mann–Whitney U test).
Conclusions
BAP1 mutation was associated with ill-defined tumor margins and presence of calcification; MUC4 mutation was associated with exophytic growth. Given the known prognostic implications of BAP1 and MUC4 mutations, these results support using radiogenomics to aid in prognostication and management.
Keywords: Clear cell renal cell carcinoma, CT, MRI, Mutational status, Radiogenomics
Renal cell carcinoma (RCC) is the most common of the renal malignancies that would account for an estimated 61,560 new patients and 14,080 deaths in the United States in 2015 [1]. Clear cell RCC (ccRCC) is the most common histologic subtype of RCC [2] and is a genetically heterogeneous and biologically diverse disease [3]. Recent advances in genetics have led to the identification of several mutations associated with ccRCC [4–9]. The association of a deactivating mutation of von Hippel-Lindau (VHL) tumor suppressor gene, located on the short arm of chromosome 3, has been recognized for many years [10–12]. Several other mutations, including those involving the BRCA1-associated protein 1 (BAP1), polybromo 1 (PBRM1), SET domain containing 2 (SETD2), and lysine (K)-specific demethylase 5C (KDM5C) have been identified more recently [4–9]. The identification of genetic mutations is clinically relevant because both an advanced stage and poor survival have been associated with VHL, PBRM1, BAP1, SETD2, and KDM5C mutations [4, 13–15]. For example, the BAP1 mutation has been associated with an increased sensitivity to radiation therapy and possibly to an increased sensitivity to the inhibitors of mammalian target of rapamycin complex 1 (mTORC1 inhibitors) [5, 16]. Therefore, knowledge of the genetic make-up of an individual patient’s tumor could help assess the patient’s prognosis, and could be considered when planning the treatment [4, 13, 14].
Historically, the role of diagnostic imaging in patients with RCC has been limited to the diagnosis and staging of the disease, and to following patients both during and after treatment. However, recent advances in cancer genomics have led to an interest in using imaging as a noninvasive determinant of mutational status and to complement genomic analysis in characterizing disease biology, a ‘sub-field’ known as ‘radiogenomics’ [17]. Imaging might then be used as a biomarker that would help prognosticate, aid in treatment selection, and predict treatment response [18].
To our knowledge, there has been only one, single-institution report on the association of imaging features and mutational status of ccRCC [18]. In order for radiogenomics to be used in clinical practice, a larger body of evidence is needed. Therefore, the purpose of this multi-institutional study was to investigate associations between imaging features and mutational status of ccRCC.
Methods
The cancer genome atlas
The Cancer Genome Atlas (TCGA) is an ongoing project funded by the National Cancer Institute (NCI) and the National Human Genome Research Institute (NHGRI) with the purpose of creating an atlas of genetic changes related to more than 20 tumor types, including ccRCC. After obtaining institutional review board approval at all participating institutions, the submitted tissue samples underwent a comprehensive multiplatform genomic characterization and analysis. Available pretreatment imaging studies were uploaded in DICOM format to the Cancer Imaging Archive (TCIA), an NCI-supported archive of anonymized medical images, each connected by a unique identifier to the tissue samples from the TCGA, both of which are accessible for public download [19]. The Cancer Genome Atlas–Renal Cell Carcinoma (TCGA–RCC) Imaging Research Group was formed to study the radiogenomics of ccRCC.
Patient cohort
In this study, we included the first 103 patients from the TCGA data portal (77 men; median age 59 years, range 34–79) who had pre-surgical CT scans and/or MRI examinations (81 had with CT, 19 had MRI, and three had both CT and MRI) available for review. Of the 103 patients included in our cohort, 78 patients had been included in a separately conducted independent study by Karlo et al. [18], the contents of which were not known at the time of performing our study.
Image feature set development
The image feature set was developed for the purpose of this study by the TCGA–RCC Research Group in consensus. The following features were evaluated for each tumor: size (in mm), margin [well-defined (Fig. 1A) or ill-defined (Fig. 1B)], composition [solid (Fig. 2A) or cystic (Fig. 2B)], necrosis [assessed only for solid tumors: 0%, 1%–33% (Fig. 3A), 34%–66% (Fig. 3B) or >66% (Fig. 3C)], growth pattern [endophytic (Fig. 4A), <50% exophytic (Fig. 4B), or ≥50% exophytic (Fig. 4C)], and calcification [absent, present (Fig. 5), or indeterminate]. Size was recorded as the maximum tumor dimension in the axial plane on nephrographic or excretory phase images. Margin was considered to be well-defined if >90% of the entire tumor circumference (including the interface with renal parenchyma, sinus and perinephric fat, and collecting system) was ‘pencil-thin’ sharp when viewed on either the nephrographic or excretory phase images using a narrow window setting. When both nephrographic and excretory phases were available and there was discordance between the two, the phase that showed the most well-defined tumor was used. Regarding composition, a tumor was considered to be cystic when ≥50% of tumor volume was cystic, defined as fluid attenuation values (≤20 Hounsfield Units); a cystic tumor needed to contain one or more well-demarcated cystic spaces each of which showing at least 25% their walls as smooth. Tumors with <50% cystic component or those without sharply demarcated cystic component were considered to be solid. Among solid tumors, the proportion of necrosis (defined as hypodense, non-enhancing areas which were not sharply demarcated and lacked apparent walls) was assessed on nephrographic or excretory phase. After these image feature definitions were developed in consensus, a training set of 11 cases (not included in the study cohort) were scored by the readers.
Fig. 1.
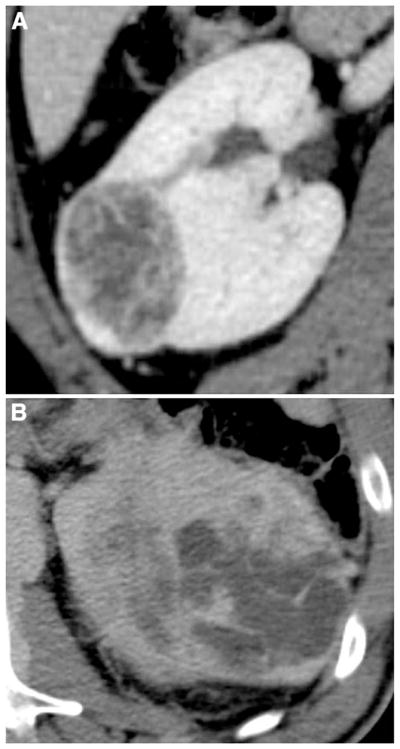
Illustration of margin assessment of clear cell RCC (ccRCC): A well-defined margin and B ill-defined margin.
Fig. 2.
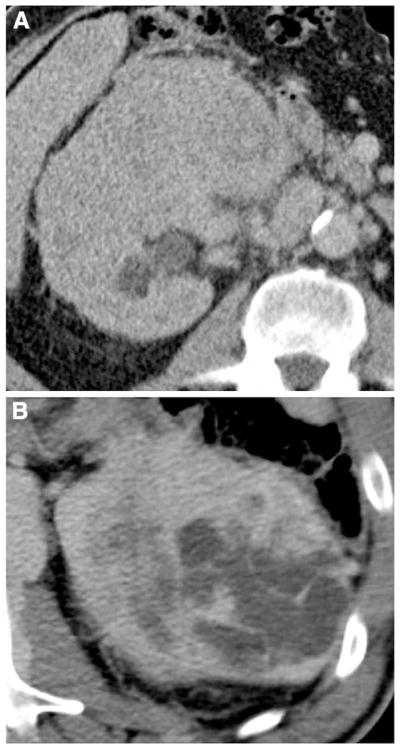
Illustration of composition of ccRCC: A solid and B cystic ccRCC.
Fig. 3.
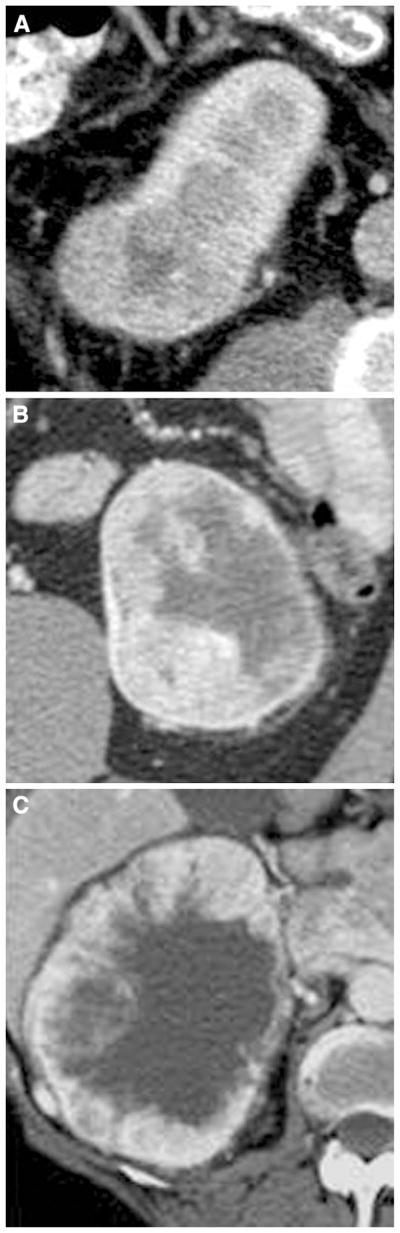
Illustration of presence of necrosis assessed in solid ccRCC: A 1%–33% necrosis; B 34%–66% necrosis; C >66% necrosis.
Fig. 4.
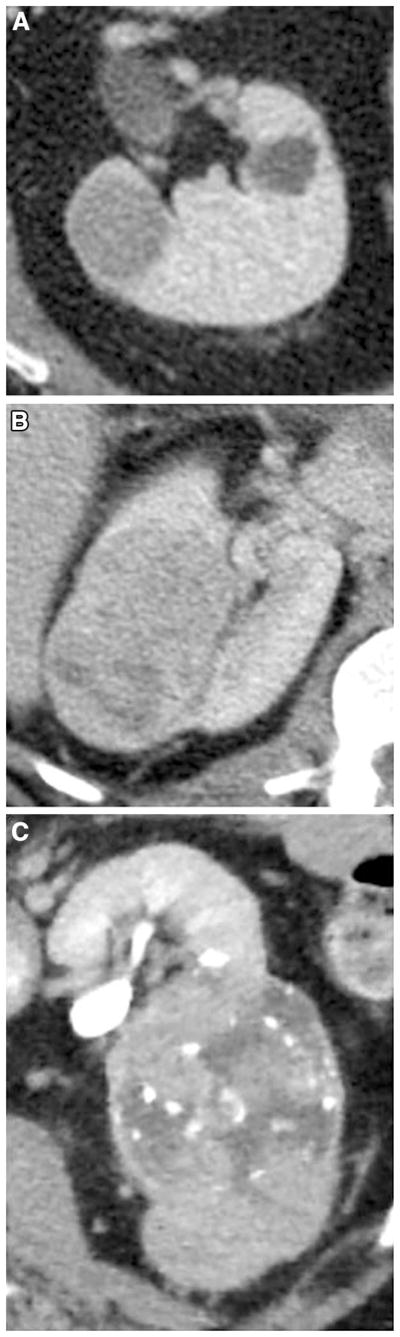
Illustration of growth pattern of ccRCC: A endophytic; B <50% exophytic; C ≥50% exophytic.
Fig. 5.
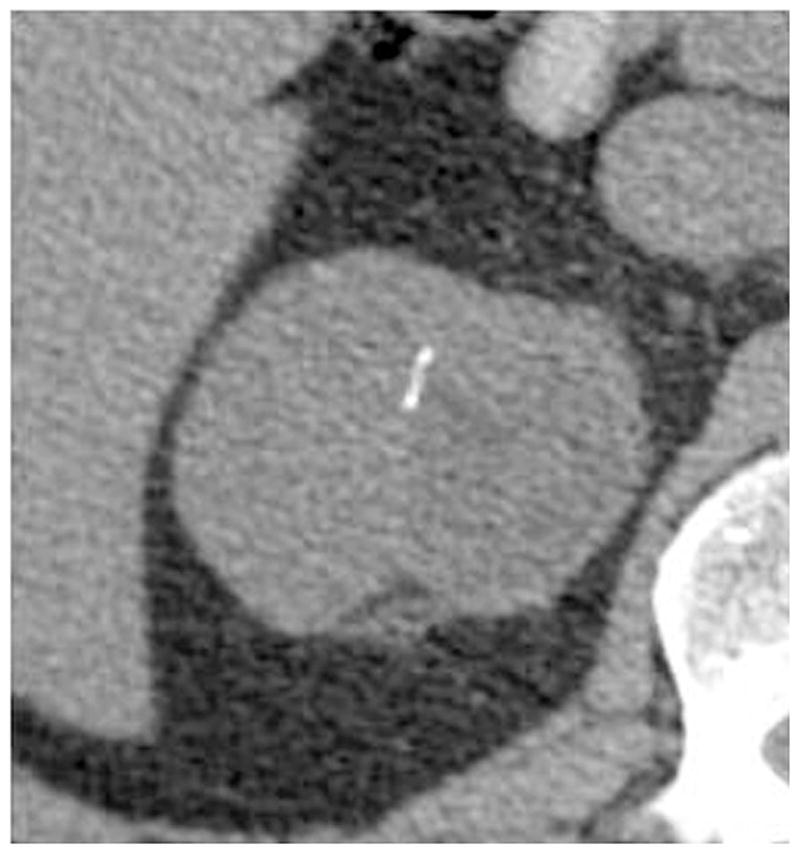
Illustration of a ccRCC with presence of calcification.
Image review
Each case was reviewed by three radiologists, randomly assigned from a pool of 13 academic radiologists from seven teaching institutions, each with fellowship training in abdominal imaging (7–16 years of experience). The readers were blinded to the clinical and mutational data. The cases were reviewed on a cloud-based virtual machine using the ClearCanvas viewer (Version 3.5.0.1 Northwestern University, Chicago, IL) [20–22]. The reviewers were able to adjust the image size, window, and level setting. Also, the readers could evaluate the images in any available plane (axial, coronal, or sagittal), however, all size measurements were obtained in the axial plane. Each ccRCC was independently scored by each of the three readers using the predefined feature set. The data were uploaded to a central server, and then compiled and analyzed by a statistician.
Mutational status
The presence of mutations in VHL, PBRM1, MUC4, SETD2, BAP1, and KDM5C, the six most commonly mutated genes in the TCGA KIRC cohort, was identified for each case using the cBioPortal.
Statistical analysis
The inter-observer agreement for tumor size was assessed by computing the intra-class correlation coefficient (ICC) [23]; 95% confidence intervals (CI) were computed using the technique from Swiger et al. [24]. The inter-observer agreement for the other features was assessed using Krippendorff’s alpha [25, 26]; 95% CI for alpha were computed using the nonparametric bootstrap, where within each bootstrap iteration, patients were sampled with replacement [27]. Krippendorff’s α below 0.667 indicates low inter-observer agreement [26].
To analyze the association of each image feature with mutational status, the imaging features recorded by the three readers were summarized into a single summary value. For tumor size and ordinal features such as the amount of necrosis and growth pattern, the median of the values reported by the readers was used as the summary value. For binary features such as composition, margin, or the presence of calcification, the most commonly selected value among the readers was used as the summary value.
Pearson’s χ2 test was used to test the null hypothesis of no association between individual binary features and mutational status. The odds ratio of the association between each binary feature and mutational status was also computed, and 95% CI of these odds ratios were constructed using parametric bootstrap [28]. Odds ratios greater than one indicate a positive association (presence of the image feature is associated with presence of the mutation and absence of the image feature is associated with absence of the mutation), whereas those less than one indicate a negative association (presence of the image feature is associated with absence of the mutation and absence of the image feature is associated with presence of the mutation) and those equaling one indicate no association.
The Mann–Whitney U test was used to analyze the association between individual ordinal and quantitative features and mutational status. Concordance probability, namely the probability that any randomly chosen patient with a mutation having a higher value of the image feature than any randomly chosen patient without the mutation, for each image feature and mutation was also computed; the concordance probability equals the Mann–Whitney U statistic divided by the product of the number of patients with the mutation times the number of patients without [29]. 95% CI were constructed using stratified bootstrap [30]. Concordance probabilities greater than 0.5 indicate a positive association (greater values of the image features are associated with presence of the mutation), whereas those less than 0.5 indicate a negative association (smaller values of the image features are associated with presence of the mutation) and those equaling 0.5 indicate no association. Correction for multiple testing was performed through the Benjamini–Hochberg procedure [31]. The statistical analyses were performed using R [32].
Results
Imaging features
The median tumor size was 49 mm (range 14–162 mm, interquartile range 34 mm) (Table 1). Of 103 tumors, 73 (71%) had well-defined margins. The vast majority (98/103, 95%) were solid, of which 95 (92%) showed necrosis. Of the 95 tumors with necrosis, 59 had 1%–33% necrosis, 27 had 34%–66% necrosis, and nine tumors had >66% necrosis. Five (5%) tumors were cystic. Most tumors had an exophytic component; 46 (45%) had >50% exophytic component, 48 (46%) had <50% exophytic component, and the remaining nine (9%) were completely endophytic. Calcification was noted in 18 (19.8%) tumors; calcification was not considered evaluable in 12 cases. All the imaging studies evaluated in this research project are available online (http://dx.doi.org/10.7937/K9/TCIA.2014.K6M61GDW).
Table 1.
Imaging features and summary statistics of 103 clear cell renal cell carcinomas (ccRCC)
| Imaging feature | Levels and summary statistics | Inter-observer agreement |
|---|---|---|
| Size (cm) | Median: 49 mm First quartile: 35 mm Third quartile: 70 mm |
ICC = 0.983 (0.977, 0.989) |
| Margin | Well-defined: 73 (70.9%) Ill-defined: 30 (29.1%) |
α = 0.300 (0.145, 0.463) |
| Composition | Solid: 98 (95.1%) Cystic: 5 (4.9%) |
α = 0.558 (0.213, 0.818) |
| Necrosis | None: 6 (5.8%) 1%–33%: 57 (55.3%) 34%–67%: 24 (23.3%) > 67%: 7 (6.8%) Missing: 9 (8.7%) |
α = 0.651 (0.511, 0.769) |
| Growth pattern | Endophytic: 9 (8.7%) <50% exophytic: 49 (47.6%) ≥50% exophytic: 45 (43.7%) |
α = 0.640 (0.511, 0.763) |
| Calcification | Present: 18 (17.5%) Absent: 73 (70.9%) Missing: 12 (11.7%) |
α = 0.722 (0.542, 0.865) |
Inter-observer agreement
Inter-observer agreement for tumor size was very high (ICC = 0.983, 95% CI 0.977, 0.989) (Table 1). The inter-observer agreement for margin (α = 0.300; 95% CI 0.145, 0.463) was low as the 95% CI for alpha lay strictly below 0.667. For composition (α = 0.558; 95% CI 0.213, 0.818), necrosis (α = 0.429; 95% CI 0.302, 0.554), calcification (α = 0.722; 95% CI 0.542, 0.865), and growth pattern (α = 0.640; 95% CI 0.511, 0.763) (Table 1) the alpha was low, however, since the CI for alpha included values above 0.667, the degree of agreement remained inconclusive.
Mutational status
Of 103 tumors, 67 (65.0%) had at least one mutation; 30 (2.91%) had more than one mutation; 23 (22.3%) had two concurrent mutations, 6 (5.83%) had three, and 1 (0.97%) had four. VHL (n = 52, 50.5%) and PBRM1 (n = 24, 23.3%) were the most commonly observed mutations (Table 2).
Table 2.
Presence of mutations in 103 patients with ccRCC
| Mutation | Number/percentage of patients |
|---|---|
| VHL | 52 (50.5%) |
| PBRM1 | 24 (23.3%) |
| MUC4 | 9 (8.74%) |
| SETD2 | 9 (8.74%) |
| KDM5C | 6 (5.83%) |
| BAP1 | 5 (4.85%) |
Associations between imaging features and mutational status
Composition was omitted from this part of the analysis since all but five of the cases had solid composition leading to numerical instability arising from the low number of tumors without solid composition. The p values of the association between individual image features and mutational status are given in Table 3. The following associations had p values less than 0.05. An ill-defined margin was associated with BAP1 mutation; four of 30 patients with ill-defined margins and one of 73 patients with well-defined margins had BAP1 mutations (p = 0.001). Presence of calcification was associated with presence of a BAP1 mutation; four of 18 patients with calcification and one of 73 patients without calcification had BAP1 mutations (p < 0.001). An exophytic growth pattern was more often associated with MUC4 mutation; seven of 45 patients with more than 50% exophytic growth patterns had MUC4 mutations, compared with two of 49 patients with less than 50% exophytic growth patterns and none of nine patients with an entirely endophytic pattern (p = 0.031) (Fig. 6, Table 3). However, none of these associations remained significant after adjusting for multiple testing through the Benjamini–Hochberg procedure.
Table 3.
Relationship between imaging features and mutational status in 103 with ccRCC
| Imaging features | Mutations
|
|||||
|---|---|---|---|---|---|---|
| BAP1 | PBRM1 | VHL | SETD2 | KDM5C | MUC4 | |
| Size | ||||||
| Concordance prob. | 0.741 | 0.561 | 0.414 | 0.524 | 0.550 | 0.566 |
| 95% CI | (0.493, 0.941) | (0.468, 0.658) | (0.324, 0.510) | (0.385, 0.662) | (0.453, 0.644) | (0.440, 0.697) |
| p value | 0.071 | 0.368 | 0.133 | 0.820 | 0.688 | 0.517 |
| Margin | ||||||
| Odds ratio | 0.090 | 1.309 | 1.818 | 0.290 | 0.386 | 0.806 |
| 95% CI | (0.000, 0.703) | (0.474, 5.281) | (0.771, 4.800) | (0.034, 1.415) | (0.000, 1280) | (0.164, 2562) |
| p value | 0.001 | 0.795 | 0.122 | 0.053 | 0.174 | 0.722 |
| Composition | ||||||
| Odds ratio | 268.9 | 0.434 | 0.240 | 505.8 | 326.2 | 0.355 |
| 95% CI | (0.053, Inf) | (0.064, 3.73) | (0.010, 1.94) | (0.109, Inf) | (0.066, Inf) | (0.041, 9.67) |
| p value | 1.000 | 0.331 | 0.363 | 1.000 | 1.000 | 0.373 |
| Necrosis | ||||||
| Concordance prob. | 0.523 | 0.414 | 0.408 | 0.396 | 0.414 | 0.352 |
| 95% CI | (0.321, 0.741) | (0.298, 0.524) | (0.313, 0.511) | (0.242, 0.560) | (0.213, 0.617) | (0.187, 0.519) |
| p value | 0.517 | 0.943 | 0.862 | 0.488 | 0.728 | 0.921 |
| Growth pattern | ||||||
| Concordance prob. | 0.604 | 0.465 | 0.447 | 0.475 | 0.557 | 0.697 |
| 95% CI | (0.396, 0.791) | (0.350, 0.580) | (0.353, 0.547) | (0.324, 0.624) | (0.367, 0.737) | (0.559, 0.819) |
| p value | 0.389 | 0.564 | 0.303 | 0.790 | 0.611 | 0.031 |
| Calcification | ||||||
| Odds ratio | 20.55 | 0.331 | 0.737 | 0.657 | 0.000 | 1.179 |
| 95% CI | (2.968, 49449) | (0.000, 1.103) | (0.239, 1.950) | (0.000, 3.524) | (0.000, 0.002) | (0.000, 5.279) |
| p value | <0.001 | 0.217 | 0.432 | 1.000 | 0.34 | 0.688 |
Values in bold and shaded cells indicate statistical significance
Fig. 6.
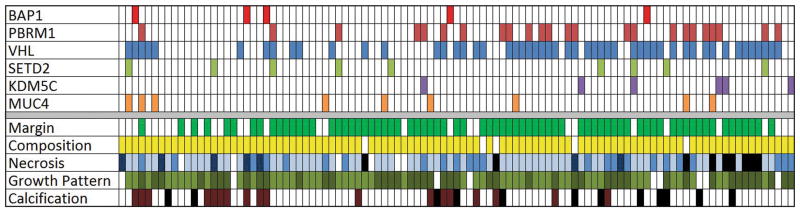
Patient-based color map showing the presence of mutations and imaging features in 103 patients with ccRCC. Margin:
 well-defined,
 ill-defined; Composition:
 solid,
cystic; Necrosis:
0%,
solid,
cystic; Necrosis:
0%,
 1%–33%,
 34%–66%,
 >66%,
>66%,
 not assessed because of cystic tumor; Growth pattern:
endophytic,
not assessed because of cystic tumor; Growth pattern:
endophytic,
 <50% exophytic,
 ≥50% exophytic; Calcification:
absent,
≥50% exophytic; Calcification:
absent,
 present,
indeterminate.
present,
indeterminate.
No imaging characteristics were associated with PBRM1, VHL, SETD2, and KDM5C mutations.
Discussion
This multi-institutional, multi-reader study found associations between imaging features of ccRCC and BAP1 and MUC4 mutations. We found that an ill-defined tumor margin and tumor calcification each were associated with the BAP1 mutation. An ill-defined margin has been associated with locally infiltrative and overall aggressive ccRCC [5, 33, 34]. The BAP1 mutation, found in 15% of ccRCC, is known to be associated with high-grade tumors (Fuhrman grade 3 or 4) and poor survival [5, 13]. Therefore, our findings may provide a genetic explanation as to why an ill-defined margin may be associated with high-grade disease and poor survival in some patients with ccRCC. However, it should be noted that a significant number of poorly marginated tumors did not have BAP1 mutation, which indicates that further data on the associations between the imaging features and mutational status are needed, and also, the ability of individual imaging features to accurately predict the mutational status needs to be studied.
To our knowledge, tumor calcifications have not been associated with high-grade disease or poor survival; their association with the BAP1 mutation needs to be evaluated further. In addition to prognosis, the BAP1 mutation may have therapeutic implications by modestly sensitizing ccRCC to the effects of radiation therapy [5, 16]. There are also data that suggest that the BAP1 mutation may increase the sensitivity of ccRCC to mTORC1 inhibitors [16]. Thus, the identification of an ill-defined tumor margin or tumor calcifications, if ultimately proven to be associated with BAP1 mutation, may help in treatment selection in a subset of patients with ccRCC.
Kapur et al. reported that the BAP1 mutation is more frequently associated with the presence of necrosis on pathology [13]; however, imaging findings of necrosis were not associated with the BAP1 mutation in our study. We compared imaging findings, not pathology, to mutation status. It is possible that tumors thought to be necrotic on imaging were not necrotic at pathology, and those not thought to be necrotic at imaging may have been necrotic at pathology. Also, an association may not have been found due to the small number of tumors with the BAP1 mutation.
We found that an exophytic growth pattern of ccRCC was associated with the MUC4 mutation. Preliminary data obtained from cBio portal suggests that the MUC4 mutation in ccRCC is associated with improved survival [4, 15]. An exophytic growth pattern is known to be a good prognostic feature of RCC [35]. In a study of 123 renal masses, Venkatesh et al. reported that 55% of 49 exophytic tumors were malignant and of the malignant ones, 96% were low grade [35]. The better prognosis of exophytic tumors may be related to the fact that, in general, they are more easily resected due to their lower R.E.N.A.L. nephrometry score [32]. This scoring system takes into account tumor’s radius (“R”), its exophytic (or endophytic) location (“E”), nearness (“N”) to the collecting system, whether the tumor is anterior (“A”) (or posterior), and the tumor’s location (“L”) in relation to the polar line of the kidney [36]. Nevertheless, our study’s finding of an association between an exophytic growth pattern and the MUC4 mutation may explain, in part, why this imaging finding is associated with improved ccRCC survival [4, 15].
There is a paucity of literature correlating imaging findings of ccRCC with mutational status. Karlo et al. [18] found an association between a well-defined tumor margin and the VHL mutation and an association between solid ccRCC and mutations of VHL and PBRM1. However, these findings were not corroborated in our study despite the fact that many of our patients were also evaluated by Karlo et al. The fact that our conclusions differed from Karlo et al. [18] could have been due to several factors. First, we defined some imaging features differently. For example, we considered a tumor margin to be ‘well-defined’ only when more than 90% of the entire tumor circumference was ‘pencil-thin’ sharp. No specific definition was described by Karlo et al. Second, we evaluated some imaging features differently. For example, we assessed the presence of necrosis only in tumors deemed to be solid so as not consider low attenuation cystic regions as necrotic. Karlo et al. assessed for the presence of necrosis in every tumor. Third, we did not evaluate the same imaging features. For example, Karlo et al. evaluated and reported an association of both nodular enhancement and intratumoral vascularity with the VHL mutation, and renal vein invasion with KDM5C and BAP1 mutations. Nodular enhancement, intratumoral vascularity, and renal vein invasion were not evaluated in our study because our readers could not reach a consensus on their definition. Fourth, the data in our study were evaluated by multiple readers from multiple institutions. The Karlo et al. study was derived from a single institution. The inter-observer agreement was low for most features in our study, whereas the study by Karlo et al. reported substantial to excellent interobserver agreement [18]. Indeed, readers from a single institution are more likely to interpret images similarly than readers from different institutions. However, the results of a multi-institutional study such as ours may be easier to generalize. To compensate for inter-observer variability in our study, the three readers were asked to interpret the imaging findings independently; the majority read for each imaging finding then was used for each case. Overall, the fact that our results differed from those of Karlo et al. highlight the difficulties in conducting studies of this kind, and prompt the need for a consistent, standard approach to imaging feature analyses.
This study had several limitations. This was a retrospective study; however, the readers were blinded to each patient’s mutational status in order to minimize any bias. The purpose of this study was a preliminary assessment of associations between individual image features and presence of each mutation; no assessments of the sensitivity and specificity of the image features in detecting any of these mutations were performed. Although using these image features to detect mutations would be a more clinically relevant question, our objective here was to first examine whether the data provided any indication that imaging would have any predictive signal. Although none of the associations were significant after adjusting for multiple testing, perhaps because of small number of patients with each mutation, the results indicate that these image features, in combination with one another, may be able to predict mutation status. We plan to validate our findings and calculate the predictive value of each imaging finding in a separate, future cohort.
We did not construct multivariate models of mutation status because of relatively small number of patients with each mutation. Similarly, the potential effect of the presence of multiple simultaneous mutations on the imaging appearance of the tumors or of the multiple imaging findings on one mutation both could not be evaluated for the same reason. The imaging examinations were performed at multiple academic institutions using different scanners and variable technical parameters; the technical details were not available in every patient. However, all the patients were examined with protocols that included the requisites for renal mass imaging including a maximum section thickness of 5 mm. Although the study included both CT scans and MRI examinations, the correlation of findings (such as percentage of necrosis and tumor margin) between CT and MRI was not investigated. This can be conducted along with in-depth radiology–pathology correlation in a separate future study. Finally, although the mutational status of each tumor was derived from surgical samples, intratumoral genetic heterogeneity, a known phenomenon in ccRCC [3], may not have been fully accounted [37].
Despite these limitations, this multi-institutional, multi-reader study showed an association between imaging features and mutational status of ccRCC. Ill-defined margins and tumoral calcifications each were associated with the BAP1 mutation, which in clinical studies is associated with high-grade tumors and poor survival. An exophytic growth pattern was associated with theMUC4 mutation, which is associated with better survival. These results indicate that imaging has potential as a non-invasive means of ascertaining mutation status, a research question that we hope to investigate in future studies. These findings add to the growing data that support the potential for using radiogenomics to predict the genomic make-up of ccRCC. Ultimately, when greater evidence accumulates, these data also may help predict clinical outcome and response to treatment. However, radiogenomics research will need to keep pace with the discovery of new mutations and their therapeutic implications. Our study also highlighted the challenges in achieving good interobserver agreement from a diverse group of experienced, sub-specialty-trained radiologists. Although these data may help develop further the field of radiogenomics and our ability to use imaging as a noninvasive biomarker to predict mutational status of ccRCC, the fact that our findings differ from the only other analysis of this kind points to the complexity of the problems of multi-reader image analysis, genetic mapping, and the heterogeneity of ccRCC.
Acknowledgments
Image data used in this research were obtained from The Cancer Imaging Archive (http://cancerimagingarchive.net/) sponsored by the Cancer Imaging Program, Division of Cancer Treatment and Diagnosis (DCTD)/National Cancer Institute (NCI)/National Institutes of Health (NIH). This project has been funded in whole or in part with federal funds from the National Cancer Institute, National Institutes of Health, under Contract No. HHSN261200800001E. The content of this publication does not necessarily reflect the views or policies of the Department of Health and Human Services, nor does mention of trade names, commercial products, or organizations imply endorsement by the U.S. Government. We thank Alessandro Furlan, MD for participating as a study reader. We thank Ms. Brenda Fevrier-Sullivan from NCI for administrative support.
References
- 1.Siegel RL, Miller KD, Jemal A. Cancer statistics, 2015. CA Cancer J Clin. 2015;65(1):5–29. doi: 10.3322/caac.21254. [DOI] [PubMed] [Google Scholar]
- 2.Lam JS, Shvarts O, Leppert JT, Figlin RA, Belldegrun AS. Renal cell carcinoma 2005: new frontiers in staging, prognostication and targeted molecular therapy. J Urol. 2005;173(6):1853–1862. doi: 10.1097/01.ju.0000165693.68449.c3. [DOI] [PubMed] [Google Scholar]
- 3.Gerlinger M, Rowan AJ, Horswell S, et al. Intratumor heterogeneity and branched evolution revealed by multiregion sequencing. N Engl J Med. 2012;366(10):883–892. doi: 10.1056/NEJMoa1113205. [DOI] [PMC free article] [PubMed] [Google Scholar]
- 4.Cancer Genome Atlas Research Network. Comprehensive molecular characterization of clear cell renal cell carcinoma. Nature. 2013;499(7456):43–49. doi: 10.1038/nature12222. [DOI] [PMC free article] [PubMed] [Google Scholar]
- 5.Peña-Llopis S, Vega-Rubín-de-Celis S, Liao A, et al. BAP1 loss defines a new class of renal cell carcinoma. Nat Genet. 2012;44(7):751–759. doi: 10.1038/ng.2323. [DOI] [PMC free article] [PubMed] [Google Scholar]
- 6.Dalgliesh GL, Furge K, Greenman C, et al. Systematic sequencing of renal carcinoma reveals inactivation of histone modifying genes. Nature. 2010;463(7279):360–363. doi: 10.1038/nature08672. [DOI] [PMC free article] [PubMed] [Google Scholar]
- 7.Varela I, Tarpey P, Raine K, et al. Exome sequencing identifies frequent mutation of the SWI/SNF complex gene PBRM1 in renal carcinoma. Nature. 2011;469(7331):539–542. doi: 10.1038/nature09639. [DOI] [PMC free article] [PubMed] [Google Scholar]
- 8.Guo G, Gui Y, Gao S, et al. Frequent mutations of genes encoding ubiquitin-mediated proteolysis pathway components in clear cell renal cell carcinoma. Nat Genet. 2012;44(1):17–19. doi: 10.1038/ng.1014. [DOI] [PubMed] [Google Scholar]
- 9.Duns G, van den Berg E, van Duivenbode I, et al. Histone methyltransferase gene SETD2 is a novel tumor suppressor gene in clear cell renal cell carcinoma. Cancer Res. 2010;70(11):4287–4291. doi: 10.1158/0008-5472.CAN-10-0120. [DOI] [PubMed] [Google Scholar]
- 10.Shinagare AB, Giardino AA, Jagannathan JP, Van den Abbeele AD, Ramaiya NH. Hereditary cancer syndromes: a radiologist’s perspective. Am J Roentgenol. 2011;197(6):W1001–W1007. doi: 10.2214/AJR.11.6465. [DOI] [PubMed] [Google Scholar]
- 11.Kim WY, Kaelin WG. Role of VHL gene mutation in human cancer. J Clin Oncol. 2004;22(24):4991–5004. doi: 10.1200/JCO.2004.05.061. [DOI] [PubMed] [Google Scholar]
- 12.Shuin T, Kondo K, Torigoe S, et al. Frequent somatic mutations and loss of heterozygosity of the von Hippel-Lindau tumor suppressor gene in primary human renal cell carcinomas. Cancer Res. 1994;54(11):2852–2855. [PubMed] [Google Scholar]
- 13.Kapur P, Peña-Llopis S, Christie A, et al. Effects on survival of BAP1 and PBRM1 mutations in sporadic clear-cell renal-cell carcinoma: a retrospective analysis with independent validation. Lancet Oncol. 2013;14(2):159–167. doi: 10.1016/S1470-2045(12)70584-3. [DOI] [PMC free article] [PubMed] [Google Scholar]
- 14.Hakimi AA, Chen Y-B, Wren J, et al. Clinical and pathologic impact of select chromatin-modulating tumor suppressors in clear cell renal cell carcinoma. Eur Urol. 2013;63(5):848–854. doi: 10.1016/j.eururo.2012.09.005. [DOI] [PMC free article] [PubMed] [Google Scholar]
- 15. [Accessed 22 Jul 2014];cBioPortal for Cancer Genomics: Results [Internet] http://www.cbioportal.org/public-portal/index.do?cancer_study_id=kirc_tcga_pub&genetic_profile_ids_PROFILE_MUTATION_EXTENDED=kirc_tcga_pub_mutations&genetic_profile_ids_PROFILE_COPY_NUMBER_ALTERATION=kirc_tcga_pub_gistic&Z_SCORE_THRESHOLD=2.0&RPPA_SCORE_THRESHOLD=2.0&data_priority=0&case_set_id=kirc_tcga_pub_cnaseq&case_ids=&gene_set_choice=user-defined-list&gene_list=MUC4&clinical_param_selection=null&tab_index=tab_visualize&Action=Submit.
- 16.Brugarolas J. Molecular genetics of clear-cell renal cell carcinoma. J Clin Oncol. 2014;32(18):1968–1976. doi: 10.1200/JCO.2012.45.2003. [DOI] [PMC free article] [PubMed] [Google Scholar]
- 17.Kuo MD, Jamshidi N. Behind the numbers: decoding molecular phenotypes with radiogenomics—guiding principles and technical considerations. Radiology. 2014;270(2):320–325. doi: 10.1148/radiol.13132195. [DOI] [PubMed] [Google Scholar]
- 18.Karlo CA, Di Paolo PL, Chaim J, et al. Radiogenomics of clear cell renal cell carcinoma: associations between CT imaging features and mutations. Radiology. 2014;270(2):464–471. doi: 10.1148/radiol.13130663. [DOI] [PMC free article] [PubMed] [Google Scholar]
- 19. [Accessed 23 Sep 2014];CIP TCGA Radiology Initiative—The Cancer Imaging Archive (TCIA) Public Access—Cancer Imaging Archive Wiki [Internet] https://wiki.cancerimagingarchive.net/display/Public/CIP+TCGA+Radiology+Initiative;jsessionid=92ACC1CC632A2219F9A6F965E2325B68.
- 20. [Accessed 18 Sep 2014];Software Tools: Department of Radiology: Feinberg School of Medicine: Northwestern University [Internet] http://www.radiology.northwestern.edu/research/areas-of-research/Imaging-Informatics-home/Software%20Tools.html.
- 21.Mongkolwat P, Kleper V, Talbot S, Rubin D. The National Cancer Informatics Program (NCIP) Annotation and Image Markup (AIM) Foundation Model. J Digit Imaging. 2014;27:692–701. doi: 10.1007/s10278-014-9710-3. [DOI] [PMC free article] [PubMed] [Google Scholar]
- 22.Mongkolwat P, Channin DS, Kleper V, Rubin DL. Informatics in radiology: an open-source and open-access cancer biomedical informatics grid annotation and image markup template builder. Radiographics. 2012;32(4):1223–1232. doi: 10.1148/rg.324115080. [DOI] [PMC free article] [PubMed] [Google Scholar]
- 23.McGraw KO, Wong SP. Forming inferences about some intraclass correlation coefficients. Psychol Methods. 1996;1(1):30–46. [Google Scholar]
- 24.Swiger LA, Harvey WR, Everson DO, Gregory KE. The variance of intraclass correlation involving groups with one observation. Biometrics. 1964;20:818–826. [Google Scholar]
- 25.Krippendorff K. Estimating the reliability, systematic error, and random error of interval data. Educ Psychol Meas. 1970;30:61–70. [Google Scholar]
- 26.Krippendorff K. Content analysis: an introduction to its methodology. 2. Sage; Thousand Oaks: 2004. [Google Scholar]
- 27.Efron B, Tibshirani RJ. An Introduction to the Bootstrap. Boca Raton: Chapman and Hall/CRC; 1998. [Google Scholar]
- 28.Efron B, Tibshirani RJ. An Introduction to the Bootstrap. London: Chapman and Hall; 1993. [Google Scholar]
- 29.Hanley JA, McNeil BJ. The meaning and use of the area under a receiver operating characteristic (ROC) curve. Radiology. 1982;143(1):29–36. doi: 10.1148/radiology.143.1.7063747. [DOI] [PubMed] [Google Scholar]
- 30.Bickel PJ, Freedman DA. Asymptotic normality and the Bootstrap in stratified sampling. Ann Statist. 1984;12(2):470–482. [Google Scholar]
- 31.Benjamini Y, Hochberg Y. Controlling the false discovery rate: a practical and powerful approach to multiple testing. J R Stat Soc B. 1995;57(1):289–300. [Google Scholar]
- 32.R Project for Statistical Computing. [Accessed 23 Sep 2014];R (Version 3.1.1, 2014) http://www.r-project.org/
- 33.Fukatsu A, Tsuzuki T, Sassa N, et al. Growth pattern, an important pathologic prognostic parameter for clear cell renal cell carcinoma. Am J Clin Pathol. 2013;140(4):500–505. doi: 10.1309/AJCPIMPE6ZFT8AME. [DOI] [PubMed] [Google Scholar]
- 34.Ro JY, Ayala AG, Sella A, Samuels ML, Swanson DA. Sarcomatoid renal cell carcinoma: clinicopathologic. A study of 42 cases. Cancer. 1987;59(3):516–526. doi: 10.1002/1097-0142(19870201)59:3<516::aid-cncr2820590327>3.0.co;2-w. [DOI] [PubMed] [Google Scholar]
- 35.Venkatesh R, Weld K, Ames CD, et al. Laparoscopic partial nephrectomy for renal masses: effect of tumor location. Urology. 2006;67(6):1169–1174. doi: 10.1016/j.urology.2006.01.089. (discussion 1174) [DOI] [PubMed] [Google Scholar]
- 36.Kutikov A, Uzzo RG. The R.E.N.A.L. nephrometry score: a comprehensive standardized system for quantitating renal tumor size, location and depth. J Urol. 2009;182(3):844–853. doi: 10.1016/j.juro.2009.05.035. [DOI] [PubMed] [Google Scholar]
- 37.Sankin A, Hakimi AA, Mikkilineni N, et al. The impact of genetic heterogeneity on biomarker development in kidney cancer assessed by multiregional sampling. Cancer Med. 2014;3:1485–1492. doi: 10.1002/cam4.293. [DOI] [PMC free article] [PubMed] [Google Scholar]