

Abstract
The ototoxic aminoglycoside antibiotics are essential to treat severe bacterial infections, particularly in neonatal intensive care units. Using a bacterial lipopolysaccharide (LPS) experimental model of sepsis, we tested whether LPS-mediated inflammation potentiates cochlear uptake of aminoglycosides and permanent hearing loss in mice. Using confocal microscopy and enzyme-linked immunosorbent assays, we found that low-dose LPS (endotoxemia) greatly increased cochlear concentrations of aminoglycosides and resulted in vasodilation of cochlear capillaries without inducing paracellular flux across the blood-labyrinth barrier (BLB), or elevating serum concentrations of the drug. Additionally, endotoxemia increased expression of both serum and cochlear inflammatory markers. These LPS-induced changes, classically mediated by Toll-like Receptor 4 (TLR4), were attenuated in TLR4-hyporesponsive mice. Multiday dosing with aminoglycosides during chronic endotoxemia induced greater hearing threshold shifts and sensory cell loss compared to mice without endotoxemia. Thus, endotoxemia-mediated inflammation enhanced aminoglycoside trafficking across the BLB, and potentiated aminoglycoside-induced ototoxicity. These data indicate that patients with severe infections are at greater risk of aminoglycoside-induced hearing loss than previously recognized.
Introduction
Severe Gram-negative bacterial infections, including meningitis, bacteremia and respiratory infections in cystic fibrosis, are treated with aminoglycoside antibiotics like gentamicin (1–3). These drugs can induce permanent and debilitating hearing loss, particularly in neonates. Approximately 80% of 600,000 admissions into neonatal intensive care units (NICU) in the United States receive aminoglycosides each year (4). The rate of hearing loss in NICU graduates (from all etiologies) is 2–4% compared to 0.1–0.3% of full-term births from congenital etiologies (5). Aminoglycoside-induced ototoxicity could contribute substantially to this increased rate of hearing loss in the NICU population. The irreversibility of hearing loss, particularly in pediatric cases prior to language development, has extensive quality-of-life implications (6–9).
The mechanisms by which circulating aminoglycosides cross the blood-labyrinth barrier (BLB) into the cochlea remain unconfirmed. We previously reported that, in vivo, these drugs predominantly cross the BLB into the stria vascularis and are trafficked via marginal cells into endolymph (10). Once in endolymph, these drugs rapidly enter cochlear hair cells via mechanoelectrical transduction (MET) channels located on their apical membranes and induce hair cell death (10–13).
Serious infections induce Systemic Inflammatory Response Syndrome (SIRS), elevating serum concentrations of nitric oxide, vasoactive peptides and inflammatory proteins that can modulate the vascular permeability of the blood-brain barrier (BBB) (14–16). Vasoactive peptides also modulate cochlear uptake of gentamicin across the BLB (17). However, most studies of ototoxicity involve healthy preclinical models, and the effect of induced systemic inflammation on ototoxicity has only recently been reported (18). Here, we used bacterial lipopolysaccharide (LPS) to induce endotoxemia in a classic experimental model of sepsis and inflammation (19) in mice to test the hypothesis that systemic inflammation modulates cochlear concentrations of aminoglycosides and inflammatory markers, and exacerbates aminoglycoside-induced ototoxicity.
Results
Fluorescently-tagged gentamicin (GTTR) is an excellent tracer of gentamicin in vivo (10, 13, 17, 20–23). By conjugating Texas Red to gentamicin (450–477 daltons, 3 isoforms), the hydrophobicity of the resulting conjugate (1151–1179 daltons) is increased while serum pharmacokinetics are slowed, providing greater spatiotemporal imaging and a higher signal-to-noise ratio in heterogeneous cellular structures like the cochlea compared to radiolabeled aminoglycosides or immunohistochemistry (10, 13, 24–26). The cytoplasmic intensity of GTTR fluorescence is dose-dependent, unlike gentamicin immunofluorescence where the greater abundance of epitope binding sites can overwhelm the number of available antibodies (13, 20). Thus, changes in cochlear uptake of aminoglycosides can be quantitatively assayed using GTTR and confocal microscopy (13, 17, 20, 23).
Strial uptake of GTTR is enhanced by LPS-induced endotoxemia
In Dulbecco’s phosphate buffered saline-treated (DPBS-treated) mice that received an intraperitoneal (i.p.) injection of GTTR 1 hour before fixation, intense fluorescence delineated the strial capillaries of the cochlear lateral wall, with moderate diffuse fluorescence distributed throughout the stria vascularis (marginal cells, intra-strial tissues, and basal cells; Fig. 1A, B), as previously described (13). The spiral ligament fibrocytes exhibited reduced intensities of GTTR fluorescence compared to strial cells (Fig. 1A, B and fig. S1A), also as seen previously (13).
Fig. 1. Cochlear lateral wall uptake of GTTR is enhanced by LPS.

(A) In xz planes of the cochlear lateral wall 1 hour after GTTR injection, F-actin labeling (green,) revealed tight junctions (arrowheads) between marginal cells (MC), with amorphous labeling in basal cells (BC, arrows). In DPBS-treated mice, intense GTTR fluorescence (red) distinguished strial capillaries (c), with less intense fluorescence in marginal cells, intra-strial layer (IS), and basal cells of the stria vascularis. The spiral ligament (SL) fibrocytes presented substantially less intense GTTR fluorescence compared to strial cells. LPS-treated mice displayed more intense GTTR fluorescence in the lateral wall (right panel) compared to DPBS-treated mice (left panel). (B) A focal series of xy planes through marginal cells, intra-strial tissues, basal cells, and fibrocytes at successively lower xy planes in the z-axis, 1 hour after GTTR injection. LPS-treated mice exhibited more intense GTTR fluorescence in grayscale (right panels) compared to DPBS-treated mice (left panels). Scale bar, 50 μm. (C) Mean pixel intensities of GTTR fluorescence in lateral wall ROIs (excluding capillary structures) are dose-dependently increased with increasing doses of LPS at 1 and 3 hours after GTTR injection (relative to DPBS-treated mice at 1 hour), with statistical significance in every cell type at 1 hour at 1 mg/kg or higher dose of LPS (Wilcoxon signed-rank test; *P<0.05; **P<0.01; ***P<0.001; error bars=s.e.m.; N as in Table S1).
Mice intravenously (i.v.) injected with 1 mg/kg LPS 24 hours prior to an i.p. injection of GTTR 1 hour before fixation had more intense GTTR fluorescence in all regions of the cochlear lateral wall compared to DPBS-treated mice (Fig. 1A, B). DPBS-treated or LPS-treated mice injected with hydrolyzed Texas Red (hTR) 1 hour prior to fixation displayed negligible fluorescence within the lateral wall, as previously described (13, 22).
The mean pixel intensity of GTTR fluorescence was obtained from xy optical sections and plotted for specific regions of interest [ROIs; marginal cells, intra-strial tissues (minus capillary structures), basal cells and spiral ligament fibrocytes] at 1 and 3 hours after GTTR injection (Fig. 1C, and fig. S1). In DPBS-treated mice, absolute fluorescence was greatest in marginal cells, with stepwise decreasing fluorescence in intra-strial and basal cells, with a significant drop in spiral ligament fibrocytes (fig. S1A, P<0.05). Strial and spiral ligament fluorescence was significantly greater in basal segments compared to apical segments for each ROI (fig. S1A, P<0.01).
GTTR fluorescence was dose-dependently elevated in selected cell types with increasing LPS dose (Fig. 1C, fig. S1B). At 1 hour, significant increases in GTTR fluorescence were observed in every ROI of basal lateral wall segments dosed with 1 mg/kg or higher LPS (Fig. 1C and fig. S1B, P<0.01 or P<0.005). A similar pattern of increased uptake was observed in the apical coil, but with more variable significance (fig. S1B, P>0, P<0.05, P<0.01, or P<0.005). At 3 hours, GTTR fluorescence in lateral wall cells continued to show dose-dependent elevations with increasing LPS dose, reaching significance at 2.5 and 10 mg/kg LPS (Fig. 1C, and fig. S1B; P<0.05, or P<0.01). The rank order of GTTR fluorescence intensity in individual cell types (marginal cells>intra-strial layer>basal cells≫spiral ligament) was generally maintained with increasing LPS dose, with more variable degrees of significance with increasing LPS dose and time (fig. S1A). Strial GTTR fluorescence was significantly greater for each ROI in basal segments compared to apical segments in DPBS-treated or LPS-treated mice (fig. S1A, P<0.01). These data indicate that LPS dose-dependently increased GTTR trafficking across the BLB, particularly in the basal coil of the cochlea, the region most associated with the onset of drug-induced hearing loss and sensory cell death (27, 28).
In cochlear outer hair cells (OHCs), LPS-induced increases in GTTR fluorescence were consistently observed at 1 hour after GTTR injection compared to DPBS-treated mice, particularly at higher LPS doses (>1 mg/kg LPS), and trended towards significance at higher doses of LPS (≥2.5 mg/kg) at 3 hours post-GTTR injection (fig. S2A,B). In apical coils, LPS did not consistently modulate GTTR fluorescence in OHCs 1 hour after GTTR injection, and trended towards significance at 3 hours with higher doses of LPS (≥1 mg/kg). These data suggest that LPS accelerated GTTR entry into basal OHCs, and that dynamic increases in GTTR uptake kinetics at later time points, or by apical OHCs, were dissipated by the low doses of GTTR used here.
Renal function is impaired at higher doses of LPS
Endotoxemia and sepsis affect vascular function in multiple organ systems, and can induce decreased glomerular filtration rates and renal dysfunction (29). Since GTTR is readily taken up by renal proximal tubules (21, 23), decreased glomerular filtration rates and renal dysfunction should reduce proximal tubule uptake of GTTR. As an internal control, we assessed renal GTTR fluorescence intensities during endotoxemia. In DPBS-treated mice, 1 or 3 hours after GTTR injection, GTTR fluorescence was localized as intense puncta close to the lumen, and as diffuse fluorescence in the cytoplasm of proximal tubule cells, while distal tubule cells had visibly less diffuse fluorescence and no puncta (fig. S3A), as seen previously (21). In LPS-treated mice, diffuse GTTR fluorescence within proximal tubule cells at 1 hour was significantly reduced only at 10 mg/kg LPS compared to DPBS-treated control tissues (fig. S3C; P<0.001). At 3 hours, cytoplasmic fluorescence in proximal tubule cells of DPBS-treated mice was markedly increased compared to that at 1 hour (fig. S3C) due to longer exposure. However, at 3 hours, only mice treated with 10 mg/kg LPS had significantly less cytoplasmic GTTR fluorescence compared to DPBS-treated mice (fig. S3; P<0.05), as expected during endotoxemic shock (29).
Low dose LPS increases cochlear but not serum concentrations of aminoglycosides
Given that 10 mg/kg LPS can decrease both glomerular filtration rates (29) and renal uptake of GTTR (fig. S3), we assessed serum concentrations of GTTR 24 hours after LPS administration using immunoturbidimetry. Serum concentrations of GTTR were significantly higher in mice dosed with 2.5 and 10 mg/kg LPS than in DPBS-treated mice at 1 or 3 hours after GTTR injection (Fig. 2A; Tables S1 and S2, P<0.01 and P<0.05, respectively). Serum concentrations of GTTR in mice dosed with 0.1 and 1 mg/kg LPS were not statistically different from controls at 1 or 3 hours of GTTR exposure (Fig. 2A; Table S2). Serum concentrations of GTTR in mice dosed with 2.5 mg/kg LPS were significantly higher than in 0.1 and 1 mg/kg LPS-treated mice at both 1 and 3 hour time points (Fig. 2A; Table S2, P<0.05 and P<0.01, respectively). To verify that serum concentrations for unconjugated gentamicin were not altered by exposure to 1 mg/kg LPS for 24 hours, we used enzyme-linked immunosorbent assays (ELISA). Both GTTR and gentamicin serum concentrations were unchanged in LPS-treated mice compared to DPBS-treated mice at 1 and 3 hour time points after drug injection (Fig. 2B, D). Serum gentamicin was lower at 3 hours after injection, while GTTR has a longer serum half-life, as described previously (13). In contrast, cochlear concentrations of both GTTR and gentamicin were significantly increased in LPS-treated mice compared to DPBS-treated mice at both 1 and 3 hours after injection (Fig. 2C, E, P<0.05).
Fig. 2. Low dose LPS does not alter serum concentrations but does alter cochlear concentrations of aminoglycosides.

(A) Using immunoturbidimetry, GTTR serum concentrations were significantly higher in 2.5 and 10 mg/kg LPS-treated mice than in controls at 1 or 3 hours. There was no difference between DPBS-treated mice and those dosed with 0.1 and 1 mg/kg LPS, nor between mice dosed with 2.5 and 10 mg/kg LPS. Serum concentrations of GTTR in 2.5 mg/kg LPS-treated mice were significantly higher than in 0.1 and 1 mg/kg LPS-treated mice at both time points (P<0.05). Elevated serum GTTR concentrations in 10 mg/kg LPS-treated mice showed borderline significance at 1 hour compared to 0.1 and 1 mg/kg LPS-treated mice (P=0.087, 0.053, respectively), and variable significance at 3 hours (P=0.27, 0.028, respectively; see also Table S2; Mann-Whitney U test; *P<0.05; **P<0.01; ***P<0.005; N in Table S1). (B, D) Using ELISA, serum concentrations of GTTR or gentamicin were not statistically different between DPBS-treated or 1 mg/kg LPS-treated mice at 1 or 3 hours after injection. (C, E) Cochlear concentrations of GTTR or gentamicin (GT) were significantly increased in 1 mg/kg LPS-treated mice compared to controls at 1 or 3 hours after injection (*P<0.05; N=4/group; Student’s unpaired t-test). Error bars=s.e.m; au, arbitrary units.
Six mice at higher LPS doses died within 24 hours after LPS injection (Table S1), as predicted (30). However, 1 mg/kg LPS was not fatal, as expected (30), yet induced acute weight loss (fig. S4A) associated with endotoxemia and sepsis (31). Given that 1 mg/kg LPS did not increase serum concentrations, yet elevated cochlear concentrations, of GTTR and gentamicin, we used 1 mg/kg LPS for subsequent experiments.
Low dose LPS does not increase paracellular flux across the BLB
Endotoxemia can change the volume of distribution for drugs, including gentamicin (32). Hydrolyzed Texas Red (hTR; a.k.a. sulforhodamine 101; molecular mass: 679) is a membrane-impermeant fluorophore (33, 34). We used hTR to test whether exposure to LPS for 24 hours enhanced paracellular flux across the BLB into the interstitial spaces of the stria vascularis and spiral ligament (35), using neonatal (P6) mice with an immature BLB as a positive control (21, 36). In P6 mice treated with the hTR for 1 hour, fluorescence was distributed throughout strial tissues, with weaker intensities in strial marginal and basal cells (Fig. 3A, fig S5A). The spiral ligament of P6 mice exhibited less fluorescence compared to strial tissues (fig. S5A, P<0.01). In adult DPBS-treated and LPS-treated mice exposed to hTR for 1 hour, significantly less fluorescence was observed in strial cells and spiral ligament fibrocytes compared to P6 mice (Fig. 3A, fig. S5A, P<0.05 or P<0.005). No statistical differences in hTR fluorescence could be observed between DPBS-treated and LPS-treated adult mice for any ROI (Fig. 3A; fig. S5A).
Fig. 3. LPS does not alter BLB permeability but vasodilates basal strial capillaries.
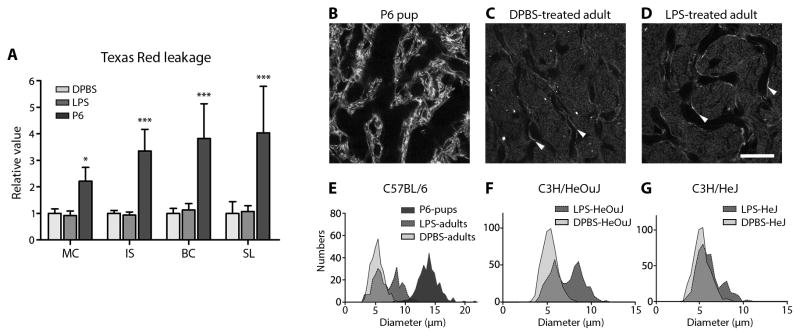
(A) The relative mean intensities of hTR fluorescence in marginal cell (MC), intra-strial tissue (IS), basal cell (BC) and spiral ligament (SL) layers from P6 pups were significantly elevated compared to the same ROIs in adult mice. There was no difference in hTR fluorescence of lateral wall ROIs between DPBS-treated and LPS-treated adult mice (*P<0.05, ***P<0.001; N=6 cochleae/group; error bars=s.d.; 2-way ANOVA with Bonferroni post-hoc tests). Absolute fluorescent intensities are shown in fig. S5A. (B, C) In P6 mice, the lumen of strial capillaries, revealed by phalloidin labeling, was larger than in adult DPBS-treated mice (endothelial cells indicated by white arrowheads). (D) Twenty-five hours after LPS treatment, a subpopulation of strial capillaries were dilated compared to DPBS-treated mice (C). Scale bar, 20 μm. (E) Strial capillary diameters in P6 mice were wider than in DPBS-treated adults (see also Table 1). LPS-treated adult mice had a subset of dilated strial capillaries, resulting in a bimodal distribution. (F) LPS also dilated a subset of strial capillaries in C3H/HeOuJ mice compared to DPBS-treated C3H/HeOuJ mice. (G) In TLR4-hyporesponsive C3H/HeJ mice, LPS dilated fewer strial capillaries compared to LPS-treated control C3H/HeOuJ mice (F), resulting in an asymmetrical bimodal distribution. A Gaussian regression curve fit was applied to obtain the bimodal peak means in Table 1.
Morphometry of cochlear lateral wall tissues revealed that the diameters of strial capillaries in P6 pups were visibly and significantly larger than in DPBS-treated adult mice (Fig. 3B, C, E; Table 1, P<0.0001). LPS treatment significantly vasodilated a subset of both apical and basal strial capillaries in adult mice compared to DPBS-treated mice (Fig. 3D, E, fig. S5C; Table 1, P<0.0001), resulting in a bimodal distribution of capillary diameters indicative of acute inflammation. Intriguingly, fixed strial capillary diameters may underestimate actual physiological diameters (37).
Table 1.
Vasodilation of strial capillaries by LPS.
| Mouse | LPS | Mean diameter (±s.d.) in μm | Mean bimodal diameter (±s.d.) in μm [% of N] | N (number of mice) | Significance (vs in-strain DPBS-treated mice) |
|---|---|---|---|---|---|
| Basal coils C57BL/6 P6 pups | − | 13.8 (±1.5) | 300 (3) | *** | |
| C57BL/6 adults | − | 5.1 (±1.0) | 300 (3) | ||
| C57BL/6 adults | + | 5.3 (±0.9) | 8.6 (±1.1) [45.3%] | 300 (3) | *** |
| C3H/HeOuJ adults | − | 5.3 (±0.8) | 480 (4) | ||
| C3H/HeOuJ adults | + | 5.7 (±0.8) | 8.6 (±0.9) [49.7%] | 480 (4) | *** |
| C3H/HeJ adults | − | 5.3 (±0.9) | 480 (4) | ||
| C3H/HeJ adults | + | 5.4 (±0.8) | 8.1 (±0.9) [22.1%] | 480 (4) | *** |
| Apical coils C57BL/6 adults | − | 5.0 (±0.7) | 480 (4) | ||
| C57BL/6 adults | + | 5.6 (±0.6) | 8.1 (±1.0) [59.8%] | 480 (4) | *** |
In basal coils, strial capillary diameters in P6 pups were significantly larger than in DPBS-treated C57BL/6 adult mice. LPS dilated a subset (45%) of strial capillaries in adult mice. The population of capillary diameters in LPS-treated C57BL/6 mice was significantly greater compared to DPBS-treated C57BL/6 mice (P<0.0001). LPS also dilated a subset (50%) of strial capillaries in C3H/HeOuJ mice. In TLR4-hyporesponsive C3H/HeJ mice, LPS dilated a smaller subset (22%) of strial capillaries. The population of capillary diameters in LPS-treated C3H/HeJ mice was significantly greater compared to DPBS-treated C3H/HeJ mice (P<0.0001). The population of capillary diameters in LPS-treated C3H/HeJ mice was significantly smaller compared to LPS-treated C3H/HeOuJ mice (P<0.0001; 1-way ANOVA with Tukey post-hoc tests). In apical coils, LPS dilated a subset (45%) of strial capillaries in C57BL/6 mice. The population of apical strial capillary diameters in LPS-treated C57BL/6 mice was significantly greater compared to DPBS-treated C57BL/6 adult mice (P<0.0001). A Gaussian regression curve fit was applied to obtain the peak means of the bimodal distributions in Fig. 3.
These data indicate that the BLB was relatively impermeable to hTR in adult mice compared to the immature and more permeable BLB of neonatal pups, as has been found for another fluorophore, FM1-43 (38, 39). Furthermore, the paucity of hTR flux across the BLB of adult mice was not altered by LPS treatment, suggesting that the physical integrity of the adult BLB was retained despite LPS-induced vasodilation of strial capillaries.
Low dose LPS induces robust pro-inflammatory marker expression
We previously reported that two inflammatory-mediated vasoactive peptides – histamine and serotonin – can modulate cochlear uptake of GTTR (17). Twenty-four hours after LPS injection, serum histamine concentrations were not modulated, while serum serotonin concentrations were significantly decreased in a dose-dependent manner in LPS-treated mice (Table 2, fig. S6, P<0.05 or P<0.001). This suggested that the loss of vasoconstrictive serotonin is associated with strial vasodilation and potentially increased strial vascular permeability to aminoglycosides.
Table 2.
Effect of LPS on serum concentrations of histamine and serotonin.
| LPS dose (mg/kg) | Histamine (ng/ml ±s.e.m.) | Serotonin (ng/ml ±s.e.m.) |
|---|---|---|
|
| ||
| 0 | 33 (±2) | 2770 (±100) |
| 0.1 | 25 (±3) | 2135 (±285) * |
| 1.0 | 24 (±4) | 579 (±157) ** |
| 2.5 | 28 (±3) | 830 (±246) ** |
| 10 | 36 (±6) | 837 (±329) ** |
Serum histamine concentrations were not affected by increasing doses of LPS. Serum serotonin concentrations were significantly decreased at all LPS doses compared to DPBS-treated mice
P<0.05,
P<0.001;
Mann-Whitney U test; N in Table S1 at 3 hours after GTTR injection.
LPS binds to and activates Toll-like Receptor 4 (TLR4) to induce the secretion and transcription of acute phase inflammatory cytokines and chemokines that orchestrate immune responses (40, 41). Given that LPS enhanced cochlear uptake of aminoglycosides, we assessed whether LPS modulated serum and cochlear expression of acute phase inflammatory markers. Six hours after injection, LPS significantly elevated serum concentrations of all acute phase pro-inflammatory proteins tested: TNFα, IL-1α, IL-1β, IL-6, IL-8 (a.k.a. KC, CXCL1), MIP-1α and MIP-2α (Fig. 4A). In cochlear homogenates, LPS significantly elevated protein concentrations of all early phase pro-inflammatory markers, particularly IL-6 and IL-8, but not IL-1β (Fig. 4B). Interestingly, LPS significantly elevated the anti-inflammatory cytokine IL-10 in serum, but not in vascular-perfused cochlear homogenates (Fig. 4A, P<0.05, and 4B, respectively). Exposure to gentamicin for 3 hours did not modulate serum or cochlear inflammatory protein concentrations (Fig. 4A, B), indicating that gentamicin (at the doses used here) was not a confounding factor. Overall, LPS-induced changes in the serum concentrations of acute phase pro-inflammatory proteins were reflected in cochlear homogenates, except for IL-1β and the anti-inflammatory cytokine IL-10 (Fig. 4A, B).
Fig. 4. Low dose LPS induced major inflammatory responses in serum and cochleae within 6 hours.

(A) Significant increases in selected serum inflammatory proteins were observed 6 hours after LPS (±gentamicin) injection compared to DPBS-treated mice (±gentamicin; N=10/cohort). (B) Significant increases in cochlear inflammatory proteins were observed 6 hours after LPS (±gentamicin) injection for TNFα, IL-1α, IL-6, IL-8, MIP-1α and MIP-2α (but not IL-1β and IL-10) compared to DPBS-treated mice (±gentamicin; N=5/cohort; 4 cochleae/sample; measured in duplicate; *significant difference after 1-way ANOVA with Bonferroni multiple comparison correction and a family-wise 95% confidence level; error bars, 95% confidence intervals [CI] derived from Student’s t-tests). (C) Significant increases in cochlear mRNA for selected inflammatory markers were observed 6 hours after LPS (±gentamicin) injection when normalized to DPBS-treated mice (N=6/cohort; 2 cochleae/sample; *significant difference if the 95% CI does not overlap with 1 [i.e., DPBS-treated mice baseline]). Gentamicin did not modulate serum or cochlear expression of inflammatory proteins or mRNA for inflammatory markers.
Twenty-four hours after LPS injection in C57BL/6 mice, plasma concentrations of most tested inflammatory proteins were not elevated (or were below the limit of detection; fig. S7A), consistent with previous findings (42). Although IL-6 and MIP-1α concentrations remained significantly elevated compared to DPBS-treated controls, they were substantially lower compared to the 6 hour time point (Fig. 4A, fig. S7A). In cochlear homogenates of C57BL/6 mice 24 hours after LPS injection, concentrations of all tested inflammatory proteins were significantly elevated, particularly IL-6, IL-8 and MIP-1α (Fig. 5A, fig. S7D). These findings suggested that LPS triggers robust inflammatory responses both systemically and in the cochlea within 6 hours. Furthermore, 24 hours after LPS injection, cochleae continued to exhibit significantly elevated concentrations of tested inflammatory proteins (Fig. 5A), akin to that induced by middle ear administration of LPS or bacteria (43, 44).
Fig. 5. TLR4-mediated cochlear inflammatory markers are attenuated in C3H/HeJ mice.

(A) All selected acute phase inflammatory proteins (except for IL-10) were significantly elevated in cochleae from LPS-treated C57BL/6 and C3H/HeOuJ mice compared to DPBS-treated mice of the same strain. Several inflammatory proteins (TNFα, IL-6, IL-8, MIP-1α, MIP-2α) were more elevated in C57BL/6 compared to C3H/HeOuJ mice after LPS. In TLR4-hyporesponsive cochleae from C3H/HeJ mice, only a subset of inflammatory proteins (IL-1α, IL-6, IL-8, MIP-1α) were elevated after LPS, with small differences between the means for TNFα and IL-10. Expression of predominantly later-expressing inflammatory markers (IL-1α, IL-6, IL-8, MIP-1α) was significantly attenuated in LPS-treated C3H/HeJ mice compared to LPS-treated C3H/HeOuJ and C57BL/6 mice (N=4/cohort; 6 cochleae from 3 mice/sample) (B) In C57BL/6 and C3H/HeOuJ mice, significant increases were observed in cochlear expression of Il-1β, Il-6, Il-8, Il-10, Mip-1α and Mip-2α mRNA after LPS treatment when normalized to DPBS-treated mice. These increases were attenuated for Il-8, Mip-1α and Mip-2α in LPS-treated C3H/HeJ mice compared to LPS-treated C3H/HeOuJ mice. Il-10 mRNA expression was significantly higher in C3H/HeJ mice compared to C3H/HeOuJ and C57BL/6 mice (N=4/cohort; 2 cochleae from 1 mouse/sample). Error bars, 95% CI derived from Student’s t-tests; *significant difference compared to C3H/HeOuJ mice after 1-way ANOVA with Dunnett’s post-hoc tests and a family-wise 95% confidence level). See also fig. S6.
To determine if increased cochlear inflammatory protein concentrations were due to local (parenchymal) gene transcription, mRNA levels were assayed 6 or 24 hours after LPS injection (with or without gentamicin). At 6 hours, LPS significantly increased (≥5-fold) mRNA expression for all 8 inflammatory genes tested, particularly Il-6, Il-8 and Mip-1α (Fig. 4C). Gentamicin alone did not modulate cochlear mRNA expression of any inflammatory genes tested (Fig. 4C). Twenty-four hours after LPS injection, cochlear mRNA levels remained significantly elevated for most inflammatory genes tested, except Tnfα and Il-1β (fig. S7G), with greater increases for later-expressing acute phase cytokines: Il-6, Il-8 and Mip-2α (Fig. 5B, fig. S7G). These data show that LPS challenge upregulated cochlear mRNA transcription for inflammatory proteins within 6 hours, with sustained mRNA transcription for later-expressing acute phase inflammatory proteins at 24 hours, as in other organs during endotoxemia including the liver, lung (41), brain (45) and eye (46).
Reduced LPS-mediated inflammation in TLR4-hyporesponsive C3H/HeJ mice
The C3H/HeJ mouse strain is homozygous for an inactivating short-nucleotide polymorphism in TLR4, resulting in greatly attenuated inflammatory responses to LPS exposure (47). Twenty-four hours after LPS injection, plasma concentrations of all tested inflammatory proteins in C3H/HeJ mice, and the control C3H/HeOuJ mouse strain, were not different from those in DPBS-treated mice of the same strain (fig. S7A–C). Unlike control C3H/HeOuJ mice, C3H/HeJ mice did not experience significant weight loss (fig. S4B, P<0.001).
LPS significantly elevated cochlear homogenate concentrations of all acute phase pro-inflammatory proteins 24 hours after injection in control C3H/HeOuJ and C57BL/6 mice compared to DPBS-treated mice of the same strains (Fig. 5A and fig. S7D–F; P<0.05). Several inflammatory proteins (TNFα, IL-6, IL-8, MIP-1α and MIP-2α) were more elevated in C57BL/6 mice compared to C3H/HeOuJ mice after LPS treatment (Fig. 5A). Crucially, several, mostly later-expressing acute phase inflammatory proteins (IL-1α, IL-6, IL-8, and MIP-1α) were significantly attenuated in cochlear homogenates of LPS-treated C3H/HeJ mice compared to LPS-treated C3H/HeOuJ and C57BL/6 mice (Fig. 5A; P<0.05).
Similar trends were seen with cochlear mRNA levels for tested inflammatory genes for both C3H/HeOuJ and C3H/HeJ mice after LPS treatment. LPS significantly increased cochlear mRNA expression of most inflammatory markers tested (not Il-1β) in C3H/HeOuJ mice, particularly later-expressing acute phase pro-inflammatory cytokines: Il-6, Il-8, Mip-1α and Mip-2α (fig. S7H). In contrast, LPS did not modulate cochlear mRNA expression for tested pro-inflammatory markers in C3H/HeJ mice (fig. S7I). When mRNA expression was compared between strains, there was attenuated mRNA expression for later-expressing acute phase pro-inflammatory cytokines (Il-8, Mip-1α and Mip-2α) in LPS-treated C3H/HeJ cochleae compared to LPS-treated C57/BL6 and C3H/HeOuJ mice, and also for Il-6 compared to LPS-treated C57BL/6 mice (Fig. 5B). mRNA expression of early phase pro-inflammatory genes (Tnfα, Il-1α and Il-1β) was weakly or not significantly elevated in all three mouse strains. Interestingly, mRNA for the anti-inflammatory cytokine Il-10 was transcribed at significantly higher levels in C3H/HeJ mice compared to control C3H/HeOuJ or C57BL/6 mice (Fig. 5, fig. S7G–I, P<0.05). These data demonstrate that cochlear expression of acute phase inflammatory markers was upregulated in LPS-treated control C3H/HeOuJ and C57BL/6 mice, and this upregulation was attenuated for later-expressing inflammatory markers in TLR4-hyporesponsive C3H/HeJ mice 24 hours after LPS injection (Fig. 5).
Cochlear lateral wall uptake of GTTR is attenuated in endotoxemic C3H/HeJ mice
Given that LPS-mediated inflammatory responses are attenuated in TLR4-hyporesponsive C3H/HeJ mice, we hypothesized that LPS-enhanced GTTR uptake would also be attenuated in the cochlear lateral wall of TLR4-hyporesponsive C3H/HeJ mice. We injected C3H/HeJ and control C3H/HeOuJ mice with LPS, and 24 hours later injected GTTR. We found significantly enhanced GTTR fluorescence in strial cells and fibrocytes of LPS-treated C3H/HeOuJ mice compared to that in DPBS-treated C3H/HeOuJ mice (Fig. 6, fig. S8A, P<0.05). LPS also significantly enhanced GTTR fluorescence in strial cells (but not fibrocytes) in LPS-treated C3H/HeJ mice compared to that in DPBS-treated C3H/HeJ mice (Fig. 6, fig. S8B, P<0.05). Crucially, however, LPS-enhanced GTTR uptake was significantly attenuated (P<0.05) in marginal cells, intermediate cells and fibrocytes, with a downward trend in basal cells, in TLR4-hyporesponsive C3H/HeJ mice compared to control C3H/HeOuJ mice (Fig. 6). The residual expression of inflammatory markers and cochlear uptake of GTTR in C3H/HeJ mice was likely due to activation of other innate immune system receptors, such as TLR2 (48). These data indicate that TLR4-mediated inflammation mediated (at least in part) LPS-enhanced cochlear uptake of GTTR.
Fig. 6. LPS-induced GTTR uptake by lateral wall cells is attenuated in TLR4-hyporesponsive C3H/HeJ mice.

The fold change in GTTR intensity in LPS-treated mice over DPBS-treated mice is shown. GTTR fluorescence was significantly enhanced in strial marginal (MC), intermediate (IC) and basal (BC) cells, as well as fibrocytes (FC) of LPS-treated C3H/HeOuJ mice compared to that in DPBS-treated C3H/HeOuJ mice. LPS also significantly enhanced GTTR fluorescence intensities in strial cells (but not fibrocytes) in LPS-treated C3H/HeJ mice compared to that in DPBS-treated C3H/HeJ mice. Note that LPS-induced GTTR uptake was significantly attenuated (P<0.05) in marginal cells, intermediate cells and fibrocytes in C3H/HeJ mice compared to C3H/HeOuJ mice. (*P<0.05; N=8/bar; error bars=95% CI derived from Student’s t-tests; significance was determined if 95% CI did not overlap with 1; #P<0.05; unpaired 1-way t-test between strains; see fig. S8 for raw data).
LPS significantly dilated a subset of strial capillaries in C3H/HeOuJ mice compared to DPBS-treated C3H/HeOuJ mice, as we observed for C57BL/6 mice (Fig. 3E,F; Table 1, P<0.0001). Endotoxemia also significantly dilated a smaller subset of strial capillaries in TLR4-hyporesponsive C3H/HeJ mice compared to DPBS-treated C3H/HeJ mice (Fig. 3G; Table 1, P<0.0001). However, the degree of capillary dilation in LPS-treated C3H/HeJ mice was significantly attenuated compared to LPS-treated C3H/HeOuJ mice (Fig. 3G; Table 1, P<0.0001).
Repeated low dose LPS exposure exacerbates kanamycin ototoxicity
Since LPS-induced endotoxemia increased the cochlear uptake of aminoglycosides, we hypothesized that chronic exposure to LPS would exacerbate aminoglycoside-induced ototoxicity, as determined by auditory brainstem response (ABR) threshold shifts. Given that chronic dosing with gentamicin is systemically lethal to mice, we used a related aminoglycoside – kanamycin – with a well-established protocol (27). One group of C57BL/6 mice received 1 mg/kg LPS the day before kanamycin treatment, and on the 5th and 10th day during a 14-day course of kanamycin treatment (700 mg/kg, twice daily). ABR thresholds were obtained from age-matched mice 1, 10 and 21 days after kanamycin treatment, and shifts from pre-treatment thresholds were determined (Fig. 7A,B; figs. S9–S11; tables S3–S5). At all timepoints, DPBS-treated and LPS-treated mice had negligible threshold shifts. One day after chronic dosing, kanamycin induced significant threshold shifts at 16, 24, and 32 kHz compared to DPBS-treated and LPS-treated mice (fig. S11A; table S3), as expected (27). Endotoxemia exacerbated the frequency range of kanamycin-induced threshold shifts (12–32 kHz) compared to age-matched control mice without kanamycin treatment (fig. S11A, table S3).
Fig. 7. Chronic endotoxemia potentiates kanamycin ototoxicity.

(A) Three weeks after chronic LPS (or DPBS) exposure ±kanamycin (see fig. S13), ABR threshold shifts for LPS-only mice (N=5) were not different from DPBS-treated mice (N=4). Kanamycin alone (N=5) induced a small but significant PTS at only 32 kHz (**P<0.01) compared to DPBS-treated mice. Mice that received LPS+kanamycin (N=6) had significant PTS at 16, 24 (##P<0.01) and 32 kHz (#P<0.05) compared to mice treated with kanamycin, DPBS or LPS only (**P<0.01). Mice receiving LPS+kanamycin also had significant PTS at 12 kHz compared to mice treated with DPBS or LPS only (фP<0.05 and P<0.01, respectively), or LPS-only mice at 8 kHz (†P<0.05). Error bars=s.d. All statistical results were produced using 2-way ANOVA with Bonferroni post-hoc correction with 95% family-wise confidence intervals. (B) Cytocochleogram for mice in (A) revealed that OHC loss in the basal cochlear regions was greater and over a wider frequency range in LPS+kanamycin-treated mice compared to mice treated with LPS, DBPS, or kanamycin. Mean cochlear length = 6.84 (±0.79, s.d.) mm. Error bars, 95% CI derived from Student’s t-tests. See also figs. S9–S11, and tables S5, S7 for statistical comparisons using 2-way ANOVA Bonferroni post-hoc correction with 95% family-wise confidence intervals.
The 3-week recovery timepoint is a well-established primary benchmark for many preclinical ototoxicity studies (27, 49, 50). At 21 days post-treatment, kanamycin-treated mice exhibited a significant permanent threshold shift (PTS) only at 32 kHz compared to DPBS-treated and LPS-treated mice. Mice that received both LPS and kanamycin had greater and more significant PTS at 16, 24 and 32 kHz compared to kanamycin-treated mice or mice treated with DPBS or LPS alone (Fig. 7A; table S5). Mice receiving both LPS and kanamycin also had significant PTS at 12 kHz compared to mice treated with DPBS or LPS alone and at 8 kHz compared to mice treated with LPS alone mice (Fig. 7A; table S5). During the 3-week recovery period, kanamycin-induced threshold shifts did not change significantly at individual frequencies between timepoints (figs. S11A–C). However, there was a loss of significant threshold shifts at 16 and 24 kHz in kanamycin-treated mice at 10 and 21 days post-treatment compared to DPBS-treated and LPS-treated mice that were present 1 day post-treatment (figs. S11A–C; tables S3–5). This likely reflected the onset of slight, non-significant threshold shifts in DPBS-treated and LPS-treated mice at 10 and 21 days post-treatment (figs. S11A–C). Endotoxemia, however, increased the degree of kanamycin-induced threshold shifts at 21 days, and over a wider frequency range (8–32 kHz) compared to 1 day post-treatment (figs. S11A–C; tables S3 and S5). These increased threshold shifts trended towards significance at higher frequencies, and reached statistical significance at 32 kHz (P<0.05). Thus, endotoxemia significantly exacerbated kanamycin-induced PTS.
Drug-induced PTS and sensory hair cell death occur in a dose-dependent fashion (27). To verify whether endotoxemia exacerbated kanamycin-induced hair cell death, we obtained cytocochleograms of cochlear hair cell survival at 21 days post-treatment (Fig. 7B, table S7, S9). DPBS-treated and LPS-treated mice had minimal hair cell loss, mostly at the extreme basal (very high frequency) region of the cochlea. Kanamycin induced OHC loss over a wider frequency range in basal cochlear locations, but this was not significant compared to age-matched control mice. LPS-induced endotoxemia significantly enhanced kanamycin-induced OHC loss, and over a wider frequency range (8–64 kHz), compared to non-endotoxemic mice. These data indicate that endotoxemia exacerbated kanamycin-induced OHC death.
We then used hTR to test whether chronic LPS and kanamycin exposure altered the flux of membrane-impermeant hTR across the BLB. Significant threshold shifts were present immediately after chronic treatment with kanamycin, with or without LPS, at 16, 24, and 32 kHz compared to DPBS-treated and LPS-treated mice (figs. S11D, S12; table S6). Cytocochleogram data revealed significantly greater OHC loss in the basal (32–64 kHz) regions of LPS+kanamycin-treated mice compared to all other groups (fig. S11E; table S8). Nonetheless, no differences in hTR fluorescence intensity were detected in strial cells or spiral ligament fibrocytes between LPS+kanamycin-treated mice and control DPBS-treated or chronic LPS-treated adult mice (fig. S11F). However, all cochlear ROI in adult mice had significantly less fluorescence compared to P6 mice (figs. S5B, S11F). Thus, neither chronic endotoxemia nor chronic kanamycin treatment that induced auditory threshold shifts and OHC loss increased the flux of hTR across the adult BLB.
In endotoxemic mice, there was more kanamycin-induced OHC loss, over a wider frequency range, at 3 weeks compared to that immediately post-treatment (Fig. 7B, fig. S11E; table S9). There was also more OHC loss in mice treated with kanamycin only in the 16–32 kHz frequency region, corresponding to the PTS in this region 3 weeks post-treatment compared to that immediately post-treatment (Fig. 7, fig. S11D, E; table S9). These increasing losses of OHCs during the recovery period after ototoxic insult have been described previously (51). LPS-treated and DPBS-treated mice also had significant OHC loss in the 32–64 kHz region compared to 3 weeks earlier (table S9) that was attributed to the onset of strain-specific age-related hearing loss in these 11-week old mice (52). Nonetheless, kanamycin-induced OHC loss in endotoxemic mice greatly exceeded these age-related losses (Fig. 7B, tables S7, S9).
Acute LPS-induced endotoxemia does not alter ABR thresholds
Transtympanic injection of LPS can induce ABR threshold shifts in a dose-dependent manner (53, 54). Systemic LPS (0.5 mg/kg/day for 2 days) did not change ABR thresholds or endolymphatic potentials (18). Since chronic LPS alone did not induce ABR threshold shifts at 6, 16 or 27 days after the last LPS injection (Fig. 7; figs. S9–S11), we tested whether acute systemic LPS exposure modulated auditory thresholds. Twenty-four hours after injection with 1 mg/kg LPS, no significant threshold shifts were observed within, or between, DPBS-treated or LPS-treated groups (fig. S13). The persistence of sensitive auditory function during acute LPS challenge suggests that the physical integrity of the BLB remained intact, since physical disruption of the BLB is thought to impair sensitive cochlear performance (35).
Discussion
The easy availability and low cost of aminoglycosides contributes to their frequent use worldwide (28). Clinical use of aminoglycosides is limited due to the risk of acute nephrotoxicity, and more critically, permanent hearing loss. The risk of ototoxicity is proportional to dose and duration of aminoglycoside therapy (28). Additional factors predisposing patients to aminoglycoside-induced ototoxicity include age, renal dysfunction, mitochondrial mutations, and concurrent exposure to other ototoxic drugs (like loop diuretics) or noise (55–60).
We used LPS-induced inflammation as a model for aminoglycoside pharmacotherapy of severe Gram-negative bacterial infections. LPS binds to ubiquitous TLR4 receptors to initiate immune response signaling cascades (40, 41). Lysis of bacteria by aminoglycosides and immune cells releases LPS and other bacterial ligands into the interstitial and vascular fluids, potentiating the inflammatory response (the Jarisch-Herxheimer reaction) (61, 62).
We found that low doses of LPS (≤1 mg/kg) significantly increased the expression of acute phase inflammatory markers in serum, plasma and cochlear tissues, mimicking low-grade sepsis. Furthermore, acute or chronic endotoxemia did not modulate the paracellular flux of membrane-impermeant hTR across the BLB, nor attenuate cochlear function. Nonetheless, LPS-induced endotoxemia increased cochlear concentrations of GTTR and gentamicin, without modulating the serum concentrations of these compounds. Simultaneous exposure to chronic endotoxemia and kanamycin significantly increased PTS and OHC death compared to age-matched mice treated with kanamycin, LPS or DPBS alone.
Endotoxemia and cochlear inflammation
Until recently, the cochlea had been considered an immunologically-privileged compartment (63). Here, we show that endotoxemia can elevate cochlear expression of inflammatory markers. Although vascular inflammatory proteins could potentially be trafficked across the BLB, significantly elevated serum concentrations of IL-1β and IL-10 were not reflected in cochlear tissues, implying that the BLB is not passively permeable to serum inflammatory proteins. Endotoxemia also significantly increased cochlear mRNA expression of inflammatory proteins. A similar parenchymal response to endotoxemia has been observed in ocular, pulmonary and cerebral tissues (42, 45, 46). The cochlear expression of inflammatory markers was greatly attenuated in LPS-treated mice with hyporesponsive TLR4, as was strial vasodilation and GTTR uptake. Thus, endotoxemia-induced inflammation appears to be associated with changes in BLB physiology that enhanced cochlear loading with gentamicin.
Since cochleae are pooled from several mice to determine cochlear inflammatory marker protein concentrations and mRNA levels, it was not possible to correlate any potential tonotopic gradient in inflammatory protein expression with GTTR uptake, auditory threshold shifts and OHC loss in the basal regions of the cochlea. To accomplish this correlative analysis will require development of more sensitive biochemical or quantitative immunofluorescence techniques.
Endotoxemia alone did not induce ABR threshold shifts, corroborating a recent study showing that low dose LPS exposure has little effect on endolymphatic potentials and auditory thresholds (18). Disruption of the physical integrity of the strial BLB is thought to elevate ABR thresholds (35). This implies that the BLB remained physically intact, even though endotoxemia enhanced aminoglycoside trafficking across the BLB.
Trafficking across the BLB
Several mechanisms have been proposed for the trafficking of small compounds like aminoglycosides across tight junction-coupled endothelial barrier layers, like the blood-brain barrier and the BLB (see fig. S14). Paracellular flux across the BLB is not thought to occur under normal physiological conditions (10, 64), but may arise during inflammation, as has been reported for the blood-brain barrier (15). Pathophysiological opening of paracellular routes can occur by immune cell-dependent and immune cell-independent mechanisms (65). In our panel, IL-8 and MIP-2α, strong chemotactic signals for immune cell recruitment and diapedesis into the parenchyma beyond the blood vessels (66, 67), were highly elevated. Immune cells are capable of secreting cytotoxic molecules that disrupt tight junctions between adjacent endothelial cells, opening paracellular trafficking routes (68). Alternatively, the tight junction-coupling between adjacent endothelial cells could break down independently of immune cell activity allowing paracellular flux through disrupted endothelial tight junctions (69). Although we did not use markers for immune cell-mediated injury or electron-dense tracers, the lack of hTR flux into the intra-strial tissues of adult mice contraindicated a major contribution by paracellular trafficking during acute endotoxemia. Furthermore, chronic endotoxemia with or without chronic kanamycin treatment did not increase hTR flux across the adult strial BLB, corroborating analogous experiments with mannitol following chronic ototoxic drug treatment (64).
Unlike membrane-impermeant hTR, GTTR rapidly traversed the adult BLB into strial tissues, and entered cochlear hair cells within 30 minutes (10, 13, 21), suggestive of transcellular trafficking across the BLB. This could occur via several mechanisms characterized in other cell systems. Aminoglycosides and GTTR can permeate through non-selective cation channels, including the MET channel expressed by hair cells (11, 12), and TRPV4 channels expressed by endothelial cells (70, 71). The sodium-glucose transporter-2 (SGLT2) traffics aminoglycosides into cells, and facilitates aminoglycoside-induced cytotoxicity (72). LPS treatment can upregulate endothelial cation channel expression (73). If endotoxemia increases the expression of aminoglycoside-permeant ion channels or transporters, it will be crucial to determine if these channels enable LPS-enhanced trafficking of aminoglycosides across the BLB.
Endocytotic and transcytotic trafficking across the BLB has been described previously (74) and is increased during endotoxemia in non-cochlear capillary beds (75). While aminoglycosides strongly interact with negatively-charged phospholipid membranes (76), hydrophobic passage (or diffusion) through the membrane is slow (77). How endotoxemia potentiates aminoglycoside trafficking routes across the BLB remains to be determined.
Endotoxemia exacerbates ototoxicity
Chronic kanamycin dosing induced PTS at only 32 kHz. Endotoxemia significantly exacerbated the degree of kanamycin-induced PTS at 32 kHz, and at additional lower frequencies. Furthermore, endotoxemia significantly potentiated the degree of kanamycin-induced OHC death, predominantly in the basal region of the cochlea. These data support prior observations that bacteremia and hyperthermia (an experimental model for sepsis-induced fever) enhanced aminoglycoside-induced ototoxicity in humans and mice, respectively (78, 79). Endotoxemia also potentiated aminoglycoside-induced nephrotoxicity (80), and heightened the degree of cisplatin-induced PTS (81).
Kanamycin-induced OHC loss occurred in a narrower tonotopic range than for drug-induced PTS, as reported previously (27, 82). This mismatch between the broader frequency ranges of PTS and narrower tonotopic regions of OHC loss has been attributed to functional dysregulation of the stria vascularis, hair cell mechanotransduction and/or synaptic activity in surviving hair cells (12, 82, 83). Although partial recovery of auditory function after kanamycin treatment has been described previously, it only occured in regions with lower threshold shifts and greater OHC survival (82). The basis for this partial recovery is thought to be drug clearance from cochlear tissues, facilitating the repair of hair cell and strial physiology incurred during sub-lethal toxicity to resume optimal auditory function (25, 82, 84). However, once threshold shifts exceed >40 dB (akin to the LPS+kanamycin group), no functional or anatomical recovery of hair cells occurred, resulting in a PTS (82, 85).
Endogenous inflammatory responses to Gram-negative bacterial infections are crucial to controlling infection and host survival. However, the clinical use of the life-saving bactericidal aminoglycosides can inadvertently heighten the existing inflammatory response via bacteriolytic release of endotoxins, i.e., the Jarisch-Herxheimer reaction (61, 62), to potentiate both cochlear uptake of aminoglycosides and ototoxicity. Thus, efforts to ameliorate aminoglycoside-induced ototoxicity (and nephrotoxicity) using pharmacotherapeutic agents, for example D-methionine (86), should also aim to demonstrate otoprotection in preclinical models with induced inflammation.
The progression of acute phase inflammation is characterized by changing expression patterns of specific inflammatory proteins over time (40, 41), while the onset of aminoglycoside-induced ototoxicity in mice requires several days of administration (27). We tested inflammation-enhanced cochlear uptake of aminoglycosides only at 24 hours, and this potentiated uptake could be greater at other time points after induction of endotoxemia. We induced endotoxemia using LPS from E. coli, yet, LPS from other bacteria can also activate TLR4. It will be important to determine if other TLR signaling cascades (particularly TLR3 for viremia) also potentiate aminoglycoside-induced ototoxicity. If inner ear inflammation increases the penetration of non-ototoxic antibiotics (e.g., cephalosporins) into the cochlea, then this phenomenon could better preserve auditory and vestibular function during bacterial labyrinthitis (87).
We conclude that endotoxemia-induced inflammation potentiated ototoxicity by increasing aminoglycoside trafficking across the BLB into the cochlea. In toto, these data suggest that patients receiving aminoglycoside pharmacotherapy for life-threatening bacterial infections are at greater risk of ototoxicity than previously recognized.
Materials and Methods
Study design
The objective was to test the hypothesis that LPS-induced inflammation increased cochlear concentrations of aminoglycosides without renal dysfunction or increased serum aminoglycoside concentrations in C57BL/6 mice. We then verified LPS-induced systemic and cochlear inflammation using multiplex ELISAs and quantitative RT-PCR (44) in C57BL/6 mice, and in mice with hypofunctional TLR4 activity (C3H/HeJ) and their strain control (C3H/HeOuJ). We then tested whether LPS-induced inflammation exacerbated aminoglycoside-induced ototoxicity using a well-established protocol for C57BL/6 mice (27). All experiments were approved by the Institutional Animal Care and Use Committee of Oregon Health & Science University, and followed the ARRIVE reporting guidelines (88).
Serum and cochlear concentrations of GTTR, gentamicin, serotonin and histamine
GTTR was prepared as before (20). Mice, chosen at random, received a tail vein injection of DPBS or LPS, followed by an i.p. injection of GTTR (2 μg/g), gentamicin (20 μg/g) or hTR (2 μg/g molar equivalent to GTTR) 24 hours later (fig. S15). LPS-treated mice received one dose (0.1, 1, 2.5, or 10 mg/kg) of LPS (E. coli serotype 0111:B4). One or 3 hours after GTTR, gentamicin or hTR injection, cardiac blood samples were obtained prior to cardiac perfusion with DPBS followed by 4% paraformaldehyde, and cochleae and kidneys were immersion fixed. Fixed tissues were counter-labeled with Alexa-488-conjugated phalloidin and examined by confocal microscopy for fluorophore intensity or capillary diameter analyses by operators blinded to treatment groups (20). Serum concentrations of the gentamicin epitope of GTTR were obtained by OHSU Diagnostic Services (13). Serum and cochlear concentrations of gentamicin or GTTR were also assayed by ELISA according to the manufacturer’s instructions (EuroProxima) to determine concentrations. Serum serotonin and histamine concentrations were obtained using ELISA kits (Rocky Mountain Diagnostics).
Inflammatory protein and mRNA analyses at 6 hours
C57BL/6 mice were randomly grouped and treated as described in fig. S16. For multiplex ELISAs, cochleae were homogenized prior to performing multiplex ELISAs in duplicate (44). For quantitative RT-PCR, excised cochleae were placed in RNAlater (Ambion) and stored at 80° C. Tissue RNA was extracted, reverse-transcribed using an RT2 first-strand kit, prepared for RT-PCR using custom PCR arrays optimized for reaction conditions, primers, and probes (SABiosciences), and analyzed using the SABiosciences PCR Array Data Analysis Web Portal (44).
Inflammatory protein and mRNA analyses at 24 hours
Twenty-four mice for each strain (C57BL/6, C3H/HeOuJ, C3H/HeJ) were randomly grouped and treated as shown in fig. S16. For ELISAs, 8 cochleae from 4 mice per sample were pooled in protein extraction buffer prior to multiplex ELISA, in triplicate. Absolute protein concentrations from DPBS-treated mice were subtracted from LPS-treated mice, and the 95% Student’s confidence intervals propagated. For mRNA levels, RNA from each pair of cochleae were obtained, and cDNA samples analyzed in triplicate using RT2 qPCR Primer Assays read on an Applied Biosystems Step One Plus qRT-PCR. Relative expression levels were calculated using the ΔΔCt method normalized to GAPDH.
Ototoxicity studies
ABRs to pure tones were used to obtain measures of cochlear function prior to and after treatments to determine threshold shifts (20, 72). For toxicity studies, mice were randomly divided into 4 groups (i) DPBS only; (ii) LPS only; (iii) kanamycin only and (iv) LPS plus kanamycin (fig. S17). Mice received 700 mg/kg kanamycin (or DPBS) twice daily for 14 consecutive days (27). Mice received a tail vein injection of 1 mg/kg LPS (or DPBS) the day before kanamycin treatment, and on the 5th and 10th day during kanamycin treatment. ABRs were obtained before kanamycin treatment, and 1, 10 and 21 days after kanamycin treatment prior to fixation and cytocochleogram analyses by operators blinded to treatment groups (27). Additional mice in each group received hTR for 1 hour after ABR testing on day 14 of chronic LPS and/or kanamycin treatment, prior to fixation and processing for hTR fluorescence intensity and cytocochleogram analyses as described above. Neonatal pups (P6) were used as positive controls.
Statistical analyses
Statistical analyses were chosen based on data under analysis. In brief, Wilcoxon signed-rank test was used for GTTR intensity analyses; the Mann-Whitney U test for ordinal variables (e.g., Fig. 2A); and Student’s unpaired t-test for single variable analyses (e.g., Fig. 2B–E). For vasodilation analyses, we used 1-way ANOVA with Tukey post-hoc tests. For ELISA studies in C57BL/6 mice, we used a 1-way ANOVA with Bonferroni multiple comparison correction with family-wise 95% confidence levels, while comparisons of mRNA levels in C57BL/6 mice were determined as significant if the 95% confidence interval (CI) does not overlap with 1 (control-treated baseline). To compare ELISA and mRNA data between strains, a 1-way ANOVA with either Bonferroni or Dunnett’s post-hoc tests and a family-wise 95% confidence level was used. For ABR and cytocochleogram analyses, we used 2-way ANOVA with Bonferroni or Tukey post-hoc tests. The statistical analyses used, number of replicate measurements or mice are stated in each figure legend or in the Supplementary Materials; and P values <0.05 were considered significant.
Materials and Methods
Preparation of GTTR
Gentamicin sulfate (200 mg/ml in 0.1 M potassium bicarbonate, pH 10) and succinimidyl esters of Texas Red (Invitrogen, CA; 10 mg/ml in dimethyl formamide) were agitated together for 1 week at room temperature to produce an approximately 100:1 molar ratio of gentamicin:Texas Red. A high ratio of free gentamicin to Texas Red esters ensures that only one Texas Red molecule is conjugated to any individual gentamicin molecule. We used reversed phase chromatography using C-18 columns (Grace Discovery Sciences, IL) to purify the conjugates from unconjugated gentamicin, and contamination by unreacted Texas Red (20).
Serum and cochlear levels of GTTR, gentamicin, serotonin and histamine
The care and use of all animals reported in this study were approved by the Animal Care and Use Committee of Oregon Health & Science University in keeping with the National Institutes of Health’s Guide for the Care and Use of Laboratory Animals. C57BL/6 mice (15–25 g; 4–7 weeks old) with normal Preyer’s reflex were divided into control and LPS-treated groups. The control group mice received a tail vein injection of DPBS (50 μl/10g) at 0 hours, then an intraperitoneal (i.p.) injection of gentamicin (20 mg/kg) or GTTR (2 mg/kg) 24 hours later (see fig. S11). The LPS group received an intravenous (i.v.) injection of LPS followed by an i.p. injection of GTTR or gentamicin 24 hours later. The LPS group received one of several dosages of LPS (E. coli serotype 0111:B4, Sigma-Aldrich Co., St Louis, MO, USA; 0.1, 1, 2.5, or 10 mg/kg in DPBS, 50 μl/10 g). Six mice (5 out of 19 in 10 mg/kg group, 1 out of 13 in 2.5 mg/kg group) died within 24 hours after LPS injection, as expected (30).
One or 3 hours after gentamicin or GTTR injections, mice were sacrificed, blood samples obtained prior to cardiac perfusion with DPBS followed by 4% paraformaldehyde in DPBS. Cochleae were then excised and immersion fixed in 4% paraformaldehyde. The level of the gentamicin epitope of GTTR in serum samples was obtained by particle-enhanced turbidimetric inhibition immunoassay by OHSU Diagnostic Services (13). The Mann-Whitney U test was used to test for differences between groups. Serum serotonin and histamine levels were obtained from samples collected 3 hours after GTTR (27 hours after LPS or DPBS) injection using ELISA fast track kits for serotonin or histamine (Rocky Mountain Diagnostics, Colorado Springs, CO, USA) by the Oregon Clinical and Translational Research Institute. The Mann-Whitney U test was used to test for differences between groups.
Cochlear imaging
At 1 or 3 hours after GTTR injection, anesthetized mice were transcardially perfused with DPBS, then 4% paraformaldehyde; the cochleae and kidneys excised and post-fixed. The lateral wall and cochlear coils containing the organ of Corti were isolated, and kidneys vibrotome-sectioned ~70 μm thick. Prepared tissues were permeabilized with 0.5 % Triton X-100 for 45 min, rinsed, labeled with Alexa-488-conjugated phalloidin, post-fixed for 15 minutes and rinsed. Tissues from the quarter turn of the basal coil adjacent to the hook region were mounted on slides and examined using a Bio-Rad MRC 1024 ES laser scanning confocal system attached to a Nikon Eclipse TE300 inverted microscope. All GTTR fluorescence images were acquired at the same laser intensity and gain settings, including control tissues. Images of each ROI from the red channel were manually segmented for pixel intensity determination (ImageJ). To normalize data between experimental sets, the mean intensity was ratioed against the control specimen (intensity at 1 hour time point of control animal, at each ROI area) and plotted. The Mann-Whitney U test was used to test for the difference in the relative fluorescence intensity of GTTR between control and experimental groups at each time point and each ROI. Absolute GTTR fluorescence intensity between cell layers of the cochlear lateral wall was compared using Wilcoxon signed rank test after background intensity was subtracted.
In addition, mice in each group received 2 μg/g hTR (equimolar to 2 μg/g GTTR) for 1 hour, 24 hours after LPS injection, then fixed and processed for intensity analysis as described above by blinded operators. Neonatal pups (P6) were used as a positive control. Differences between groups were determined using 1-way Analysis of Variance (ANOVA) with Tukey post-hoc tests. In addition, strial capillary calibers in apical and basal cochlear lateral wall segments were determined as described previously (20).
Gentamicin ELISAs
Paraformaldehyde-perfused cochleae from 4 mice in each DPBS or LPS group at each time point (1 or 3 hours) were excised and stored at −80° C. Thawed cochleae were weighed and then homogenized using BioMasher III kits (DiagnoCine, NJ), with 100 μl homogenizing buffer (SDB, 1.15g Na2HPO4; 0.2g KH2PO4; 0.2g KCl; 30g NaCl; 0.5 ml Tween 80 in 1 liter distilled water, pH 7.4; EuroProxima, Arnhem, The Netherlands). After removal of bone fragments, the protein extract was centrifuged at 4°C, and the supernatant used for gentamicin ELISA according to the manufacturer’s instructions (EuroProxima, Arnhem, The Netherlands) to determine gentamicin or GTTR levels in serum and cochleae (normalized to cochlear mass). Student’s unpaired t-test was used to compare gentamicin levels between groups.
Inflammatory protein and mRNA analyses: 6 hours
As shown in fig. S12, the vehicle control group was anesthetized prior to a tail vein injection of DPBS i.v. at 0 hours, followed by an i.p. injection of DPBS at 3 hours. Using the same time points, a second group received DPBS i.v. followed by gentamicin i.p.; the third group received 1 mg/kg LPS i.v., followed by DPBS i.p.; and the last group received 1 mg/kg LPS, followed by gentamicin i.p. At the 6 hour time point, all mice were anesthetized and cardiac blood collected, the vasculature perfused with ice-chilled DPBS prior to excision of both cochleae and stored at −80° C. Each group contained 16 mice. Gentamicin was administered at a dose of 300 mg/kg, a non-lethal dose to determine any effect of gentamicin on inflammatory protein serum levels (27).
Recent advances allow multiplex ELISAs to measure multiple cochlear inflammatory proteins simultaneously within a single sample (44). Thawed cochleae from 10 mice were homogenized as above with 100 μl T-PER (extraction buffer, source). Bone fragments were removed by centrifugation at 4°C, and protein concentration of the supernatant determined using the Bradford assay and normalized prior to performing multiplex ELISA using Q-Plex Array (Quansys Biosciences, USA) in duplicate, as described previously (44).
Recent advances enable quantitative RT-PCR analyses on primer arrays of multiple genes for inflammatory protein genes to quantify cochlear gene expression (44). Six pairs of excised cochleae from each group were placed in RNAlater (Ambion, Inc, Austin, TX, USA) and stored at −80° C. Tissue RNA was extracted with the Qiagen RNeasy Mini Kit, and sample concentrations of RNA equalized. RNA was reverse-transcribed using an RT2 first-strand kit (SABiosciences Corp, Frederick, MD, USA), and prepared for real-time polymerase chain reaction (RT-PCR), using custom PCR arrays optimized for reaction conditions, primers, and probes (from SABiosciences Corp). The data was analyzed using the SABiosciences PCR Array Data Analysis Web Portal. The housekeeping gene used was glyceraldehyde-3-phosphate dehydrogenase (GAPDH) has been verified to standardize samples routinely (43). One-way ANOVA with Bonferroni multiple comparison correction was used to compare gene expression and protein levels.
Inflammatory protein and mRNA analyses: 24 hours
Twenty-four mice of each strain (C57BL/6, C3H/HeOuJ, C3H/HeJ; 5–6 weeks old) were anesthetized prior to a tail vein injection of LPS (1mg/kg), or DPBS (5μl/g; see fig. S12). Twenty-four hours later, mice were anesthetized, cardiac blood collected in Na2EDTA in pyrogen-free sterile epitubes, the vasculature perfused with ice-cold DPBS, cochleae excised and stored at −80 C. For ELISAs of cochlear inflammatory proteins, 8 cochleae from 4 mice were pooled in protein extraction buffer prior to multiplex ELISA using a Quansys® platform, as described above, and measured in triplicate (2.5, 1.5, and 1mg/ml protein concentration) for each sample. Absolute protein concentrations from DPBS-treated mice were subtracted from LPS-treated mice, and the 95% Student’s confidence intervals propagated. One-way ANOVA using Dunnett’s post-hoc multiple comparison test was used to compare protein levels.
For mRNA levels of cochlear inflammatory proteins, cochleae from 8 mice of each strain (N=4 LPS, N=4 DPBS) were excised and processed as described above. RNA from each pair of cochleae was extracted using an RNeasy kit, and 400ng of RNA from each sample reverse-transcribed using an RT2 first strand kit. cDNA samples were analyzed in triplicate using RT2 qPCR Primer Assays read on an Applied Biosystems Step One Plus qRT-PCR. Relative expression levels were calculated using the ΔΔCt method normalized to GAPDH. One-way ANOVA using Dunnett’s post-hoc multiple comparison tests was used to compare mRNA levels.
ABRs and drug-induced ototoxicity studies
ABRs to pure tones were used to ensure normal cochlear function prior to toxicity studies and determine threshold shifts following kanamycin treatment (20, 72). Briefly, needle electrodes were placed subcutaneously below the test ear, at the vertex, with a ground electrode near the paw. Each ear of each anesthetized mouse was stimulated individually with a closed tube sound delivery system sealed into the ear canal. The ABR to 1 ms rise-time tone burst stimuli at 4, 8, 12, 16, 24 and 32 kHz was recorded and thresholds obtained for each ear. Only mice with normal bilateral, baseline ABR thresholds were used. For toxicity studies, mice were divided into 4 groups, (i) DPBS only; (ii) LPS only; (iii) kanamycin only and (iv) LPS plus kanamycin (fig. S13). Mice received 700 mg/kg kanamycin (or DPBS) twice daily for consecutive 14 days (27). Mice received a tail vein injection of 1 mg/kg LPS (or vehicle) the day before the first day on kanamycin treatment, and every 5th day thereafter during kanamycin treatment (2 additional injections). ABRs were obtained before kanamycin treatment, and 1, 10 and 21 days after kanamycin treatment. Mice were subsequently euthanized, fixed, labeled with Alexa 488-conjugated phalloidin and Hoechst nuclear dyes, prior to imaging with an Olympus FV1000 confocal microscope for hair cell apices and nuclei. Blinded operators constructed cytocochleograms by counting the presence or absence of hair cells along the length of the cochlea (27) in ImageJ software. The frequency map and the length of each cochlea were obtained using the Measure Line and MosaicJ plugins in the ImageJ software. A 2-way ANOVA using Bonferroni post-hoc multiple comparison test correction was used to test for differences between groups.
For BLB permeability studies following chronic LPS and/or kanamycin treatment (as described above), except, on day 14 mice in each of the 4 groups underwent ABR testing, then received 2 μg/g hTR (equimolar to 2 μg/g GTTR) for 1 hour prior to fixation and processing for confocal imaging, pixel intensity and cytocochleogram analyses by blinded operators as described above. Differences between groups were determined using 1-way ANOVA with Tukey post-hoc tests.
Supplementary Material
Fig. S1. LPS treatment enhances cochlear lateral wall uptake of GTTR. (A) In DPBS-treated mice treated with GTTR for 1 hour prior to fixation, absolute GTTR fluorescence is greater in marginal cells, with decreasing levels of fluorescence in intra-strial layers and basal cells, with a substantial drop in spiral ligament fibrocytes. Strial levels of fluorescence were significantly greater for each ROI in basal segments compared to apical segments (P<0.01; parametric paired t-test). In LPS-treated mice, GTTR uptake in strial cells and the spiral ligament was dose-dependently increased with LPS doses greater than 1 mg/kg. The rank order of fluorescence intensity in individual cell types (marginal cells > intra-strial layer > basal cells ≫ spiral ligament) was generally maintained with increasing LPS dose, although more variable degrees of statistical significance were observed with increasing LPS dose and time of GTTR exposure (Wilcoxon signed rank test; *P<0.05; **P<0.01; ***P<0.005; error bars = s.e.m.; N in Table S1). (B) Intensity analysis of GTTR fluorescence in lateral wall cells after treatment with different doses of LPS (relative to DPBS-treated mice). GTTR fluorescence is increasingly elevated in marginal cells, intra-strial tissues (excluding capillary structures), basal cells and spiral ligament fibrocytes with increasing LPS dose at 1 and 3 hours after GTTR injection. In the basal coil, every cell type examined at 1 hour after GTTR injection showed significantly increased fluorescence at 1 mg/kg LPS or higher (Wilcoxon signed rank test; *P<0.05; **P<0.01; ***P<0.005; error bars = s.e.m.; N in Table S1). Strial and spiral ligament fluorescence was significantly greater in basal segments compared to apical segments for each ROI (P<0.01; parametric paired t-test).
Fig. S2. OHC uptake of GTTR is accelerated by LPS exposure. (A) In cochlear OHCs, 24 hours after treatment with 1 mg/kg LPS and 1 hour after exposure to GTTR, confocal images of OHCs in basal coils show increased GTTR uptake compared to OHCs from DPBS-treated mice. Increases in GTTR fluorescence were not as apparent at 3 hours post-GTTR injection. Scale bar = 50 μm. (B) Intensity analysis of GTTR fluorescence in cochlear OHCs after treatment with different doses of LPS (relative to the fluorescence in OHCs at 1 hour) for apical or basal coils. In apical coils, LPS did not consistently modulate GTTR uptake 1 hour after GTTR injection, but trended to significance 3 hours after GTTR injection at higher doses of LPS (> 1 mg/kg). In basal coils, GTTR fluorescence was most consistently and significantly elevated 1 hour after GTTR injection, and trended to significance only at higher doses of LPS (>2.5 mg/kg LPS) 3 hours after GTTR injection (*P<0.05, **P<0.01, ***P<0.001).
Fig. S3. Renal uptake of GTTR is reduced only at high doses of LPS. (A) In DPBS-treated mice at 3 hours after injection with GTTR, intensely-labeled puncta of GTTR fluorescence is localized near brush border microvilli (arrowheads) and diffusely distributed throughout the cytoplasm of proximal tubule cells (p). Note the weaker intensity of GTTR fluorescence in distal tubule cells (d). (B) In LPS-treated mice at 3 hours after injection with GTTR, the intensity of diffuse cytoplasmic GTTR fluorescence in proximal tubule cells is visibly decreased compared to DPBS-treated mice (A). Note also the visible reduction in GTTR-labeled puncta in proximal tubule cells, and negligible fluorescence in the glomerulus (g). Scale bar = 50 μm. (C) The intensity of GTTR fluorescence in proximal tubule cells in mice treated with different doses of LPS. Only in mice treated with 10 mg/kg LPS is a significant reduction in GTTR fluorescence observed, at either 1 or 3 hours after GTTR injection (Student’s t-test; *P<0.05; ***P<0.001).
Fig. S4. LPS induces acute anorexia. (A) After 24 hours, LPS-treated C57BL/6 mice exhibited significant weight loss (~10%) compared to DPBS-treated C57BL/6 mice (Acute; N=32/cohort). LPS-treated C57BL/6 mice (±kanamycin) used in chronic toxicity experiments (Chronic, N as in Fig. 7) also displayed significant weight loss at 24 hours compared to DPBS-treated mice (±kanamycin). Over time, LPS-treated mice (±kanamycin) regained weight, with weights comparable to DPBS-treated mice (±kanamycin) by day 5. (B) LPS-treated C3H/HeOuJ mice also displayed significant weight loss 24 hours after LPS injection compared to DPBS-treated C3H/HeOuJ mice (N = 12 for DPBS, 13 for LPS). LPS-treated C3H/HeJ mice displayed attenuated weight loss 24 hours after LPS injection compared to LPS-treated C3H/HeOuJ mice (unpaired, two-tailed t-test; error bars=s.d.; ***P<0.001).
Fig. S5. LPS does not alter BLB permeability, yet vasodilates apical strial capillaries. (A) Twenty-five hours after LPS, and 1 hour after hTR injection, the absolute mean intensities of hTR fluorescence in marginal cell (MC), intra-strial tissue (IS), basal cell (BC) and spiral ligament (SL) fibrocytes layers from P6 pups are significantly elevated compared to lateral wall ROIs in adult mice. There was no difference in fluorescence of lateral wall ROIs from DPBS- or LPS-treated adult mice (***P< 0.001, 2-way ANOVA with Bonferroni post-hoc tests). (B) After chronic treatment with kanamycin (±LPS), the absolute mean intensities of hTR fluorescence in lateral wall ROIs from P6 pups were significantly elevated compared to those in adult mice. There was no difference in hTR fluorescence of lateral wall ROIs from DPBS-, LPS-, kanamycin- or LPS+kanamycin-treated adult mice (***P<0.001; N=6 cochleae/group; error bars=s.d.; 2-way ANOVA with Bonferroni post-hoc tests). (C) Twenty-five hours after LPS, a subpopulation of apical strial capillaries were dilated compared to DPBS-treated mice (see also Table 1), resulting in a bimodal distribution. A Gaussian regression curve fit was applied to obtain the bimodal peak means in Table 1.
Fig. S6. Serum serotonin, but not histamine, levels were decreased with increasing doses of LPS. (A) Serum histamine levels were not statistically affected by increasing doses of LPS, nor show a trend. (B) Serum serotonin levels were significantly decreased at all LPS doses compared to DPBS-treated mice (0 LPS; *P<0.05, **P<0.001). The Mann-Whitney U test was used to test for differences between groups.
Fig. S7. TLR4-mediated inflammatory markers are modulated by LPS. (A) Twenty-four hours after 1 mg/kg LPS injection, plasma levels of most acute phase inflammatory proteins in C57BL/6 mice were not significantly different (or below the limit of detection indicated by the dashed line) compared to DPBS-treated C57BL/6 mice, except for IL-6 and MIP-1α. (B) Twenty-four hours after LPS injection, plasma levels of all tested acute phase inflammatory proteins in C3H/HeOuJ mice were not significantly different (or below the limit of detection) compared to DPBS-treated C3H/HeOuJ mice. (C) Twenty-four hours after 1 mg/kg LPS injection, plasma levels of all tested acute phase inflammatory proteins in C3H/HeJ mice were not significantly different (or below the limit of detection) compared to DPBS-treated C3H/HeJ mice. (For A–C: N=4/cohort, measured in duplicate; error bars = 95% CI derived from Student’s t-tests; *significant difference compared to DPBS-treated mice of the same strain after a 1-way unpaired Student’s t-test at the 95% CI.) (D) Twenty-four hours after 1 mg/kg LPS injection, cochlear concentrations of tested inflammatory proteins from C57BL/6 mice were all significantly elevated above baseline levels in DPBS-treated C57BL/6 mice, with the greatest changes observed for IL-6, IL-8, MIP-1α and MIP-2α. (E) In cochleae from C3H/HeOuJ mice, all acute phase pro-inflammatory proteins were significantly elevated 24 hours after LPS injection compared to DPBS-treated C3H/HeOuJ mice, except for IL-10. (F) In TLR4-hyporesponsive cochleae from C3H/HeJ mice 24 hours after LPS injection, only a subset of acute phase inflammatory markers (TNFα, IL-1α, IL-6, IL-8, IL-10, and MIP-1α) were significantly elevated compared to DPBS-treated C3H/HeJ mice. (For D–F: N=4/cohort; 6 cochleae pooled from 3 mice/sample, measured in triplicate; error bars = 95% CI derived from Student’s t-tests; *significant difference compared to DPBS-treated mice of the same strain after a one-way unpaired Student’s t-test at the 95% CI.) (G, H) When cochlear mRNA levels in C57BL/6 (G) and C3H/HeOuJ (H) mice were assayed, significant increases were observed in Il-1α, Il-6, Il-8, Il-10, Mip-1α and Mip-2α mRNA 24 hours after LPS injection compared to DPBS-treated mice of the same strain, and for Tnfα in C3H/HeOuJ mice. (I) In C3H/HeJ mice, LPS significantly increased anti-inflammatory Il-10 mRNA levels 24 hours after LPS injection, but not for any pro-inflammatory markers. (For G–I: N=4/cohort; 2 cochleae from 1 mouse/sample, measured in triplicate; error bars = 95% CI derived from Student’s t-tests; *significant difference is noted if the 95% CI does not overlap with 1).
Fig. S8. LPS-induced GTTR uptake by cochlear lateral wall cells in control C3H/HeOuJ and TLR4-hyporesponsive C3H/HeJ mice. (A) The fluorescence intensity of GTTR in marginal cells (MC), intermediate cells (IC), and basal cells (BC) of the stria vascularis, as well as spiral ligament fibrocytes (FC), were significantly greater in LPS-treated C3H/HeOuJ mice (□) over DPBS-treated C3H/HeOuJ mice (○). (B) The fluorescence intensity of GTTR in strial marginal, intermediate and basal cells, as well as spiral ligament fibrocytes were increased in LPS-treated C3H/HeJ mice (□) over DPBS-treated C3H/HeJ mice (○). However, the LPS-induced increase in GTTR fluorescence was only significant for intermediate and basal cells (unpaired t-test 1-way; *P<0.05; N=4; error bars = 95% CI derived from Student’s t-tests).
Fig. S9. Absolute ABR thresholds are elevated by chronic kanamycin, or kanamycin plus LPS, dosing. Absolute ABR thresholds for each ear of C57BL/6 mice (in gray) in each group, at stated time points before or after LPS and/or kanamycin treatment, with age-matched controls (DPBS-treated). Black line indicates the group mean (±s.d.). Note the general elevation in thresholds at 1.5 and 3 weeks post-treatment for mice treated with both LPS and kanamycin (bottom right panel) compared to age-matched DPBS-only or LPS-only treated mice (bottom row, two left panels).
Fig. S10. Threshold shifts induced by chronic kanamycin, or kanamycin plus LPS, dosing. ABR threshold shifts for each ear of C57BL/6 mice (in gray) in each group, at stated time points after LPS and/or kanamycin treatment, with age-matched controls (DPBS). Black line indicates the group mean (±s.d.). Note the general elevation in individual and mean threshold shifts at 1.5 and 3 weeks post-treatment for mice treated with both LPS and kanamycin (lower two extreme right panels) compared to age-matched mice in other groups (bottom two rows, leftmost panels).
Fig. S11. Effect of chronic kanamycin treatment, with or without LPS, on ABRs, OHC survival and BLB permeability. C57BL/6J mice were treated as described in the text (see fig. S17). One day post-treatment (A), kanamycin (N=5) and LPS+kanamycin (N=6) induced significant threshold shifts at 16, 24 and 32 kHz compared to DPBS- (N=4) and LPS-treated (N=5) control mice. LPS+kanamycin also induced significant threshold shifts at 12 kHz compared to controls (table S3). Ten days post-treatment (B), threshold shifts for kanamycin-treated mice were no longer significantly different from DPBS- and LPS-treated mice (table S4). LPS+kanamycin induced significant threshold shifts at 4, 12, 16, 24 and 32 kHz compared to DPBS-treated mice, and at all frequencies compared to LPS-treated mice (table S4). LPS+kanamycin also induced significant threshold shifts at 16, 24 and 32 kHz compared to kanamycin-treated mice (table S4). Three weeks post-treatment (C), kanamycin induced a significant PTS only at 32 kHz compared to DPBS-treated mice (table S5). LPS+kanamycin induced significant PTS at 16, 24 and 32 kHz frequencies compared to kanamycin-, DPBS- and LPS-treated mice; and also at 12 kHz compared to DPBS- and LPS-treated mice, as well as LPS-only mice at 8 kHz (table S5). Error bars=s.d. Data in A–C are from the same mice and correspond to Fig. 7A,B and P values in tables S3–S5. (D) Immediately after chronic treatment, kanamycin (N=5) induced significant threshold shifts at 4, 24 and 32 kHz compared to DPBS-treated (N=5) mice, and at 24 and 32 kHz compared to LPS-treated (N=6) mice. LPS+kanamycin (N=7) induced significant threshold shifts at 16, 24 and 32 kHz compared to DPBS-only mice; and at 24 and 32 kHz compared to LPS-only mice (table S6). LPS+kanamycin did not induce significantly different threshold shifts at any frequency compared to kanamycin-treated mice (table S6). Error bars=s.d. Data in D correspond to fig S11E,F and P values in table S6. (E) Immediately after chronic treatment, kanamycin-treated mice exhibited greater OHC loss in the basal 32–64 kHz region of the cochlea compared to DPBS- and LPS-treated mice, but this was not significant (table S8). LPS+kanamycin-treated mice had substantially greater OHC loss over a wider frequency range compared to the kanamycin-only group, as well as DPBS- and LPS-only mice that was statistically significant in the 23–64 kHz region (see also fig. S12; table S8). In the more apical 8–16 kHz region, 2 mice in the LPS+kanamycin-treated group exhibited almost total OHC loss, while the remaining 4 mice had negligible OHC loss, contributing to increased error and lack of significance (table S8). Mean cochlear length = 6.49 (±2.6, s.d.) mm. Error bars=95% CI derived from Student’s t-tests. (F) The relative mean intensities of hTR fluorescence in marginal cell (MC), intra-strial tissue (IS), basal cell (BC) and spiral ligament (SL) fibrocyte layers from P6 pups are significantly elevated compared to adult mice. There was no difference in hTR fluorescence of lateral wall ROIs from DPBS-, LPS-, kanamycin or LPS+kanamycin-treated adult mice (***P<0.005; N=6 cochleae/group; error bars=s.d.; 2-way ANOVA with Bonferroni post-hoc tests).
Fig. S12. Absolute ABRs, threshold shifts and weight changes induced by chronic LPS, kanamycin, or LPS+kanamycin in C57BL/6 mice. (A) Absolute ABR thresholds for individual ears (in gray) by group prior to treatment, and one day post-treatment with chronic exposure to LPS and/or kanamycin, with age-matched controls (DPBS-treated). Black line indicates the group mean (±s.d.). (B) ABR threshold shifts for individual ears (in gray) by group, one day post-treatment with chronic exposure to LPS and/or kanamycin, with age-matched controls (DPBS-treated). (C) Twenty-four hours after each LPS treatment on day 0, day 5 or day 10, LPS-treated mice exhibited substantial weight loss (~10%) compared to DPBS-treated C57BL/6 mice). Over time, mice generally regained weight after LPS treatment (±kanamycin) with weights comparable to DPBS-treated mice (±kanamycin) after 5 days.
Fig. S13. Acute LPS-induced endotoxemia does not alter ABR thresholds. (A, B) Baseline ABR thresholds prior to i.v. injection with DPBS or 1 mg/kg LPS (4 C57BL/6 mice/group; 2 ears/mouse; each mouse identified by individual color; left ears ■; right ears ▲). (C, D) ABR thresholds 24 hours after injection with DPBS or 1 mg/kg LPS; no obvious changes were observed. (E, F) Threshold shifts from baseline for each ear 24 hours after injection with DPBS or 1 mg/kg LPS. (G) Group mean threshold shifts (±s.d.) of mice pre-treated 24 hours earlier with either DPBS or 1 mg/kg LPS. No statistically significant threshold shifts were observed within each group or between groups (N=4 mice per group).
Fig. S14. Schematic displaying potential mechanisms for aminoglycoside trafficking across the BLB. Two possible mechanisms of paracellular flux include immune cell-mediated, or immune cell-independent, breakdown of tight junction-coupling between endothelial cells. Transcellular flux of hydrophilic, cationic aminoglycosides include permeation of non-selective cation channels, translocation via substrate transporters, transcytosis through the cell, and/or diffusion across the hydrophobic plasma membrane. Not to scale, and adapted from (15).
Fig. S15. Acute LPS and aminoglycoside dosing paradigm. Different doses of LPS were injected i.v., and 24 hours later, GTTR, gentamicin or hTR was injected i.p. Control C57BL/6 mice received an i.v. injection of DPBS. Mice were sacrificed 1 or 3 hours after aminoglycoside injection.
Fig. S16. ELISA and qRT-PCR experimental designs for 6 and 24 hour LPS exposures. (A) 6 hour. Sixteen C57BL/6 mice per group. Control mice received an i.v. tail vein injection of DPBS at 0 hours, then an i.p. injection of DPBS at 3 hours. At the same time points, a second group received DPBS i.v. followed by gentamicin i.p.; a third group received 1 mg/kg LPS i.v., followed by DPBS i.p.; the fourth group received LPS i.v. and, 3 hours later, gentamicin i.p. Gentamicin was administered at a dose of 300 mg/kg. At 6 hours, all mice were sacrificed, and both cochleae plus a blood sample collected. Cochleae from 10 mice were used for ELISA protein quantification (4 cochleae/sample; N=5); while cochleae from 6 mice were used for mRNA extraction and real-time quantitative RT-PCR (qRT-PCR; 4 cochleae/sample; N=3). (B) 24 hour. Sixteen mice per group, with two groups (1 mg/kg LPS, or vehicle control DPBS) per mouse strain C57B/l6, C3H/HeOuJ (strain control) and C3H/HeJ (TLR4-hyporesponsive). All mice received an i.v. tail vein injection of DPBS or LPS at 0 hours. At the 24 hour time point, all mice were sacrificed, and both cochleae plus a blood sample collected. Cochleae from 12 mice per group (6 cochleae/sample; N=4) were used for ELISA protein quantification; while cochleae from 4 mice per group (2 cochleae/sample; N=4) were used for RNA extraction and real-time qRT-PCR.
Fig. S17. Chronic LPS-induced endotoxemia and kanamycin ototoxicity protocol. For toxicity studies, mice were divided into 4 groups, (i) DPBS only; (ii) LPS only; (iii) kanamycin only and (iv) LPS+kanamycin. Mice received 700 mg/kg kanamycin (or DPBS) subcutaneously twice daily for consecutive 14 days. Auditory brainstem responses (ABRs) to pure tones were obtained prior to LPS and kanamycin dosing, and also 1, 10 and 21 days after cessation of kanamycin dosing to determine any threshold shifts following LPS and/or kanamycin administration compared to age-matched controls (i.e., DPBS- or LPS-only groups). Mice received 1 mg/kg LPS (or DPBS) 1 day prior to kanamycin treatment, and on the 5th and 10th day during kanamycin treatment (2 additional injections).
Table S1. Number of mice in each condition for Figs. 1, 2A and fig. S1. * GTTR was i.p. injected 24 hours after i.v. injection of LPS or DPBS.
Table S2. Probability of significant difference in GTTR serum levels for Fig. 2A. Serum levels of GTTR were significantly elevated in 2.5 and 10 mg/kg LPS-treated mice compared to DPBS-treated controls (0 mg/ml LPS). Serum levels of GTTR in the 2.5 mg/kg LPS group were significantly higher than 0.1 and 1 mg/kg groups both at 1 hour and 3 hour time points (Mann-Whitney U test).
Table S3. Probability of a significant difference in threshold shifts one day after chronic LPS-induced endotoxemia with or without kanamycin treatment. One day following chronic exposure to LPS±kanamycin (see fig. S17), ABR threshold shifts from baseline were obtained (fig. S10A). Threshold shifts for DPBS-only mice (N=4) were not different from LPS-treated mice (N=5). Kanamycin alone (N=5) induced significant threshold shifts at 16, 24 and 32 kHz compared to DPBS- and LPS-treated mice. Mice that received LPS+kanamycin (N=6) had significant threshold shifts at 12, 16, 24 and 32 kHz frequencies compared to DPBS- and LPS-treated mice. Mice receiving LPS+kanamycin did not have significant threshold shifts at any frequency compared to kanamycin-treated mice. *P<0.05, **P<0.01; ***P<0.001; 2-way ANOVA with Bonferroni post-hoc tests. Statistical analyses correspond to data in figs. S9, S10 and S11A.
Table S4. Probability of a significant difference in threshold shifts 1.5 weeks after chronic LPS-induced endotoxemia with or without kanamycin treatment. One and a half weeks following chronic exposure to LPS±kanamycin (see fig. S13), ABR threshold shifts from baseline were obtained (fig. S10B). Threshold shifts for DPBS-only mice (N=4) were not different from LPS-treated mice (N=5). Kanamycin alone (N=5) induced negligible threshold shifts compared to DPBS- and LPS-treated mice. Mice that received LPS+kanamycin (N=6) had significant threshold shifts at 4, 12, 16, 24 and 32 kHz frequencies compared to DPBS-treated mice, and at 4, 8, 12, 16, 24 and 32 kHz compared to LPS-treated mice. Mice receiving LPS+kanamycin also had significant threshold shifts at 16, 24 and 32 kHz compared to kanamycin-treated mice. *P<0.05, **P<0.01; ***P<0.001; 2-way ANOVA with Bonferroni post-hoc tests. Statistical analyses correspond to data in figs. S9, S10 and S11B.
Table S5. Probability of a significant difference in threshold shifts 3 weeks after chronic LPS-induced endotoxemia with or without kanamycin treatment. Three weeks after chronic LPS exposure (3× 1 mg/kg LPS i.v., 5 days apart) ±kanamycin (700 mg/kg, 2x daily for 14 days, see fig. S17), ABR threshold shifts from baseline were determined (Fig. 7C, and fig. S11C). Threshold shifts for DPBS-only mice (N=4) were not different from LPS-treated mice (N=5). Kanamycin alone (N=5) induced a significant PTS at only 32 kHz compared to LPS- and DPBS-treated mice. Mice that received LPS+kanamycin (N=6) had significant PTS at 16, 24 and 32 kHz compared to kanamycin-only, as well as DPBS-only and LPS-only mice. Mice receiving LPS+kanamycin also significant PTS at 12 kHz compared to DPBS- and LPS-only mice, as well as LPS-only mice at 8 kHz. *P<0.05, **P<0.01; 2-way ANOVA with Bonferroni post-hoc tests. Statistical analyses correspond to data presented in Fig. 7A,B, and figs. S9, S10 and. S11C.
Table S6. Probability of a significant difference in threshold shifts immediately after chronic LPS-induced endotoxemia with or without kanamycin treatment. Immediately following chronic exposure to LPS±kanamycin (see fig. S17), ABR threshold shifts from baseline were obtained (fig. S10D). ABR threshold shifts for the DPBS-only mice (N=5) were not different from LPS-treated mice (N=6). Kanamycin alone (N=5) induced significant threshold shifts at 4, 24 and 32 kHz compared to DPBS-treated mice, and at 24 and 32 kHz compared to LPS-treated mice. Mice that received LPS+kanamycin (N=7) had significant threshold shifts at 16, 24 and 32 kHz frequencies compared to DPBS-only mice; with significant threshold shifts at 24 and 32 kHz compared to LPS-only mice. Mice receiving LPS+kanamycin did not have significant threshold shifts at any frequency compared to kanamycin-treated mice. *P<0.05, **P<0.01; ***P<0.001; 2-way ANOVA with Bonferroni post-hoc tests. Statistical analyses correspond to data presented in fig. S11D–F and S12.
Table S7. Probability of a significant difference in OHC survival 3 weeks after chronic LPS-induced endotoxemia with or without kanamycin treatment. Three weeks following chronic exposure to LPS (±kanamycin), cytocochleograms of OHCs were obtained (Fig. 7B). No significant differences in OHC survival occurred between DPBS-, LPS-, kanamycin- and LPS+kanamycin-treated groups in the more apical, lower frequency (4–8 kHz) regions of the mouse cochlea. Substantial losses of OHCs occurred in higher frequency (8–64 kHz) regions of LPS+kanamycin-treated cochleae that were significantly different from DPBS-, LPS- and kanamycin-treated groups. LPS+kanamycin also induced significant IHC loss only in the 16–32 kHz region compared to DPBS-, LPS-, and kanamycin-treated mice (P<0.05, P<0.05 and P<0.01, respectively). 2-way ANOVA using Tukey post-hoc tests; **P<0.01, ****P<0.0001. Statistical analyses correspond to cytocochleogram data presented in Fig. 7B.
Table S8. Probability of a significant difference in OHC survival immediately after chronic LPS-induced endotoxemia with or without kanamycin treatment. Immediately following chronic exposure to LPS (±kanamycin), cytocochleograms of OHCs were obtained (fig. S11E). No significant differences in OHC survival occurred between DPBS-, LPS-, kanamycin- and LPS+kanamycin-treated groups in apical, lower frequency (4–16 kHz) regions of the cochlea. Substantial loss of OHCs occurred in basal high frequency regions of LPS+kanamycin-treated cochleae that were significantly different from DPBS-, LPS- and kanamycin-treated groups. LPS+kanamycin also induced significant IHC loss only in at 32 kHz compared to DPBS- and LPS-treated mice, but not at any other frequency or with kanamycin treated mice (P<0.01 and P<0.05, respectively). 2-way ANOVA with Tukey post-hoc tests; ***P<0.001, ****P<0.0001. Statistical analyses correspond to cytocochleogram data in fig. S11E.
Table S9. Probability of decreasing OHC survival 3 weeks after chronic LPS-induced endotoxemia with or without kanamycin treatment compared to immediately after treatment. The mean OHC survival (±s.d.) per frequency region immediately after, and 3 weeks following, chronic exposure to LPS±kanamycin (see cytocochleograms in Fig. 7B, and fig. S11E) are shown. Three weeks after treatment, significantly greater OHC loss was observed in LPS+kanamycin treated mice in 8–64 kHz regions of the cochlea compared to immediately after chronic treatment. Three weeks after kanamycin treatment, significantly greater hair cell loss was only observed in the 16–32 kHz region. LPS- and DPBS-treated mice also had significant OHC loss in the 32–64 kHz region compared to 3 weeks earlier. LPS also induced significant IHC loss only in the 32–64 kHz region (P<0.05) compared to all other groups. All analyses done using Student’s t-test; *P<0.05, **P<0.01; ****P<0.0001. Statistical analyses correspond to cytocochleogram data in Fig. 7B and fig. S11E.
Accessible Summary: Inflammation potentiates antibiotic-induced hearing loss.
Aminoglycoside antibiotics are essential for treating life-threatening infections, despite the known risk of permanent hearing loss by damaging cochlear sensory cells in the inner ear in healthy subjects. Because severe infections also trigger widespread inflammation, Koo and colleagues tested the effect of inflammation on aminoglycoside-induced hearing loss as a model of clinical dosing with these drugs. Systemic inflammation increased cochlear uptake of aminoglycosides and, surprisingly, cochlear expression of inflammatory markers. Inflammation also greatly exacerbated aminoglycoside-induced hearing loss and cochlear sensory cell death compared to healthy subjects. It is hoped this information will assist clinicians to choose the appropriate pharmacotherapy for patients with severe infections to better protect life-long hearing health, and encourage the development of otoprotective drugs to also demonstrate efficacy against aminoglycoside-induced ototoxicity during infection-induced inflammation.
Acknowledgments
We thank Dennis Trune for discussions on the project and manuscript, as well as Francis Hausman and Barbara Larrain for technical support with ELISA and qRT-PCR technology. Karen Thiebes assisted with figure preparation.
Funding: Supported by National Research Foundation of Korea Grant 2011-0010166; Seoul National University Bundang Hospital 03-2011-007 (J.K.W); National Institute of Deafness and Other Communication Disorders R01 DC004555, R01 DC12588 (P.S.S), R03 DC011622 (H.L.), P30 DC005983; and by the Department of Otolaryngology, Oregon Health & Sciences University (L.Q.D). Statistical analyses were guided by Oregon Clinical and Translational Research Institute personnel supported through the National Center for Advancing Translational Sciences (UL1TR000128). The content is solely the responsibility of the authors and does not necessarily represent the official views of the NIH. Additional support provided by an American Otological Society Training Fellowship (Z.D.U).
Footnotes
Author contributions: P.S.S., J.W.K., and Z.D.U designed the experimental plan. J.W.K. performed all GTTR imaging and vasoactive peptide experiment in C57BL/6 mice; J.W.K and M.J. performed aminoglycoside serum analyses. J.P.L, and J.A. performed hTR and vasodilation studies. L.Q.D. performed inflammatory marker analyses at 6 hours. Z.D.U performed all analyses using C3H/HeOuJ and C3H/HeJ mice. J.P.L, M.J., J.J.A., C.P.C., H.L. and P.S.S. performed the ototoxicity analyses. P.S.S. and J.W.K. wrote the manuscript and reviewed all analyses. All authors reviewed and approved the manuscript.
Competing interests: All authors declare no competing interests.
References
- 1.Kimberlin DW. Meningitis in the Neonate. Current treatment options in neurology. 2002;4:239–248. doi: 10.1007/s11940-002-0041-1. [DOI] [PubMed] [Google Scholar]
- 2.Radigan EA, Gilchrist NA, Miller MA. Management of aminoglycosides in the intensive care unit. Journal of intensive care medicine. 2010;25:327–342. doi: 10.1177/0885066610377968. [DOI] [PubMed] [Google Scholar]
- 3.Cheng AG, Johnston PR, Luz J, Uluer A, Fligor B, Licameli GR, Kenna MA, Jones DT. Sensorineural hearing loss in patients with cystic fibrosis. Otolaryngol Head Neck Surg. 2009;141:86–90. doi: 10.1016/j.otohns.2009.03.020. [DOI] [PubMed] [Google Scholar]
- 4.Pillers DM, Schleiss MR. Gentamicin in the Clinical Setting. The Volta Review. 2005;105:205–210. [Google Scholar]
- 5.Erenberg A, Lemons J, Sia C, Trunkel D, Ziring P. Newborn and infant hearing loss: detection and intervention. American Academy of Pediatrics. Task Force on Newborn and Infant Hearing, 1998–1999. Pediatrics. 1999;103:527–530. doi: 10.1542/peds.103.2.527. [DOI] [PubMed] [Google Scholar]
- 6.Jarvelin MR, Maki-Torkko E, Sorri MJ, Rantakallio PT. Effect of hearing impairment on educational outcomes and employment up to the age of 25 years in northern Finland. Br J Audiol. 1997;31:165–175. doi: 10.3109/03005364000000019. [DOI] [PubMed] [Google Scholar]
- 7.Kennedy CR, McCann DC, Campbell MJ, Law CM, Mullee M, Petrou S, Watkin P, Worsfold S, Yuen HM, Stevenson J. Language ability after early detection of permanent childhood hearing impairment. N Engl J Med. 2006;354:2131–2141. doi: 10.1056/NEJMoa054915. [DOI] [PubMed] [Google Scholar]
- 8.Schroeder L, Petrou S, Kennedy C, McCann D, Law C, Watkin PM, Worsfold S, Yuen HM. The economic costs of congenital bilateral permanent childhood hearing impairment. Pediatrics. 2006;117:1101–1112. doi: 10.1542/peds.2005-1335. [DOI] [PubMed] [Google Scholar]
- 9.Lin FR, Ferrucci L, Metter EJ, An Y, Zonderman AB, Resnick SM. Hearing loss and cognition in the Baltimore Longitudinal Study of Aging. Neuropsychology. 2011;25:763–770. doi: 10.1037/a0024238. [DOI] [PMC free article] [PubMed] [Google Scholar]
- 10.Li H, Steyger PS. Systemic aminoglycosides are trafficked via endolymph into cochlear hair cells. Sci Rep. 2011;1:159. doi: 10.1038/srep00159. [DOI] [PMC free article] [PubMed] [Google Scholar]
- 11.Alharazneh A, Luk L, Huth M, Monfared A, Steyger PS, Cheng AG, Ricci AJ. Functional hair cell mechanotransducer channels are required for aminoglycoside ototoxicity. PLoS ONE. 2011;6:e22347. doi: 10.1371/journal.pone.0022347. [DOI] [PMC free article] [PubMed] [Google Scholar]
- 12.Marcotti W, van Netten SM, Kros CJ. The aminoglycoside antibiotic dihydrostreptomycin rapidly enters mouse outer hair cells through the mechano-electrical transducer channels. J Physiol. 2005;567:505–521. doi: 10.1113/jphysiol.2005.085951. [DOI] [PMC free article] [PubMed] [Google Scholar]
- 13.Wang Q, Steyger PS. Trafficking of systemic fluorescent gentamicin into the cochlea and hair cells. J Assoc Res Otolaryngol. 2009;10:205–219. doi: 10.1007/s10162-009-0160-4. [DOI] [PMC free article] [PubMed] [Google Scholar]
- 14.Butt AM. Effect of inflammatory agents on electrical resistance across the blood-brain barrier in pial microvessels of anaesthetized rats. Brain Res. 1995;696:145–150. doi: 10.1016/0006-8993(95)00811-4. [DOI] [PubMed] [Google Scholar]
- 15.Abbott NJ, Ronnback L, Hansson E. Astrocyte-endothelial interactions at the blood-brain barrier. Nat Rev Neurosci. 2006;7:41–53. doi: 10.1038/nrn1824. [DOI] [PubMed] [Google Scholar]
- 16.Tsao N, Hsu HP, Wu CM, Liu CC, Lei HY. Tumour necrosis factor-alpha causes an increase in blood-brain barrier permeability during sepsis. Journal of medical microbiology. 2001;50:812–821. doi: 10.1099/0022-1317-50-9-812. [DOI] [PubMed] [Google Scholar]
- 17.Koo JW, Wang Q, Steyger PS. Infection-mediated vasoactive peptides modulate cochlear uptake of fluorescent gentamicin. Audiol Neurootol. 2011;16:347–358. doi: 10.1159/000322851. [DOI] [PMC free article] [PubMed] [Google Scholar]
- 18.Hirose K, Li SZ, Ohlemiller KK, Ransohoff RM. Systemic lipopolysaccharide induces cochlear inflammation and exacerbates the synergistic ototoxicity of kanamycin and furosemide. J Assoc Res Otolaryngol. 2014;15:555–570. doi: 10.1007/s10162-014-0458-8. [DOI] [PMC free article] [PubMed] [Google Scholar]
- 19.Remick DG, Newcomb DE, Bolgos GL, Call DR. Comparison of the mortality and inflammatory response of two models of sepsis: lipopolysaccharide vs. cecal ligation and puncture. Shock. 2000;13:110–116. doi: 10.1097/00024382-200013020-00004. [DOI] [PubMed] [Google Scholar]
- 20.Li H, Wang Q, Steyger PS. Acoustic trauma increases cochlear and hair cell uptake of gentamicin. PLoS ONE. 2011;6:e19130. doi: 10.1371/journal.pone.0019130. [DOI] [PMC free article] [PubMed] [Google Scholar]
- 21.Dai CF, Mangiardi D, Cotanche DA, Steyger PS. Uptake of fluorescent gentamicin by vertebrate sensory cells in vivo. Hear Res. 2006;213:64–78. doi: 10.1016/j.heares.2005.11.011. [DOI] [PMC free article] [PubMed] [Google Scholar]
- 22.Dai CF, Steyger PS. A systemic gentamicin pathway across the stria vascularis. Hear Res. 2008;235:114–124. doi: 10.1016/j.heares.2007.10.010. [DOI] [PMC free article] [PubMed] [Google Scholar]
- 23.Wang Q, Kachelmeier A, Steyger PS. Competitive antagonism of fluorescent gentamicin uptake in the cochlea. Hear Res. 2010;268:250–259. doi: 10.1016/j.heares.2010.06.008. [DOI] [PMC free article] [PubMed] [Google Scholar]
- 24.Balogh K, Jr, Hiraide F, Ishii D. Distribution of radioactive dihydrostreptomycin in the cochlea. An autoradiographic study. Ann Otol Rhinol Laryngol. 1970;79:641–652. doi: 10.1177/000348947007900329. [DOI] [PubMed] [Google Scholar]
- 25.Imamura S, Adams JC. Distribution of gentamicin in the guinea pig inner ear after local or systemic application. J Assoc Res Otolaryngol. 2003;4:176–195. doi: 10.1007/s10162-002-2036-8. [DOI] [PMC free article] [PubMed] [Google Scholar]
- 26.Richardson GP, Forge A, Kros CJ, Fleming J, Brown SD, Steel KP. Myosin VIIA is required for aminoglycoside accumulation in cochlear hair cells. J Neurosci. 1997;17:9506–9519. doi: 10.1523/JNEUROSCI.17-24-09506.1997. [DOI] [PMC free article] [PubMed] [Google Scholar]
- 27.Wu WJ, Sha SH, McLaren JD, Kawamoto K, Raphael Y, Schacht J. Aminoglycoside ototoxicity in adult CBA, C57BL and BALB mice and the Sprague-Dawley rat. Hear Res. 2001;158:165–178. doi: 10.1016/s0378-5955(01)00303-3. [DOI] [PubMed] [Google Scholar]
- 28.Forge A, Schacht J. Aminoglycoside antibiotics. Audiol Neurootol. 2000;5:3–22. doi: 10.1159/000013861. [DOI] [PubMed] [Google Scholar]
- 29.Boffa JJ, Arendshorst WJ. Maintenance of renal vascular reactivity contributes to acute renal failure during endotoxemic shock. J Am Soc Nephrol. 2005;16:117–124. doi: 10.1681/ASN.2004060441. [DOI] [PubMed] [Google Scholar]
- 30.Berczi I, Bertok L, Bereznai T. Comparative studies on the toxicity of Escherichia coli lipopolysaccharide endotoxin in various animal species. Canadian journal of microbiology. 1966;12:1070–1071. doi: 10.1139/m66-143. [DOI] [PubMed] [Google Scholar]
- 31.Exton MS. Infection-induced anorexia: active host defence strategy. Appetite. 1997;29:369–383. doi: 10.1006/appe.1997.0116. [DOI] [PubMed] [Google Scholar]
- 32.Studena S, Martinkova J, Slizova D, Krs O, Senkerik M, Springer D, Chladek J. A rat model of early sepsis: relationships between gentamicin pharmacokinetics and systemic and renal effects of bacterial lipopolysaccharide combined with interleukin-2. Biol Pharm Bull. 2012;35:1703–1710. doi: 10.1248/bpb.b12-00205. [DOI] [PubMed] [Google Scholar]
- 33.Lee RJ, Wang S, Turk MJ, Low PS. The effects of pH and intraliposomal buffer strength on the rate of liposome content release and intracellular drug delivery. Biosci Rep. 1998;18:69–78. doi: 10.1023/a:1020132226113. [DOI] [PubMed] [Google Scholar]
- 34.Nakamoto T, Shiba Y, Hirono C, Sugita M, Takemoto K, Iwasa Y, Akagawa Y. Carbachol-induced fluid movement through methazolamide-sensitive bicarbonate production in rat parotid intralobular ducts: quantitative analysis of fluorescence images using fluorescent dye sulforhodamine under a confocal laser scanning microscope. Eur J Cell Biol. 2002;81:497–504. doi: 10.1078/0171-9335-00261. [DOI] [PubMed] [Google Scholar]
- 35.Lin DW, Trune DR. Breakdown of stria vascularis blood-labyrinth barrier in C3H/lpr autoimmune disease mice. Otolaryngol Head Neck Surg. 1997;117:530–534. doi: 10.1016/S0194-59989770026-3. [DOI] [PubMed] [Google Scholar]
- 36.Stewart PA, Hayakawa EM. Interendothelial junctional changes underlie the developmental ‘tightening’ of the blood-brain barrier. Brain Res. 1987;429:271–281. doi: 10.1016/0165-3806(87)90107-6. [DOI] [PubMed] [Google Scholar]
- 37.Miles FP, Nuttall AL. In vivo capillary diameters in the stria vascularis and spiral ligament of the guinea pig cochlea. Hear Res. 1988;33:191–200. doi: 10.1016/0378-5955(88)90032-9. [DOI] [PubMed] [Google Scholar]
- 38.Taylor RR, Nevill G, Forge A. Rapid hair cell loss: a mouse model for cochlear lesions. J Assoc Res Otolaryngol. 2008;9:44–64. doi: 10.1007/s10162-007-0105-8. [DOI] [PMC free article] [PubMed] [Google Scholar]
- 39.Meyers JR, MacDonald RB, Duggan A, Lenzi D, Standaert DG, Corwin JT, Corey DP. Lighting up the senses: FM1-43 loading of sensory cells through nonselective ion channels. J Neurosci. 2003;23:4054–4065. doi: 10.1523/JNEUROSCI.23-10-04054.2003. [DOI] [PMC free article] [PubMed] [Google Scholar]
- 40.Calil IL, Zarpelon AC, Guerrero AT, Alves-Filho JC, Ferreira SH, Cunha FQ, Cunha TM, Verri WA., Jr Lipopolysaccharide induces inflammatory hyperalgesia triggering a TLR4/MyD88-dependent cytokine cascade in the mice paw. PLoS ONE. 2014;9:e90013. doi: 10.1371/journal.pone.0090013. [DOI] [PMC free article] [PubMed] [Google Scholar]
- 41.Juskewitch JE, Knudsen BE, Platt JL, Nath KA, Knutson KL, Brunn GJ, Grande JP. LPS-induced murine systemic inflammation is driven by parenchymal cell activation and exclusively predicted by early MCP-1 plasma levels. Am J Pathol. 2012;180:32–40. doi: 10.1016/j.ajpath.2011.10.001. [DOI] [PMC free article] [PubMed] [Google Scholar]
- 42.Bosmann M, Russkamp NF, Ward PA. Fingerprinting of the TLR4-induced acute inflammatory response. Exp Mol Pathol. 2012;93:319–323. doi: 10.1016/j.yexmp.2012.08.006. [DOI] [PMC free article] [PubMed] [Google Scholar]
- 43.MacArthur CJ, Pillers DA, Pang J, Kempton JB, Trune DR. Altered expression of middle and inner ear cytokines in mouse otitis media. Laryngoscope. 2011;121:365–371. doi: 10.1002/lary.21349. [DOI] [PMC free article] [PubMed] [Google Scholar]
- 44.Trune DR, Larrain BE, Hausman FA, Kempton JB, MacArthur CJ. Simultaneous measurement of multiple ear proteins with multiplex ELISA assays. Hear Res. 2011;275:1–7. doi: 10.1016/j.heares.2010.11.009. [DOI] [PMC free article] [PubMed] [Google Scholar]
- 45.Rivest S. Regulation of innate immune responses in the brain. Nature reviews Immunology. 2009;9:429–439. doi: 10.1038/nri2565. [DOI] [PubMed] [Google Scholar]
- 46.Allensworth JJ, Planck SR, Rosenbaum JT, Rosenzweig HL. Investigation of the differential potentials of TLR agonists to elicit uveitis in mice. J Leukoc Biol. 2011;90:1159–1166. doi: 10.1189/jlb.0511249. [DOI] [PMC free article] [PubMed] [Google Scholar]
- 47.Poltorak A, He X, Smirnova I, Liu MY, Van Huffel C, Du X, Birdwell D, Alejos E, Silva M, Galanos C, Freudenberg M, Ricciardi-Castagnoli P, Layton B, Beutler B. Defective LPS signaling in C3H/HeJ and C57BL/10ScCr mice: mutations in Tlr4 gene. Science. 1998;282:2085–2088. doi: 10.1126/science.282.5396.2085. [DOI] [PubMed] [Google Scholar]
- 48.Yang RB, Mark MR, Gray A, Huang A, Xie MH, Zhang M, Goddard A, Wood WI, Gurney AL, Godowski PJ. Toll-like receptor-2 mediates lipopolysaccharide-induced cellular signalling. Nature. 1998;395:284–288. doi: 10.1038/26239. [DOI] [PubMed] [Google Scholar]
- 49.Matt T, Ng CL, Lang K, Sha SH, Akbergenov R, Shcherbakov D, Meyer M, Duscha S, Xie J, Dubbaka SR, Perez-Fernandez D, Vasella A, Ramakrishnan V, Schacht J, Bottger EC. Dissociation of antibacterial activity and aminoglycoside ototoxicity in the 4-monosubstituted 2-deoxystreptamine apramycin. Proc Natl Acad Sci U S A. 2012;109:10984–10989. doi: 10.1073/pnas.1204073109. [DOI] [PMC free article] [PubMed] [Google Scholar]
- 50.Roy S, Ryals MM, Van den Bruele AB, Fitzgerald TS, Cunningham LL. Sound preconditioning therapy inhibits ototoxic hearing loss in mice. J Clin Invest. 2013;123:4945–4949. doi: 10.1172/JCI71353. [DOI] [PMC free article] [PubMed] [Google Scholar]
- 51.Yung MW. Intratympanic ototoxicity: influence of post-injection survival period. J Laryngol Otol. 1987;101:1011–1019. doi: 10.1017/s0022215100103159. [DOI] [PubMed] [Google Scholar]
- 52.McFadden SL, Ding D, Salvi R. Anatomical, metabolic and genetic aspects of age-related hearing loss in mice. Audiology. 2001;40:313–321. [PubMed] [Google Scholar]
- 53.Darrow DH, Keithley EM, Harris JP. Effects of bacterial endotoxin applied to the guinea pig cochlea. Laryngoscope. 1992;102:683–688. doi: 10.1288/00005537-199206000-00015. [DOI] [PubMed] [Google Scholar]
- 54.Kim CS, Kim HJ. Auditory brain stem response changes after application of endotoxin to the round window membrane in experimental otitis media. Otolaryngol Head Neck Surg. 1995;112:557–565. doi: 10.1177/019459989511200409. [DOI] [PubMed] [Google Scholar]
- 55.Henry KR, Chole RA, McGinn MD, Frush DP. Increased ototoxicity in both young and old mice. Arch Otolaryngol. 1981;107:92–95. doi: 10.1001/archotol.1981.00790380022006. [DOI] [PubMed] [Google Scholar]
- 56.McClure CL. Common infections in the elderly. Am Fam Physician. 1992;45:2691–2698. [PubMed] [Google Scholar]
- 57.Manian FA, Stone WJ, Alford RH. Adverse antibiotic effects associated with renal insufficiency. Reviews of infectious diseases. 1990;12:236–249. doi: 10.1093/clinids/12.2.236. [DOI] [PubMed] [Google Scholar]
- 58.Mathog RH, Klein WJ., Jr Ototoxicity of ethacrynic acid and aminoglycoside antibiotics in uremia. N Engl J Med. 1969;280:1223–1224. doi: 10.1056/NEJM196905292802208. [DOI] [PubMed] [Google Scholar]
- 59.Fischel-Ghodsian N. Genetic factors in aminoglycoside toxicity. Ann N Y Acad Sci. 1999;884:99–109. doi: 10.1111/j.1749-6632.1999.tb08639.x. [DOI] [PubMed] [Google Scholar]
- 60.Ryan AF, Bone RC. Potentiation of kanamycin ototoxicity by a history of noise exposure. Otolaryngology. 1978;86:ORL-125–128. doi: 10.1177/019459987808600130. [DOI] [PubMed] [Google Scholar]
- 61.Kaplanski G, Granel B, Vaz T, Durand JM. Jarisch-Herxheimer reaction complicating the treatment of chronic Q fever endocarditis: elevated TNFalpha and IL-6 serum levels. The Journal of infection. 1998;37:83–84. doi: 10.1016/s0163-4453(98)91120-3. [DOI] [PubMed] [Google Scholar]
- 62.Shenep JL, Mogan KA. Kinetics of endotoxin release during antibiotic therapy for experimental gram-negative bacterial sepsis. J Infect Dis. 1984;150:380–388. doi: 10.1093/infdis/150.3.380. [DOI] [PubMed] [Google Scholar]
- 63.Fujioka M, Okano H, Ogawa K. Inflammatory and immune responses in the cochlea: potential therapeutic targets for sensorineural hearing loss. Frontiers in pharmacology. 2014;5:287. doi: 10.3389/fphar.2014.00287. [DOI] [PMC free article] [PubMed] [Google Scholar]
- 64.Laurell G, Viberg A, Teixeira M, Sterkers O, Ferrary E. Blood-perilymph barrier and ototoxicity: an in vivo study in the rat. Acta Otolaryngol. 2000;120:796–803. doi: 10.1080/000164800750061624. [DOI] [PubMed] [Google Scholar]
- 65.Banks WA, Erickson MA. The blood-brain barrier and immune function and dysfunction. Neurobiol Dis. 2010;37:26–32. doi: 10.1016/j.nbd.2009.07.031. [DOI] [PubMed] [Google Scholar]
- 66.Driscoll KE, Hassenbein DG, Howard BW, Isfort RJ, Cody D, Tindal MH, Suchanek M, Carter JM. Cloning, expression, and functional characterization of rat MIP-2: a neutrophil chemoattractant and epithelial cell mitogen. J Leukoc Biol. 1995;58:359–364. doi: 10.1002/jlb.58.3.359. [DOI] [PubMed] [Google Scholar]
- 67.Harada A, Sekido N, Akahoshi T, Wada T, Mukaida N, Matsushima K. Essential involvement of interleukin-8 (IL-8) in acute inflammation. J Leukoc Biol. 1994;56:559–564. [PubMed] [Google Scholar]
- 68.Vandenbroucke RE, Dejonckheere E, Van Lint P, Demeestere D, Van Wonterghem E, Vanlaere I, Puimege L, Van Hauwermeiren F, De Rycke R, Mc Guire C, Campestre C, Lopez-Otin C, Matthys P, Leclercq G, Libert C. Matrix metalloprotease 8-dependent extracellular matrix cleavage at the blood-CSF barrier contributes to lethality during systemic inflammatory diseases. J Neurosci. 2012;32:9805–9816. doi: 10.1523/JNEUROSCI.0967-12.2012. [DOI] [PMC free article] [PubMed] [Google Scholar]
- 69.Palmela I, Sasaki H, Cardoso FL, Moutinho M, Kim KS, Brites D, Brito MA. Time-dependent dual effects of high levels of unconjugated bilirubin on the human blood-brain barrier lining. Frontiers in cellular neuroscience. 2012;6:22. doi: 10.3389/fncel.2012.00022. [DOI] [PMC free article] [PubMed] [Google Scholar]
- 70.Karasawa T, Wang Q, Fu Y, Cohen DM, Steyger PS. TRPV4 enhances the cellular uptake of aminoglycoside antibiotics. J Cell Sci. 2008;121:2871–2879. doi: 10.1242/jcs.023705. [DOI] [PMC free article] [PubMed] [Google Scholar]
- 71.Fian R, Grasser E, Treiber F, Schmidt R, Niederl P, Rosker C. The contribution of TRPV4-mediated calcium signaling to calcium homeostasis in endothelial cells. Journal of receptor and signal transduction research. 2007;27:113–124. doi: 10.1080/10799890701402446. [DOI] [PubMed] [Google Scholar]
- 72.Jiang M, Wang Q, Karasawa T, Koo JW, Li H, Steyger PS. Sodium-glucose transporter-2 (SGLT2; SLC5A2) enhances cellular uptake of aminoglycosides. PLoS ONE. 2014;9:e108941. doi: 10.1371/journal.pone.0108941. [DOI] [PMC free article] [PubMed] [Google Scholar]
- 73.Shi W, Cui N, Wu Z, Yang Y, Zhang S, Gai H, Zhu D, Jiang C. Lipopolysaccharides up-regulate Kir6.1/SUR2B channel expression and enhance vascular KATP channel activity via NF-kappaB-dependent signaling. J Biol Chem. 2010;285:3021–3029. doi: 10.1074/jbc.M109.058313. [DOI] [PMC free article] [PubMed] [Google Scholar]
- 74.Sakagami M, Harada T, Sano M, Sakai S, Matsunaga T. Quantitative evaluation of pinocytosis of capillaries of the stria vascularis under normal and experimental conditions. Acta Otolaryngol. 1987;103:189–197. [PubMed] [Google Scholar]
- 75.Tiruppathi C, Shimizu J, Miyawaki-Shimizu K, Vogel SM, Bair AM, Minshall RD, Predescu D, Malik AB. Role of NF-kappaB-dependent caveolin-1 expression in the mechanism of increased endothelial permeability induced by lipopolysaccharide. J Biol Chem. 2008;283:4210–4218. doi: 10.1074/jbc.M703153200. [DOI] [PMC free article] [PubMed] [Google Scholar]
- 76.Schacht J, Lodhi S, Weiner ND. Effects of neomycin on polyphosphoinositides in inner ear tissues and monomolecular films. Adv Exp Med Biol. 1977;84:191–208. doi: 10.1007/978-1-4684-3279-4_9. [DOI] [PubMed] [Google Scholar]
- 77.Van Bambeke F, Mingeot-Leclercq MP, Schanck A, Brasseur R, Tulkens PM. Alterations in membrane permeability induced by aminoglycoside antibiotics: studies on liposomes and cultured cells. Eur J Pharmacol. 1993;247:155–168. doi: 10.1016/0922-4106(93)90073-i. [DOI] [PubMed] [Google Scholar]
- 78.Moore RD, Smith CR, Lietman PS. Risk factors for the development of auditory toxicity in patients receiving aminoglycosides. J Infect Dis. 1984;149:23–30. doi: 10.1093/infdis/149.1.23. [DOI] [PubMed] [Google Scholar]
- 79.Henry KR, Guess MB, Chole RA. Hyperthermia increases aminoglycoside ototoxicity. Acta Otolaryngol. 1983;95:323–327. doi: 10.3109/00016488309130949. [DOI] [PubMed] [Google Scholar]
- 80.Zager RA. Endotoxemia, renal hypoperfusion, and fever: interactive risk factors for aminoglycoside and sepsis-associated acute renal failure. Am J Kidney Dis. 1992;20:223–230. doi: 10.1016/s0272-6386(12)80694-9. [DOI] [PubMed] [Google Scholar]
- 81.Oh GS, Kim HJ, Choi JH, Shen A, Kim CH, Kim SJ, Shin SR, Hong SH, Kim Y, Park C, Lee SJ, Akira S, Park R, So HS. Activation of lipopolysaccharide-TLR4 signaling accelerates the ototoxic potential of cisplatin in mice. J Immunol. 2011;186:1140–1150. doi: 10.4049/jimmunol.1002183. [DOI] [PubMed] [Google Scholar]
- 82.Nicol KM, Hackney CM, Evans EF, Pratt SR. Behavioural evidence for recovery of auditory function in guinea pigs following kanamycin administration. Hear Res. 1992;61:117–131. doi: 10.1016/0378-5955(92)90042-l. [DOI] [PubMed] [Google Scholar]
- 83.Chen L, Xiong S, Liu Y, Shang X. Effect of different gentamicin dose on the plasticity of the ribbon synapses in cochlear inner hair cells of C57BL/6J mice. Mol Neurobiol. 2012;46:487–494. doi: 10.1007/s12035-012-8312-7. [DOI] [PubMed] [Google Scholar]
- 84.Liu K, Chen D, Guo W, Yu N, Wang X, Ji F, Hou Z, Yang WY, Yang S. Spontaneous and Partial Repair of Ribbon Synapse in Cochlear Inner Hair Cells After Ototoxic Withdrawal. Mol Neurobiol. 2014 doi: 10.1007/s12035-014-8951-y. [DOI] [PubMed] [Google Scholar]
- 85.Oesterle EC. Changes in the adult vertebrate auditory sensory epithelium after trauma. Hear Res. 2013;297:91–98. doi: 10.1016/j.heares.2012.11.010. [DOI] [PMC free article] [PubMed] [Google Scholar]
- 86.Campbell KC, Meech RP, Klemens JJ, Gerberi MT, Dyrstad SS, Larsen DL, Mitchell DL, El-Azizi M, Verhulst SJ, Hughes LF. Prevention of noise- and drug-induced hearing loss with D-methionine. Hear Res. 2007;226:92–103. doi: 10.1016/j.heares.2006.11.012. [DOI] [PubMed] [Google Scholar]
- 87.Sun AH, Parnes LS, Freeman DJ. Comparative perilymph permeability of cephalosporins and its significance in the treatment and prevention of suppurative labyrinthitis. Ann Otol Rhinol Laryngol. 1996;105:54–57. doi: 10.1177/000348949610500109. [DOI] [PubMed] [Google Scholar]
- 88.Kilkenny C, Browne WJ, Cuthill IC, Emerson M, Altman DG. Improving bioscience research reporting: the ARRIVE guidelines for reporting animal research. PLoS biology. 2010;8:e1000412. doi: 10.1371/journal.pbio.1000412. [DOI] [PMC free article] [PubMed] [Google Scholar]
Associated Data
This section collects any data citations, data availability statements, or supplementary materials included in this article.
Supplementary Materials
Fig. S1. LPS treatment enhances cochlear lateral wall uptake of GTTR. (A) In DPBS-treated mice treated with GTTR for 1 hour prior to fixation, absolute GTTR fluorescence is greater in marginal cells, with decreasing levels of fluorescence in intra-strial layers and basal cells, with a substantial drop in spiral ligament fibrocytes. Strial levels of fluorescence were significantly greater for each ROI in basal segments compared to apical segments (P<0.01; parametric paired t-test). In LPS-treated mice, GTTR uptake in strial cells and the spiral ligament was dose-dependently increased with LPS doses greater than 1 mg/kg. The rank order of fluorescence intensity in individual cell types (marginal cells > intra-strial layer > basal cells ≫ spiral ligament) was generally maintained with increasing LPS dose, although more variable degrees of statistical significance were observed with increasing LPS dose and time of GTTR exposure (Wilcoxon signed rank test; *P<0.05; **P<0.01; ***P<0.005; error bars = s.e.m.; N in Table S1). (B) Intensity analysis of GTTR fluorescence in lateral wall cells after treatment with different doses of LPS (relative to DPBS-treated mice). GTTR fluorescence is increasingly elevated in marginal cells, intra-strial tissues (excluding capillary structures), basal cells and spiral ligament fibrocytes with increasing LPS dose at 1 and 3 hours after GTTR injection. In the basal coil, every cell type examined at 1 hour after GTTR injection showed significantly increased fluorescence at 1 mg/kg LPS or higher (Wilcoxon signed rank test; *P<0.05; **P<0.01; ***P<0.005; error bars = s.e.m.; N in Table S1). Strial and spiral ligament fluorescence was significantly greater in basal segments compared to apical segments for each ROI (P<0.01; parametric paired t-test).
Fig. S2. OHC uptake of GTTR is accelerated by LPS exposure. (A) In cochlear OHCs, 24 hours after treatment with 1 mg/kg LPS and 1 hour after exposure to GTTR, confocal images of OHCs in basal coils show increased GTTR uptake compared to OHCs from DPBS-treated mice. Increases in GTTR fluorescence were not as apparent at 3 hours post-GTTR injection. Scale bar = 50 μm. (B) Intensity analysis of GTTR fluorescence in cochlear OHCs after treatment with different doses of LPS (relative to the fluorescence in OHCs at 1 hour) for apical or basal coils. In apical coils, LPS did not consistently modulate GTTR uptake 1 hour after GTTR injection, but trended to significance 3 hours after GTTR injection at higher doses of LPS (> 1 mg/kg). In basal coils, GTTR fluorescence was most consistently and significantly elevated 1 hour after GTTR injection, and trended to significance only at higher doses of LPS (>2.5 mg/kg LPS) 3 hours after GTTR injection (*P<0.05, **P<0.01, ***P<0.001).
Fig. S3. Renal uptake of GTTR is reduced only at high doses of LPS. (A) In DPBS-treated mice at 3 hours after injection with GTTR, intensely-labeled puncta of GTTR fluorescence is localized near brush border microvilli (arrowheads) and diffusely distributed throughout the cytoplasm of proximal tubule cells (p). Note the weaker intensity of GTTR fluorescence in distal tubule cells (d). (B) In LPS-treated mice at 3 hours after injection with GTTR, the intensity of diffuse cytoplasmic GTTR fluorescence in proximal tubule cells is visibly decreased compared to DPBS-treated mice (A). Note also the visible reduction in GTTR-labeled puncta in proximal tubule cells, and negligible fluorescence in the glomerulus (g). Scale bar = 50 μm. (C) The intensity of GTTR fluorescence in proximal tubule cells in mice treated with different doses of LPS. Only in mice treated with 10 mg/kg LPS is a significant reduction in GTTR fluorescence observed, at either 1 or 3 hours after GTTR injection (Student’s t-test; *P<0.05; ***P<0.001).
Fig. S4. LPS induces acute anorexia. (A) After 24 hours, LPS-treated C57BL/6 mice exhibited significant weight loss (~10%) compared to DPBS-treated C57BL/6 mice (Acute; N=32/cohort). LPS-treated C57BL/6 mice (±kanamycin) used in chronic toxicity experiments (Chronic, N as in Fig. 7) also displayed significant weight loss at 24 hours compared to DPBS-treated mice (±kanamycin). Over time, LPS-treated mice (±kanamycin) regained weight, with weights comparable to DPBS-treated mice (±kanamycin) by day 5. (B) LPS-treated C3H/HeOuJ mice also displayed significant weight loss 24 hours after LPS injection compared to DPBS-treated C3H/HeOuJ mice (N = 12 for DPBS, 13 for LPS). LPS-treated C3H/HeJ mice displayed attenuated weight loss 24 hours after LPS injection compared to LPS-treated C3H/HeOuJ mice (unpaired, two-tailed t-test; error bars=s.d.; ***P<0.001).
Fig. S5. LPS does not alter BLB permeability, yet vasodilates apical strial capillaries. (A) Twenty-five hours after LPS, and 1 hour after hTR injection, the absolute mean intensities of hTR fluorescence in marginal cell (MC), intra-strial tissue (IS), basal cell (BC) and spiral ligament (SL) fibrocytes layers from P6 pups are significantly elevated compared to lateral wall ROIs in adult mice. There was no difference in fluorescence of lateral wall ROIs from DPBS- or LPS-treated adult mice (***P< 0.001, 2-way ANOVA with Bonferroni post-hoc tests). (B) After chronic treatment with kanamycin (±LPS), the absolute mean intensities of hTR fluorescence in lateral wall ROIs from P6 pups were significantly elevated compared to those in adult mice. There was no difference in hTR fluorescence of lateral wall ROIs from DPBS-, LPS-, kanamycin- or LPS+kanamycin-treated adult mice (***P<0.001; N=6 cochleae/group; error bars=s.d.; 2-way ANOVA with Bonferroni post-hoc tests). (C) Twenty-five hours after LPS, a subpopulation of apical strial capillaries were dilated compared to DPBS-treated mice (see also Table 1), resulting in a bimodal distribution. A Gaussian regression curve fit was applied to obtain the bimodal peak means in Table 1.
Fig. S6. Serum serotonin, but not histamine, levels were decreased with increasing doses of LPS. (A) Serum histamine levels were not statistically affected by increasing doses of LPS, nor show a trend. (B) Serum serotonin levels were significantly decreased at all LPS doses compared to DPBS-treated mice (0 LPS; *P<0.05, **P<0.001). The Mann-Whitney U test was used to test for differences between groups.
Fig. S7. TLR4-mediated inflammatory markers are modulated by LPS. (A) Twenty-four hours after 1 mg/kg LPS injection, plasma levels of most acute phase inflammatory proteins in C57BL/6 mice were not significantly different (or below the limit of detection indicated by the dashed line) compared to DPBS-treated C57BL/6 mice, except for IL-6 and MIP-1α. (B) Twenty-four hours after LPS injection, plasma levels of all tested acute phase inflammatory proteins in C3H/HeOuJ mice were not significantly different (or below the limit of detection) compared to DPBS-treated C3H/HeOuJ mice. (C) Twenty-four hours after 1 mg/kg LPS injection, plasma levels of all tested acute phase inflammatory proteins in C3H/HeJ mice were not significantly different (or below the limit of detection) compared to DPBS-treated C3H/HeJ mice. (For A–C: N=4/cohort, measured in duplicate; error bars = 95% CI derived from Student’s t-tests; *significant difference compared to DPBS-treated mice of the same strain after a 1-way unpaired Student’s t-test at the 95% CI.) (D) Twenty-four hours after 1 mg/kg LPS injection, cochlear concentrations of tested inflammatory proteins from C57BL/6 mice were all significantly elevated above baseline levels in DPBS-treated C57BL/6 mice, with the greatest changes observed for IL-6, IL-8, MIP-1α and MIP-2α. (E) In cochleae from C3H/HeOuJ mice, all acute phase pro-inflammatory proteins were significantly elevated 24 hours after LPS injection compared to DPBS-treated C3H/HeOuJ mice, except for IL-10. (F) In TLR4-hyporesponsive cochleae from C3H/HeJ mice 24 hours after LPS injection, only a subset of acute phase inflammatory markers (TNFα, IL-1α, IL-6, IL-8, IL-10, and MIP-1α) were significantly elevated compared to DPBS-treated C3H/HeJ mice. (For D–F: N=4/cohort; 6 cochleae pooled from 3 mice/sample, measured in triplicate; error bars = 95% CI derived from Student’s t-tests; *significant difference compared to DPBS-treated mice of the same strain after a one-way unpaired Student’s t-test at the 95% CI.) (G, H) When cochlear mRNA levels in C57BL/6 (G) and C3H/HeOuJ (H) mice were assayed, significant increases were observed in Il-1α, Il-6, Il-8, Il-10, Mip-1α and Mip-2α mRNA 24 hours after LPS injection compared to DPBS-treated mice of the same strain, and for Tnfα in C3H/HeOuJ mice. (I) In C3H/HeJ mice, LPS significantly increased anti-inflammatory Il-10 mRNA levels 24 hours after LPS injection, but not for any pro-inflammatory markers. (For G–I: N=4/cohort; 2 cochleae from 1 mouse/sample, measured in triplicate; error bars = 95% CI derived from Student’s t-tests; *significant difference is noted if the 95% CI does not overlap with 1).
Fig. S8. LPS-induced GTTR uptake by cochlear lateral wall cells in control C3H/HeOuJ and TLR4-hyporesponsive C3H/HeJ mice. (A) The fluorescence intensity of GTTR in marginal cells (MC), intermediate cells (IC), and basal cells (BC) of the stria vascularis, as well as spiral ligament fibrocytes (FC), were significantly greater in LPS-treated C3H/HeOuJ mice (□) over DPBS-treated C3H/HeOuJ mice (○). (B) The fluorescence intensity of GTTR in strial marginal, intermediate and basal cells, as well as spiral ligament fibrocytes were increased in LPS-treated C3H/HeJ mice (□) over DPBS-treated C3H/HeJ mice (○). However, the LPS-induced increase in GTTR fluorescence was only significant for intermediate and basal cells (unpaired t-test 1-way; *P<0.05; N=4; error bars = 95% CI derived from Student’s t-tests).
Fig. S9. Absolute ABR thresholds are elevated by chronic kanamycin, or kanamycin plus LPS, dosing. Absolute ABR thresholds for each ear of C57BL/6 mice (in gray) in each group, at stated time points before or after LPS and/or kanamycin treatment, with age-matched controls (DPBS-treated). Black line indicates the group mean (±s.d.). Note the general elevation in thresholds at 1.5 and 3 weeks post-treatment for mice treated with both LPS and kanamycin (bottom right panel) compared to age-matched DPBS-only or LPS-only treated mice (bottom row, two left panels).
Fig. S10. Threshold shifts induced by chronic kanamycin, or kanamycin plus LPS, dosing. ABR threshold shifts for each ear of C57BL/6 mice (in gray) in each group, at stated time points after LPS and/or kanamycin treatment, with age-matched controls (DPBS). Black line indicates the group mean (±s.d.). Note the general elevation in individual and mean threshold shifts at 1.5 and 3 weeks post-treatment for mice treated with both LPS and kanamycin (lower two extreme right panels) compared to age-matched mice in other groups (bottom two rows, leftmost panels).
Fig. S11. Effect of chronic kanamycin treatment, with or without LPS, on ABRs, OHC survival and BLB permeability. C57BL/6J mice were treated as described in the text (see fig. S17). One day post-treatment (A), kanamycin (N=5) and LPS+kanamycin (N=6) induced significant threshold shifts at 16, 24 and 32 kHz compared to DPBS- (N=4) and LPS-treated (N=5) control mice. LPS+kanamycin also induced significant threshold shifts at 12 kHz compared to controls (table S3). Ten days post-treatment (B), threshold shifts for kanamycin-treated mice were no longer significantly different from DPBS- and LPS-treated mice (table S4). LPS+kanamycin induced significant threshold shifts at 4, 12, 16, 24 and 32 kHz compared to DPBS-treated mice, and at all frequencies compared to LPS-treated mice (table S4). LPS+kanamycin also induced significant threshold shifts at 16, 24 and 32 kHz compared to kanamycin-treated mice (table S4). Three weeks post-treatment (C), kanamycin induced a significant PTS only at 32 kHz compared to DPBS-treated mice (table S5). LPS+kanamycin induced significant PTS at 16, 24 and 32 kHz frequencies compared to kanamycin-, DPBS- and LPS-treated mice; and also at 12 kHz compared to DPBS- and LPS-treated mice, as well as LPS-only mice at 8 kHz (table S5). Error bars=s.d. Data in A–C are from the same mice and correspond to Fig. 7A,B and P values in tables S3–S5. (D) Immediately after chronic treatment, kanamycin (N=5) induced significant threshold shifts at 4, 24 and 32 kHz compared to DPBS-treated (N=5) mice, and at 24 and 32 kHz compared to LPS-treated (N=6) mice. LPS+kanamycin (N=7) induced significant threshold shifts at 16, 24 and 32 kHz compared to DPBS-only mice; and at 24 and 32 kHz compared to LPS-only mice (table S6). LPS+kanamycin did not induce significantly different threshold shifts at any frequency compared to kanamycin-treated mice (table S6). Error bars=s.d. Data in D correspond to fig S11E,F and P values in table S6. (E) Immediately after chronic treatment, kanamycin-treated mice exhibited greater OHC loss in the basal 32–64 kHz region of the cochlea compared to DPBS- and LPS-treated mice, but this was not significant (table S8). LPS+kanamycin-treated mice had substantially greater OHC loss over a wider frequency range compared to the kanamycin-only group, as well as DPBS- and LPS-only mice that was statistically significant in the 23–64 kHz region (see also fig. S12; table S8). In the more apical 8–16 kHz region, 2 mice in the LPS+kanamycin-treated group exhibited almost total OHC loss, while the remaining 4 mice had negligible OHC loss, contributing to increased error and lack of significance (table S8). Mean cochlear length = 6.49 (±2.6, s.d.) mm. Error bars=95% CI derived from Student’s t-tests. (F) The relative mean intensities of hTR fluorescence in marginal cell (MC), intra-strial tissue (IS), basal cell (BC) and spiral ligament (SL) fibrocyte layers from P6 pups are significantly elevated compared to adult mice. There was no difference in hTR fluorescence of lateral wall ROIs from DPBS-, LPS-, kanamycin or LPS+kanamycin-treated adult mice (***P<0.005; N=6 cochleae/group; error bars=s.d.; 2-way ANOVA with Bonferroni post-hoc tests).
Fig. S12. Absolute ABRs, threshold shifts and weight changes induced by chronic LPS, kanamycin, or LPS+kanamycin in C57BL/6 mice. (A) Absolute ABR thresholds for individual ears (in gray) by group prior to treatment, and one day post-treatment with chronic exposure to LPS and/or kanamycin, with age-matched controls (DPBS-treated). Black line indicates the group mean (±s.d.). (B) ABR threshold shifts for individual ears (in gray) by group, one day post-treatment with chronic exposure to LPS and/or kanamycin, with age-matched controls (DPBS-treated). (C) Twenty-four hours after each LPS treatment on day 0, day 5 or day 10, LPS-treated mice exhibited substantial weight loss (~10%) compared to DPBS-treated C57BL/6 mice). Over time, mice generally regained weight after LPS treatment (±kanamycin) with weights comparable to DPBS-treated mice (±kanamycin) after 5 days.
Fig. S13. Acute LPS-induced endotoxemia does not alter ABR thresholds. (A, B) Baseline ABR thresholds prior to i.v. injection with DPBS or 1 mg/kg LPS (4 C57BL/6 mice/group; 2 ears/mouse; each mouse identified by individual color; left ears ■; right ears ▲). (C, D) ABR thresholds 24 hours after injection with DPBS or 1 mg/kg LPS; no obvious changes were observed. (E, F) Threshold shifts from baseline for each ear 24 hours after injection with DPBS or 1 mg/kg LPS. (G) Group mean threshold shifts (±s.d.) of mice pre-treated 24 hours earlier with either DPBS or 1 mg/kg LPS. No statistically significant threshold shifts were observed within each group or between groups (N=4 mice per group).
Fig. S14. Schematic displaying potential mechanisms for aminoglycoside trafficking across the BLB. Two possible mechanisms of paracellular flux include immune cell-mediated, or immune cell-independent, breakdown of tight junction-coupling between endothelial cells. Transcellular flux of hydrophilic, cationic aminoglycosides include permeation of non-selective cation channels, translocation via substrate transporters, transcytosis through the cell, and/or diffusion across the hydrophobic plasma membrane. Not to scale, and adapted from (15).
Fig. S15. Acute LPS and aminoglycoside dosing paradigm. Different doses of LPS were injected i.v., and 24 hours later, GTTR, gentamicin or hTR was injected i.p. Control C57BL/6 mice received an i.v. injection of DPBS. Mice were sacrificed 1 or 3 hours after aminoglycoside injection.
Fig. S16. ELISA and qRT-PCR experimental designs for 6 and 24 hour LPS exposures. (A) 6 hour. Sixteen C57BL/6 mice per group. Control mice received an i.v. tail vein injection of DPBS at 0 hours, then an i.p. injection of DPBS at 3 hours. At the same time points, a second group received DPBS i.v. followed by gentamicin i.p.; a third group received 1 mg/kg LPS i.v., followed by DPBS i.p.; the fourth group received LPS i.v. and, 3 hours later, gentamicin i.p. Gentamicin was administered at a dose of 300 mg/kg. At 6 hours, all mice were sacrificed, and both cochleae plus a blood sample collected. Cochleae from 10 mice were used for ELISA protein quantification (4 cochleae/sample; N=5); while cochleae from 6 mice were used for mRNA extraction and real-time quantitative RT-PCR (qRT-PCR; 4 cochleae/sample; N=3). (B) 24 hour. Sixteen mice per group, with two groups (1 mg/kg LPS, or vehicle control DPBS) per mouse strain C57B/l6, C3H/HeOuJ (strain control) and C3H/HeJ (TLR4-hyporesponsive). All mice received an i.v. tail vein injection of DPBS or LPS at 0 hours. At the 24 hour time point, all mice were sacrificed, and both cochleae plus a blood sample collected. Cochleae from 12 mice per group (6 cochleae/sample; N=4) were used for ELISA protein quantification; while cochleae from 4 mice per group (2 cochleae/sample; N=4) were used for RNA extraction and real-time qRT-PCR.
Fig. S17. Chronic LPS-induced endotoxemia and kanamycin ototoxicity protocol. For toxicity studies, mice were divided into 4 groups, (i) DPBS only; (ii) LPS only; (iii) kanamycin only and (iv) LPS+kanamycin. Mice received 700 mg/kg kanamycin (or DPBS) subcutaneously twice daily for consecutive 14 days. Auditory brainstem responses (ABRs) to pure tones were obtained prior to LPS and kanamycin dosing, and also 1, 10 and 21 days after cessation of kanamycin dosing to determine any threshold shifts following LPS and/or kanamycin administration compared to age-matched controls (i.e., DPBS- or LPS-only groups). Mice received 1 mg/kg LPS (or DPBS) 1 day prior to kanamycin treatment, and on the 5th and 10th day during kanamycin treatment (2 additional injections).
Table S1. Number of mice in each condition for Figs. 1, 2A and fig. S1. * GTTR was i.p. injected 24 hours after i.v. injection of LPS or DPBS.
Table S2. Probability of significant difference in GTTR serum levels for Fig. 2A. Serum levels of GTTR were significantly elevated in 2.5 and 10 mg/kg LPS-treated mice compared to DPBS-treated controls (0 mg/ml LPS). Serum levels of GTTR in the 2.5 mg/kg LPS group were significantly higher than 0.1 and 1 mg/kg groups both at 1 hour and 3 hour time points (Mann-Whitney U test).
Table S3. Probability of a significant difference in threshold shifts one day after chronic LPS-induced endotoxemia with or without kanamycin treatment. One day following chronic exposure to LPS±kanamycin (see fig. S17), ABR threshold shifts from baseline were obtained (fig. S10A). Threshold shifts for DPBS-only mice (N=4) were not different from LPS-treated mice (N=5). Kanamycin alone (N=5) induced significant threshold shifts at 16, 24 and 32 kHz compared to DPBS- and LPS-treated mice. Mice that received LPS+kanamycin (N=6) had significant threshold shifts at 12, 16, 24 and 32 kHz frequencies compared to DPBS- and LPS-treated mice. Mice receiving LPS+kanamycin did not have significant threshold shifts at any frequency compared to kanamycin-treated mice. *P<0.05, **P<0.01; ***P<0.001; 2-way ANOVA with Bonferroni post-hoc tests. Statistical analyses correspond to data in figs. S9, S10 and S11A.
Table S4. Probability of a significant difference in threshold shifts 1.5 weeks after chronic LPS-induced endotoxemia with or without kanamycin treatment. One and a half weeks following chronic exposure to LPS±kanamycin (see fig. S13), ABR threshold shifts from baseline were obtained (fig. S10B). Threshold shifts for DPBS-only mice (N=4) were not different from LPS-treated mice (N=5). Kanamycin alone (N=5) induced negligible threshold shifts compared to DPBS- and LPS-treated mice. Mice that received LPS+kanamycin (N=6) had significant threshold shifts at 4, 12, 16, 24 and 32 kHz frequencies compared to DPBS-treated mice, and at 4, 8, 12, 16, 24 and 32 kHz compared to LPS-treated mice. Mice receiving LPS+kanamycin also had significant threshold shifts at 16, 24 and 32 kHz compared to kanamycin-treated mice. *P<0.05, **P<0.01; ***P<0.001; 2-way ANOVA with Bonferroni post-hoc tests. Statistical analyses correspond to data in figs. S9, S10 and S11B.
Table S5. Probability of a significant difference in threshold shifts 3 weeks after chronic LPS-induced endotoxemia with or without kanamycin treatment. Three weeks after chronic LPS exposure (3× 1 mg/kg LPS i.v., 5 days apart) ±kanamycin (700 mg/kg, 2x daily for 14 days, see fig. S17), ABR threshold shifts from baseline were determined (Fig. 7C, and fig. S11C). Threshold shifts for DPBS-only mice (N=4) were not different from LPS-treated mice (N=5). Kanamycin alone (N=5) induced a significant PTS at only 32 kHz compared to LPS- and DPBS-treated mice. Mice that received LPS+kanamycin (N=6) had significant PTS at 16, 24 and 32 kHz compared to kanamycin-only, as well as DPBS-only and LPS-only mice. Mice receiving LPS+kanamycin also significant PTS at 12 kHz compared to DPBS- and LPS-only mice, as well as LPS-only mice at 8 kHz. *P<0.05, **P<0.01; 2-way ANOVA with Bonferroni post-hoc tests. Statistical analyses correspond to data presented in Fig. 7A,B, and figs. S9, S10 and. S11C.
Table S6. Probability of a significant difference in threshold shifts immediately after chronic LPS-induced endotoxemia with or without kanamycin treatment. Immediately following chronic exposure to LPS±kanamycin (see fig. S17), ABR threshold shifts from baseline were obtained (fig. S10D). ABR threshold shifts for the DPBS-only mice (N=5) were not different from LPS-treated mice (N=6). Kanamycin alone (N=5) induced significant threshold shifts at 4, 24 and 32 kHz compared to DPBS-treated mice, and at 24 and 32 kHz compared to LPS-treated mice. Mice that received LPS+kanamycin (N=7) had significant threshold shifts at 16, 24 and 32 kHz frequencies compared to DPBS-only mice; with significant threshold shifts at 24 and 32 kHz compared to LPS-only mice. Mice receiving LPS+kanamycin did not have significant threshold shifts at any frequency compared to kanamycin-treated mice. *P<0.05, **P<0.01; ***P<0.001; 2-way ANOVA with Bonferroni post-hoc tests. Statistical analyses correspond to data presented in fig. S11D–F and S12.
Table S7. Probability of a significant difference in OHC survival 3 weeks after chronic LPS-induced endotoxemia with or without kanamycin treatment. Three weeks following chronic exposure to LPS (±kanamycin), cytocochleograms of OHCs were obtained (Fig. 7B). No significant differences in OHC survival occurred between DPBS-, LPS-, kanamycin- and LPS+kanamycin-treated groups in the more apical, lower frequency (4–8 kHz) regions of the mouse cochlea. Substantial losses of OHCs occurred in higher frequency (8–64 kHz) regions of LPS+kanamycin-treated cochleae that were significantly different from DPBS-, LPS- and kanamycin-treated groups. LPS+kanamycin also induced significant IHC loss only in the 16–32 kHz region compared to DPBS-, LPS-, and kanamycin-treated mice (P<0.05, P<0.05 and P<0.01, respectively). 2-way ANOVA using Tukey post-hoc tests; **P<0.01, ****P<0.0001. Statistical analyses correspond to cytocochleogram data presented in Fig. 7B.
Table S8. Probability of a significant difference in OHC survival immediately after chronic LPS-induced endotoxemia with or without kanamycin treatment. Immediately following chronic exposure to LPS (±kanamycin), cytocochleograms of OHCs were obtained (fig. S11E). No significant differences in OHC survival occurred between DPBS-, LPS-, kanamycin- and LPS+kanamycin-treated groups in apical, lower frequency (4–16 kHz) regions of the cochlea. Substantial loss of OHCs occurred in basal high frequency regions of LPS+kanamycin-treated cochleae that were significantly different from DPBS-, LPS- and kanamycin-treated groups. LPS+kanamycin also induced significant IHC loss only in at 32 kHz compared to DPBS- and LPS-treated mice, but not at any other frequency or with kanamycin treated mice (P<0.01 and P<0.05, respectively). 2-way ANOVA with Tukey post-hoc tests; ***P<0.001, ****P<0.0001. Statistical analyses correspond to cytocochleogram data in fig. S11E.
Table S9. Probability of decreasing OHC survival 3 weeks after chronic LPS-induced endotoxemia with or without kanamycin treatment compared to immediately after treatment. The mean OHC survival (±s.d.) per frequency region immediately after, and 3 weeks following, chronic exposure to LPS±kanamycin (see cytocochleograms in Fig. 7B, and fig. S11E) are shown. Three weeks after treatment, significantly greater OHC loss was observed in LPS+kanamycin treated mice in 8–64 kHz regions of the cochlea compared to immediately after chronic treatment. Three weeks after kanamycin treatment, significantly greater hair cell loss was only observed in the 16–32 kHz region. LPS- and DPBS-treated mice also had significant OHC loss in the 32–64 kHz region compared to 3 weeks earlier. LPS also induced significant IHC loss only in the 32–64 kHz region (P<0.05) compared to all other groups. All analyses done using Student’s t-test; *P<0.05, **P<0.01; ****P<0.0001. Statistical analyses correspond to cytocochleogram data in Fig. 7B and fig. S11E.