

Abstract
Background
Screening for colorectal cancer (CRC) and precancerous colorectal adenoma (CRA) can detect curable disease. However, participation in colonoscopy and sensitivity of fecal heme for CRA are low.
Methods
Microbiota metrics were determined by Illumina sequencing of 16S rRNA genes amplified from DNA extracted from feces self-collected in RNAlater. Among fecal immunochemical test-positive (FIT +) participants, colonoscopically-defined normal versus CRA patients were compared by regression, permutation, and random forest plus leave-one-out methods.
Findings
Of 95 FIT + participants, 61 had successful fecal microbiota profiling and colonoscopy, identifying 24 completely normal patients, 20 CRA patients, 2 CRC patients, and 15 with other conditions. Phylum-level fecal community composition differed significantly between CRA and normal patients (permutation P = 0.02). Rank phylum-level abundance distinguished CRA from normal patients (area under the curve = 0.767, permutation P = 0.006). CRA prevalence was 59% in phylum-level cluster B versus 20% in cluster A (exact P = 0.01). Most of the difference reflected 3-fold higher median relative abundance of Proteobacteria taxa (Wilcoxon signed-rank P = 0.03, positive predictive value = 67%). Antibiotic exposure and other potential confounders did not affect the associations.
Interpretation
If confirmed in larger, more diverse populations, fecal microbiota analysis might be employed to improve screening for CRA and ultimately to reduce mortality from CRC.
Keywords: Feces, Microbiota, Colorectal cancer, Colorectal adenoma, Cancer screening, China
Highlights
-
•
Fecal microbiota composition differed for patients with colorectal adenoma compared to normals.
-
•
Most of the difference reflected 3-fold higher abundance of Proteobacteria in patients with adenoma.
-
•
Population-wide microbiota screening is feasible and, if validated, could complement established early-detection programs.
1. Introduction
Screening the general adult population for colorectal cancer (CRC) and precancerous colorectal adenoma (CRA) can detect curable disease and reduce mortality. However, all the screening methods in current use have substantial limitations (Kuipers et al., 2013, Lieberman, 2014). Screening by colonoscopy or detection of fecal occult blood greatly reduces long-term CRC mortality (Zauber et al., 2012), but at least half of CRC mortality in the U.S.A. can be attributed to avoidance of screening (Meester et al., 2015). Colonoscopy, the primary modality used in the U.S.A., is costly and invasive, and its efficacy depends on the endoscopist's skill and the patient's bowel preparation. Computed tomographic colonography has different challenges, and the requirement to pursue detected lesions with colonoscopy limits its use for primary screening (Kuipers et al., 2013). Detecting occult blood in feces, particularly with the fecal immunochemical test (FIT) for human hemoglobin, has reasonable acceptability, cost, and accuracy for detecting CRC (single-test sensitivity, 60%–85%; specificity, > 90%) (Lieberman, 2014). Improving the predictive value of a positive FIT (FIT +) with molecular analyses of feces or serum is a high priority (Ahlquist et al., 2012, Carmona et al., 2013, Goedert et al., 2014b, Imperiale et al., 2014, Kuipers et al., 2013, Lieberman, 2014), especially because the sensitivity of FIT for CRA is less than 50% and because many FIT + patients decline follow-up colonoscopy (Lieberman, 2014).
Research on differences or alterations in the distal gut microbiota has focused on the pathogenesis of CRC (Collins et al., 2011, Schwabe and Jobin, 2013, Sears and Pardoll, 2011, Tjalsma et al., 2012), and such differences may ultimately prove to be helpful for screening. Comprehensive comparisons of the fecal microbiota have been reported by four studies, totaling 176 CRC cases and 241 controls (Ahn et al., 2013, Wang et al., 2012, Weir et al., 2013, Wu et al., 2013, Zeller et al., 2014). Four of these studies reported that butyrate-producing bacteria were significantly less abundant in feces from CRC cases compared to controls, although the particular taxa varied. In addition, the three larger studies reported that CRC cases had significantly higher carriage or abundance of potentially pathogenic Fusobacteria and Proteobacteria (Ahn et al., 2013, Wang et al., 2012, Zeller et al., 2014). Similar or different bacteria may contribute to the CRA stage of neoplasia (Tjalsma et al., 2012), and data to address this hypothesis are starting to emerge. Abundance of several bacterial taxa was reported to differ in rectal mucosa of CRA cases compared to healthy controls (McCoy et al., 2013, Mira-Pascual et al., 2014, Sanapareddy et al., 2012, Shen et al., 2010), including two studies in which well characterized cases' unaffected mucosa had higher levels of Proteobacteria taxa than did the controls' mucosa (Mira-Pascual et al., 2014, Shen et al., 2010).
With fecal DNA, Chen and colleagues reported that the overall composition of the microbiota differed between 47 CRA cases and 47 colonoscopically normal, age- and sex-matched controls (Chen et al., 2013). Nominally significant differences in relative abundance, not adjusted for multiple comparisons, were reported for six bacterial genera — two increased (Enterococcus and Streptococcus) and four decreased (Bacteroides, Clostridium, Roseburia, and Eubacterium) in CRA cases (Chen et al., 2013). Likewise, Zackular et al. identified a dozen of differentially abundant fecal taxa in CRA cases, although they did not consider multiple comparisons, overall diversity or composition (Zackular et al., 2014). In two very small studies, no large or statistically significant differences in the fecal microbiota of CRA cases were found (Brim et al., 2013, Mira-Pascual et al., 2014). The fecal microbiota of patients with small, benign adenoma (polyp) resembles that of normal controls (Zeller et al., 2014).
The current project had two objectives. We evaluated the feasibility of adding fecal microbiota analysis to the ongoing, population-based CRC screening program in Shanghai, and we sought to identify fecal microbial and other differences between well characterized CRA cases and colonoscopically normal controls from the same population.
2. Methods
2.1. Overview
The research protocol and procedures were reviewed and approved by institutional review boards at the U.S. National Cancer Institute and at the Shanghai Municipal Center for Disease Control and Prevention (SCDC). It is registered at ClinicalTrials.gov (identifier: NCT01778595) and conforms with the STROBE guidelines for reporting standards in observational cohort and case–control studies (http://www.strobe-statement.org/).
Staff at the Minhang and Xuhui district community health centers were trained and provided supplies for 100 participants. Consecutive patients aged 50–74 years who presented for CRC screening, in whom heme was detected by the fecal immunochemical test [FIT +, Baso Diagnostics Inc. (www.baso.com.cn/en/), prevalence = 14%], were scheduled for colonoscopy at the local hospital and also were invited to participate in the research study. The objectives and required procedures were presented and discussed individually, signed informed consent was obtained, and a CRC risk factor questionnaire was completed. The participant was instructed to collect the fecal specimens within the next few days, and well before bowel cleansing for colonoscopy which was scheduled about 2 weeks later. Colonoscopy and histopathology results, based on review by a single pathologist at the Fudan University Cancer Center, were electronically transmitted by the local hospital to the community health center and the SCDC.
2.2. Fecal Specimen Collection
The participant was provided with written and illustrated instructions, a cup for catching stool, and bar-coded 20 mL fecal collection vials (SARSTEDT, Nümbrecht, Germany). The vials for the current project had been preloaded with 5 mL of RNAlater (QIAGEN, Hilden, Germany) supplemented with kanamycin 300 μg/mL. In this media, fecal microbiota diversity and composition are unaltered and stable for up to seven days at room temperature (submitted for publication). The participant recorded the time of collection and promptly brought the specimens to the community health center where they were immediately frozen at − 20 °C. The specimens were transferred weekly on dry ice to the SCDC repository where they were inventoried and stored at − 80 °C. One vial from each participant was shipped overnight on dry ice to BGI for testing.
2.3. DNA Extraction and 16S rRNA Amplification, Sequencing, and Analysis
DNA isolation and purification were performed as described previously (Qin et al., 2012). One sample was found to be completely degraded. For unbiased representation of the fecal microbiota as described previously in detail (Fadrosh et al., 2014), approximately 469 bp of the 16S rRNA gene V3–V4 hypervariable region of the fecal DNA was amplified with primers that included a linker sequence (suitable for the Illumina MiSeq 250PE instrument), a 12 bp index sequence, a heterogeneity spacer (to minimize bias with low-diversity amplicons), and 16S rRNA universal primers 319F/806R. DNA products were quantified by a Qubit fluorometer (Life Technologies, Grand Island New York, U.S.A.). The amplicons were sequenced in a single pool in one run with the MiSeq 250PE, generating approximately 2.22 Gb of data. The raw sequences were processed to concatenate forward and reverse reads and to sort and match paired end sequences and barcodes. Using the pipeline of the Institute of Genome Sciences, University of Maryland Medical School, the processed reads were clustered, and the operational taxonomic units (OTUs) were assigned to taxa by matching to the Ribosomal Data Project naïve Bayesian classifier (Wang et al., 2007). Richness (number of observed species) and alpha diversity metrics (Chao1, Shannon index, and Phylogenetic Diversity whole-tree) were calculated using the Quantitative Insights Into Microbial Ecology (QIIME) pipeline (Caporaso et al., 2010).
2.4. Statistical Analysis
Primary analyses compared microbiota diversities, both alpha diversity and beta diversity, with CRA (any combination of tubular or villous histology or ≥ 1 cm diameter) versus normal colonoscopy. Secondary analyses compared CRA patients to all participants and also excluded participants who had received an antibiotic within 24 weeks of enrollment. Linear regression was used to assess the association of alpha diversity metrics. Quantile–quantile (QQ) plots of P-values were used to evaluate the global association patterns for taxa. Wilcoxon rank-sum tests were used to assess associations of individual taxon relative abundances, without adjustment for multiple comparisons. Differences of all taxon relative abundances in CRA cases, normals and other participants are provided but, these were not formally analyzed because of lack of statistical power considering the small sample size and heavy multiple testing burden.
We performed receiver operating characteristic (ROC) analysis to assess the potential of differentiating CRA/normal status based on microbiota composition. We used random forest (RF), a powerful supervised learning algorithm, to build classifiers based on taxon relative abundances with or without sex. Because of the small sample size, we could not partition the data into discovery and validation. For unbiased area-under-the-curve (AUC) assessment, we performed leave-one-out (LOO) analysis. Briefly, for each given participant, we built a classifier with all other participants and used the classifier to calculate the posterior probability for the given participant to be a CRA case. The AUC was then calculated based on the posterior probabilities. We also performed permutation analysis to investigate whether the method for assessing AUC was biased upward, i.e., higher than 0.5, for non-discriminative features. In each permutation, we randomly permuted the CRA/normal status and applied the RF + LOO procedure to calculate AUC. The mean and standard deviation were estimated based on the permuted AUCs.
Across all specimens, we calculated the beta diversity distance metrics, including unweighted and weighted UniFrac distance metrics. Following associations with taxon relative abundance based on the Wilcoxon rank-sum test, we developed a novel rank-based distance metric (RDM) to minimize the effect of outliers for comparisons of overall beta diversity. Given K exclusive taxa, each specimen was represented as a relative abundance vector Xi = (xi1, …, xiK). For each taxon, we calculated the rank of the relative abundance across all specimens to derive a new rank vector Ri = (ri1, …, riK). The RDM was defined as the sum of rank distances summarizing all taxa in consideration: dij = |ri1 − rj1| + … + |riK − rjK|. For additional insights, we considered Euclidian and Kullback-Leibler (K–L) distance metrics, as previously described (Goedert et al., 2014a).
Given a distance matrix D = (dij) for N specimens, we tested whether CRA cases and normals were separated in the distance matrix by a permutation test. Briefly, we defined Z00 as the average distance in the control group, Z11 as the average distance in the CRA group and Z01 as the average distance for all CRA/normal pairs. The statistic was defined as Z = (Z00 + Z11) / 2 − Z01, and its significance was evaluated by permuting CRA/normal status. Because sex is a risk factor for CRA, we further developed a permutation method to adjust the sex effect. Briefly, we calculated the statistics for males and females separately, denoted as Zmale and Zfemale. The overall statistic was defined as Zboth = (Zmale + Zfemale). The significance was evaluated by permuting the CRA/normal status in the male and female groups separately.
Furthermore, we performed clustering analysis to visualize the microbiota profile. After clustering, we tested whether some clusters were significantly enriched with CRA cases compared to other clusters. Since sex was associated with CRA status, associations were also adjusted for sex to investigate whether the detected associations were confounded by sex using the Cochran–Mantel–Haenszel exact test.
3. Results
Informed consent was provided by 95 consecutive FIT + patients. Several days prior to bowel cleansing, 68 (72%) patients returned, less than 2 h after defecation, with all four vials of feces in the media-loaded vials. These 68 participants with specimens were predominantly female (59%), and they had a median age of 65 [interquartile range (IQR) = 61–69] years and median body mass index (BMI) of 24 (IQR = 21–27) kg/m2. Other characteristics are provided in Table 1. Cigarette smoking was reported by 21 (75%) men and 1 woman. Alcohol consumption was reported by 10 men and 2 women. Ten participants reported receiving an antibiotic within 12 weeks of enrollment, 11 others received an antibiotic 12–24 weeks before enrollment, and the remaining 47 had no antibiotic use within 24 weeks.
Table 1.
Characteristics of the study participants.
| Characteristic | No. | Median (interquartile range) |
|---|---|---|
| Age | 65 (61–69) | |
| Male | 28 | |
| Female | 40 | |
| Pregnancy, no. | 2 (1.75, 3) | |
| Height, cm | 162 (158, 168) | |
| Weight, current, kg | 65 (57, 70) | |
| BMI, current, kg/m2 | 24 (21, 27) | |
| Weight, age 18, kg | 51 (48, 59) | |
| Weight, 10 years ago, kg | 60 (56, 67) | |
| Weight change, past 10 years | 0 (− 0.3, 5) | |
| Defecation frequency | ||
| > 1/day | 21 | |
| ~ 1/day | 37 | |
| Every 2 days | 4 | |
| ~ 2–3/week | 6 | |
| Red meat consumption | ||
| Never | 3 | |
| < 4/month | 21 | |
| 1–2/week | 29 | |
| > 2/week | 15 | |
| Aspirin use | ||
| None | 54 | |
| Any | 14 | |
| Smoking, men | ||
| Yes | 21 | |
| No | 7 | |
| Alcohol, men | ||
| None | 16 | |
| < 4/month | 3 | |
| 1–2/week | 1 | |
| > 2/week | 8 | |
| Antibiotic (most recent exposure) | ||
| More than 24 weeks | 47 | |
| Between 12 and 24 weeks | 11 | |
| Less than 12 weeks | 10 | |
| Colonoscopy result | ||
| Normal | 24 | |
| Colorectal adenoma | 20 | |
| Colorectal cancer | 2 | |
| Benign polyp | 9 | |
| Lymphoma | 1 | |
| Other/unsuccessful | 6 | |
| Refused | 6 |
Six participants refused colonoscopy, and it was unsuccessful in one. The 61 completed colonoscopies included 24 (39%) completely normal, 20 (33%) CRA, 5 (8%) enteritis/irritable bowel, 9 (15%) low-risk polyp, 1 ileocecal follicular lymphoma (grade 1), and 2 CRC (in follow-up, T2N0M0 and T3N1aM0, respectively) patients.
Variables that might confound comparison of the CRA and normal participants are presented in Supplemental Table 1. The two groups did not differ in age (P = 0.86), but they were more likely to be male (P = 0.04). Sex accounted completely for small differences between CRA and normal participants in BMI (P = 0.12) and red meat consumption (P = 0.05). CRA was associated with antibiotic exposure less than 12 weeks (N = 5 vs 1, P = 0.04) and 12–24 weeks (N = 5 vs 2, P = 0.07) before enrollment.
One fecal DNA specimen, in a participant who refused colonoscopy, failed to amplify. In the 67 successful fecal microbiota profiles, a median of 70,583 (range = 48,807–170,668) 16S rRNA sequences was clustered by 97% identity into 2922 OTUs, which were assigned to taxa from the phylum to the species level, including 18 different phyla, 38 classes, 64 orders, 115 families, 227 genera, and 303 species. Taxa in the Firmicutes and Bacteroidetes phyla were most common, followed by Proteobacteria, Actinobacteria and Fusobacteria, but individual differences were substantial (Supplemental Fig. 1).
Supplemental Fig. 1.

Relative abundance of all 18 phyla in all 67 participants in whom fecal microbiota profiles were successful. There was marked heterogeneity among individuals. In most participants, the major phyla were Firmicutes, Bacteroidetes, Actinobacteria, and Proteobacteria. Color-coded colonoscopy results are presented at the right-hand edge.
3.1. CRA Associations with Fecal Microbiota Diversity
CRA and normal participants did not differ in four estimates of fecal microbiota richness or alpha diversity (Supplemental Table 2). In contrast, CRA patients and normals differed in microbiota composition (beta diversity), as shown by the deviation from the null of the phylum-level (L2) quantile–quantile (QQ) plot (Fig. 1). Mean relative abundance in CRA patients and normals for each of the 18 phyla is presented in Supplemental Fig. 2. Similar deviations from null were found in QQ plots at the order level and family level (L4 and L5, respectively, Supplemental Fig. 3). With the beta-diversity matrix calculated using rank distance, the 20 CRA and 24 normal participants differed significantly at the phylum level (P = 0.02 based on 10,000 permutations, Supplemental Table 3). When adjusted for sex, this was no longer statistically significant (P = 0.11), implying confounding.
Fig. 1.
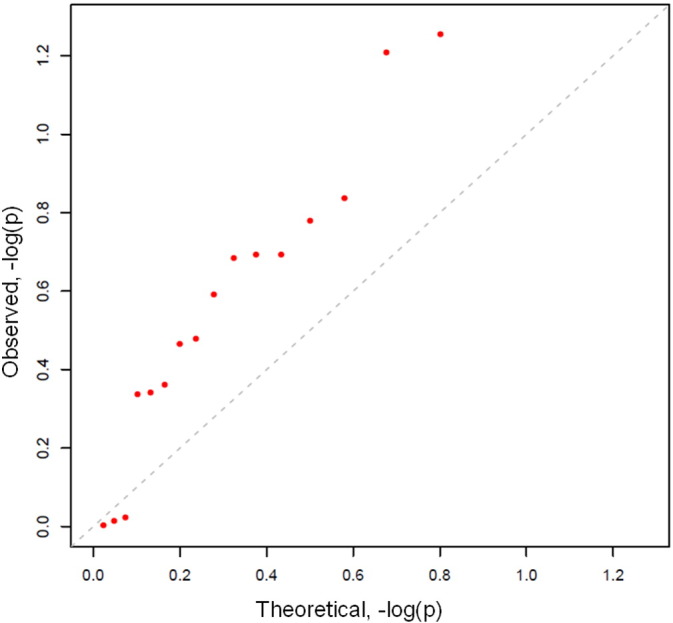
Quantile–quantile (QQ) plot of expected (x-axis) and observed (y-axis) P-values for Wilcoxon rank-sum tests of colorectal adenoma versus colonoscopically normal participants across all 18 fecal microbiota taxa classified at the phylum level. P-values (red dots) diverged from the null (diagonal dashed) line for 15 of 18 phyla. The two most divergent phyla (red dots, top middle) were Proteobacteria (P = 0.03) and TM7 (P = 0.04).
Supplemental Fig. 2.
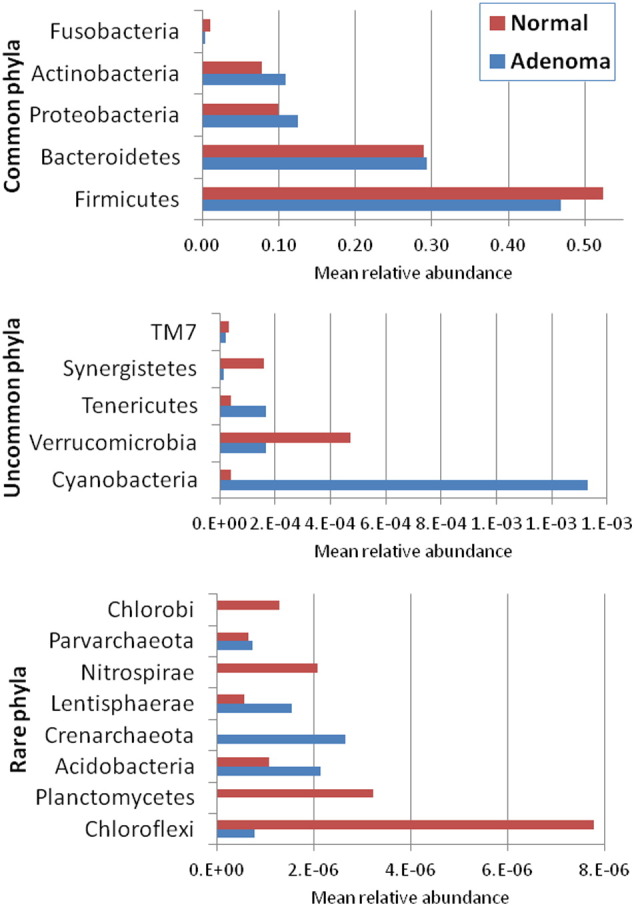
Mean relative abundance of all 18 phyla in the 24 colonoscopically normal and 20 adenoma patients. Note different x-axis scales for the five common phyla (top), the five uncommon phyla (middle) and the eight rare phyla (bottom).
Supplemental Fig. 3.
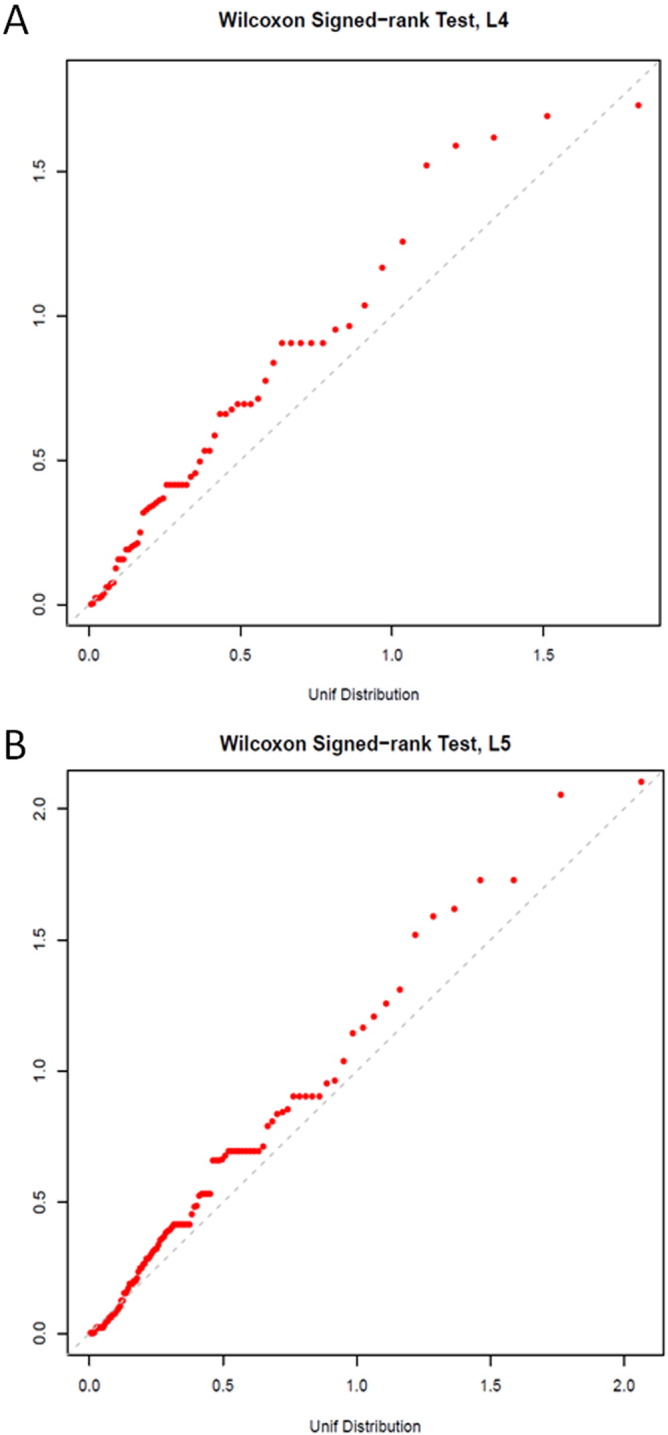
Quantile–quantile (QQ) plot of expected (x-axis) and observed (y-axis) P-values for Wilcoxon signed-rank tests of colorectal adenoma versus colonoscopically normal participants across all fecal microbiota taxa classified at the order (L4, panel A) and family (L5, panel B) levels.
In secondary analyses, excluding participants who had taken an antibiotic within the previous 24 weeks, the remaining 10 CRA patients differed from the 21 normal participants in rank distance at the L2, L6 (genus) and L7 (species) levels, and they differed from all 36 non-CRA participants in K–L distance at the L3 and L4 levels, and in Euclidean distance at the L5, L6 and L7 levels (all P ≤ 0.05, Supplemental Table 3). Without the antibiotic exclusion, community composition did not differ for CRA participants by Euclidean, K–L, or UniFrac distance estimates, nor when the 20 CRA participants were compared to all 41 non-CRA participants (Supplemental Table 3).
Without antibiotic exclusion, clustering analyses based on the rank-distance beta-diversity matrix revealed that CRA patients and normals differed in phylum-level phylogenetic distances regardless of the number of clusters (Fisher's exact P = 0.01 for two clusters, Fig. 2; chi-square test P = 0.02 for 3 clusters, and P = 0.03 for 4 clusters). The phylum-level dendrogram in Fig. 2 shows that CRA was significantly more prevalent in cluster B (17 of 29, 59%) than in cluster A (3 of 15, 20%, Fisher's exact P = 0.01).
Fig. 2.
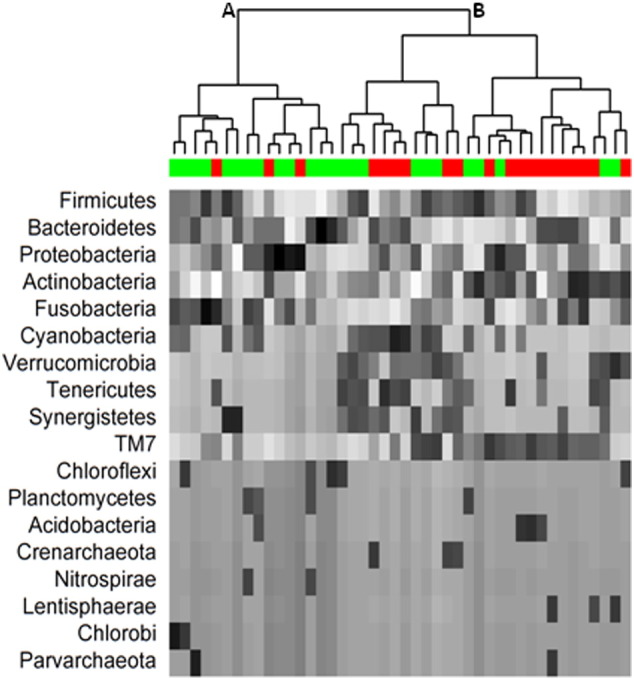
Dendrogram of rank distances and hierarchical clusters of 16S rRNA sequences across all 18 detected phyla for 20 participants with colorectal adenoma (red bar) and 24 with normal colonoscopy (green bar). The phyla are ordered by mean relative abundance; gray scale shows the rank within each phylum (highest black; lowest white). The proportion of participants with adenoma was significantly higher in cluster B (17 of 29, 59%) than in cluster A (3 of 15, 20%, P = 0.01).
Using rank relative abundance for all phylum-level taxa and the random forest plus leave-one-out procedure, Fig. 3 presents a receiver operating characteristic (ROC) curve distinguishing CRA patients from normals [area under the curve (AUC) = 0.767, permutation P = 0.006 versus null (AUC = 0.5)]. Adding sex did not improve the prediction. A similar discrimination was observed with all order-level taxa (AUC = 0.77).
Fig. 3.
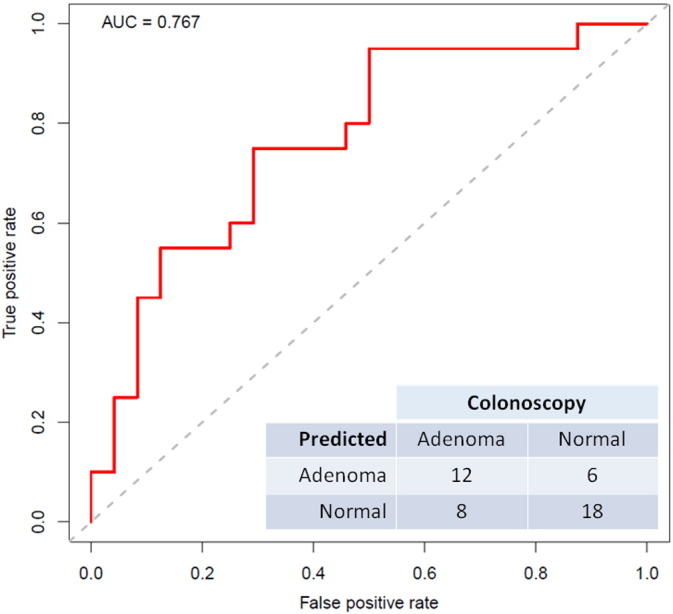
Receiver operating characteristic (ROC) curve to distinguish between colorectal adenoma and colonoscopically normal participants, using rank relative abundance of all phylum-level taxa and the random forest plus leave-one-out procedure. Compared to diagonal null line, area under the curve (AUC) was 0.767 (permutation P = 0.006). The predicted (0.5 cutoff) and actual distribution of the 20 adenoma and 24 normal participants is provided.
3.2. CRA Associations with Fecal Microbiota Taxa
Most of the compositional difference between CRA patients and normals reflected the relative abundance of Proteobacteria taxa (P = 0.03) and, to a lesser extent, rare candidate division TM7 taxa (P = 0.04). The relative abundance of Fusobacteria taxa was non-significantly lower in CRA cases than in normals (0.4% vs 1.0%, P = 0.46). These tests were not adjusted for multiple comparisons. The median relative abundance of Proteobacteria taxa was 3-fold higher in CRA patients than in normals (8.7% vs 2.9%, P = 0.03) and intermediate in the 23 other participants (4.4%). The Proteobacteria relative abundance was not associated with antibiotic exposure (P ≥ 0.55) or any of the other covariates (all P ≥ 0.07, Supplemental Table 4). The Proteobacteria association with CRA was not confounded by sex (Fig. 4) and was mostly with taxa in Gammaproteobacteria families Pseudomonadaceae, Legionellaceae, Halomonadaceae, and Enterobacteriaceae and genera Serratia, Shigella, Salmonella, Pantoea, Morganella, Trabulsiella, and Escherichia (Supplemental Table 5).
Fig. 4.

Box plots of relative abundance of fecal Proteobacteria taxa by sex and colonoscopy result. Data for participants found to have colorectal adenoma are in red, those with normal colonoscopy are in green, and all others (including those who refused colonoscopy) are in gray. Boxes are the interquartile range; bands within the boxes are the median values; individual outliers are dots. Relative abundance of Proteobacteria was significantly higher with adenoma compared to normal colonoscopy (Wilcoxon rank-sum test P = 0.03), and this was true in both females (median = 0.102 vs 0.027) and males (median = 0.087 vs 0.038).
4. Discussion
We found CRA in 33% of 61 Shanghai residents aged 50–74 who had occult blood in feces (FIT +) and who completed colonoscopy. The overall composition of the fecal microbiota differed significantly between CRA and normal-colonoscopy participants, with good discrimination (AUC = 0.767). Unlike Zackular et al. (2014), this calculation was based on the entire microbial community rather than on a handful of taxa selected to maximize the discrimination. Of potential functional interest, we noted that CRA was associated with significantly higher abundance of fecal Proteobacteria, the phylum that includes established gut pathogens — Pseudomonas, Escherichia, Shigella, Salmonella, Serratia, Klebsiella, and Helicobacter. Our findings corroborate those from a prior study in Shanghai, in which fecal microbial communities differed between 47 CRA patients and 47 normal-colonoscopy patients (Chen et al., 2013). In that latter study, the abundance of Proteobacteria taxa was modestly higher with CRA (mean = 3.7% vs 3.0%), but most of the compositional difference was attributed to other bacterial taxa (Chen et al., 2013). CRA cases also had higher abundance of Proteobacteria in feces in a small study in Spain (Mira-Pascual et al., 2014) and in biopsies of unaffected rectal mucosa (Mira-Pascual et al., 2014, Shen et al., 2010). Only one of the dozen CRA-associated taxa noted in the American study, Pseudomonas, was in the Proteobacteria phylum (Zackular et al., 2014).
Following detection of CRA, surveillance colonoscopy after 3 years is strongly recommended (Lieberman et al., 2012), and this was reinforced by the recent finding that a 5-year interval was insufficient (Loberg et al., 2014). Our results may help to inform CRA/CRC screening, particularly where referral for colonoscopy is based on FIT +. Nearly 9% of our FIT + participants refused colonoscopy, which is clearly suboptimal. Perhaps adherence to follow-up colonoscopy would be increased with a higher sensitivity primary screen. The positive predictive value for CRA with above-median Proteobacteria was 67% (12 of 18) in our FIT + participants, although this was optimized for the Proteobacteria distribution that we observed and would be much lower in FIT-negative and -untested populations.
Fecal microbiota alpha diversity and richness (e.g., number of different taxa) were not associated with CRA in our study, whereas one study reported decreased richness in feces from CRC cases (Ahn et al., 2013) and another reported increased richness in unaffected mucosa from CRA cases (Sanapareddy et al., 2012). We also did not find an association of Fusobacteria with CRA, in contrast to the relatively strong and consistent detection of Fusobacteria in malignant CRC tumor tissue (Castellarin et al., 2012, Flanagan et al., 2014, Kostic et al., 2012, Warren et al., 2013) and in feces (Ahn et al., 2013, Wu et al., 2013, Zeller et al., 2014) from CRC cases. Data on Fusobacteria in CRA are sparse. One study reported increased Fusobacteria abundance in CRA tissue, but only with high-grade dysplasia (Flanagan et al., 2014). A second study found that CRA cases, some with very small tumors, had increased Fusobacteria abundance in unaffected rectal mucosa compared to the mucosa of normal controls (McCoy et al., 2013). In our study, Fusobacteria was the fifth most abundant phylum (Fig. 2), but its relative abundance was less than 1% irrespective of CRA status, suggesting that it is not required for CRA. The possibility remains that unbalanced amplification (“primer bias”) with our newly developed method (Fadrosh et al., 2014) might have contributed to our null association with Fusobacteria. On a broader level, deeper sequencing, as well as additional, larger, and prospective studies of the fecal microbiota in diverse populations, will be needed to clarify whether and how alpha diversity, community composition, Fusobacteria, Proteobacteria, and other potentially pathogenic microbes contribute to the etiology and early detection of colorectal neoplasia (Collins et al., 2011, Tjalsma et al., 2012).
The strengths of our study include nesting within a population-based CRC screening program, fecal specimens collected prior to bowel cleansing and into a chemical stabilizer, and state-of-the-art amplification, sequencing, and statistical analysis methods. Particularly noteworthy is our development and application of a rank-based distance metric to quantify and test for differences in composition (beta diversity). This development originated with the Wilcoxon rank-sum test, which we used to reduce the influence of extreme values and with which we observed CRA associations across most of the 18 detected phyla. Also noteworthy is our use of random forests plus leave-one-out, which is equivalent to repeated cross-validation, to quantify the discrimination between CRA and normal patients. The major weaknesses of our study are the lack of an a priori hypothesis, cross-sectional design and very small size, which preclude detecting changes over time, associations with minor taxa, potential interactions with known risk factors for CRA, and a statistically robust set of CRA-associated taxa.
In conclusion, we found that the microbial composition of fecal specimens in both men and women differed significantly between patients with CRA and patients with a normal colonoscopy. In secondary analyses, excluding participants who had antibiotic exposure within 24 weeks, the difference with CRA was significant with various estimates of composition and down to the species level. The difference was predominantly and significantly due to higher abundance of Proteobacteria taxa in the CRA feces. Because Proteobacteria includes several well established gut pathogens and because colorectal neoplasia is closely tied to mucosal inflammation (Beaugerie et al., 2013, Collins et al., 2011, Tjalsma et al., 2012), the association with CRA that we found is plausible. Larger, longitudinal studies will be needed to determine whether and which Proteobacteria taxa contribute to early colorectal neoplasia and the potential use of fecal microbiota analysis to improve CRA screening and ultimately to reduce CRC mortality.
The following are the supplementary data related to this article.
Characteristics associated with colorectal adenoma versus normal.
Richness and alpha diversity with normal versus colorectal adenoma by colonoscopy.
P-values for adenoma cases versus normals or versus all other participants on various fecal microbiota beta diversity parameters.*
Associations of covariates with relative abundance of Proteobacteria taxa.
Mean relative abundance of all taxa, by colonoscopy group.
Supplemental methods.
Conflict of Interest
The authors confirm that there are no known conflicts of interest associated with this publication. Dr. Zhong and Dr. He report employment by BGI, but there has been no significant financial support for this work that could have influenced its outcome.
Author Contributions
YZ and JJG supervised the study. JJG conceived and designed the study, obtained funding, interpreted the data, and drafted the manuscript. YZ, HZ, WW and JR obtained funding and contributed to the design, interpretation of the data, and drafting of the manuscript. HZ and JR also developed the microbiota testing strategy, methods and analytic procedures. YH performed the microbiota testing and initial data assembly. JR developed the bioinformatic pipeline. WW supervised the biospecimen handling, transportation, and repository. YG and PP trained the field staff and supervised the collection and transport of specimens and the collection and editing of questionnaire data. JS developed the statistical analysis strategy and supervised the statistical analyses. XH, GY and JS performed the statistical analyses. All authors contributed to the interpretation of the data and contributed to and approved the final version of the manuscript.
Funding
This study was supported by the Intramural Research Program, National Cancer Institute, National Institutes of Health (Z01CP010214) and by the Shanghai Municipal Center for Disease Control and Prevention.
Acknowledgments
The authors are grateful to the study participants, the staff at the community health centers, Dr. Bing Ma for assistance with data processing, Dr. Ann Chao for facilitating the field work, Dr. Marc Gunter for useful discussions, and Dr. Mitchell Gail for statistical advice.
References
- Ahlquist D.A., Zou H., Domanico M., Mahoney D.W., Yab T.C., Taylor W.R., Butz M.L., Thibodeau S.N., Rabeneck L., Paszat L.F. Next-generation stool DNA test accurately detects colorectal cancer and large adenomas. Gastroenterology. 2012;142:248–256. doi: 10.1053/j.gastro.2011.10.031. (quiz e225-246) [DOI] [PMC free article] [PubMed] [Google Scholar]
- Ahn J., Sinha R., Pei Z., Dominianni C., Wu J., Shi J., Goedert J.J., Hayes R.B., Yang L. Human gut microbiome and risk for colorectal cancer. J. Natl. Cancer Inst. 2013;105:1907–1911. doi: 10.1093/jnci/djt300. [DOI] [PMC free article] [PubMed] [Google Scholar]
- Beaugerie L., Svrcek M., Seksik P., Bouvier A.M., Simon T., Allez M., Brixi H., Gornet J.M., Altwegg R., Beau P. Risk of colorectal high-grade dysplasia and cancer in a prospective observational cohort of patients with inflammatory bowel disease. Gastroenterology. 2013;145:166–175. doi: 10.1053/j.gastro.2013.03.044. (e168) [DOI] [PubMed] [Google Scholar]
- Brim H., Yooseph S., Zoetendal E.G., Lee E., Torralbo M., Laiyemo A.O., Shokrani B., Nelson K., Ashktorab H. Microbiome analysis of stool samples from African Americans with colon polyps. PLoS One. 2013;8:e81352. doi: 10.1371/journal.pone.0081352. [DOI] [PMC free article] [PubMed] [Google Scholar]
- Caporaso J.G., Kuczynski J., Stombaugh J., Bittinger K., Bushman F.D., Costello E.K., Fierer N., Pena A.G., Goodrich J.K., Gordon J.I. QIIME allows analysis of high-throughput community sequencing data. Nat. Methods. 2010;7:335–336. doi: 10.1038/nmeth.f.303. [DOI] [PMC free article] [PubMed] [Google Scholar]
- Carmona F.J., Azuara D., Berenguer-Llergo A., Fernandez A.F., Biondo S., de Oca J., Rodriguez-Moranta F., Salazar R., Villanueva A., Fraga M.F. DNA methylation biomarkers for noninvasive diagnosis of colorectal cancer. Cancer Prev. Res. (Phila.) 2013;6:656–665. doi: 10.1158/1940-6207.CAPR-12-0501. [DOI] [PubMed] [Google Scholar]
- Castellarin M., Warren R.L., Freeman J.D., Dreolini L., Krzywinski M., Strauss J., Barnes R., Watson P., Allen-Vercoe E., Moore R.A. Fusobacterium nucleatum infection is prevalent in human colorectal carcinoma. Genome Res. 2012;22:299–306. doi: 10.1101/gr.126516.111. [DOI] [PMC free article] [PubMed] [Google Scholar]
- Chen H.M., Yu Y.N., Wang J.L., Lin Y.W., Kong X., Yang C.Q., Yang L., Liu Z.J., Yuan Y.Z., Liu F. Decreased dietary fiber intake and structural alteration of gut microbiota in patients with advanced colorectal adenoma. Am. J. Clin. Nutr. 2013;97:1044–1052. doi: 10.3945/ajcn.112.046607. [DOI] [PubMed] [Google Scholar]
- Collins D., Hogan A.M., Winter D.C. Microbial and viral pathogens in colorectal cancer. Lancet Oncol. 2011;12:504–512. doi: 10.1016/S1470-2045(10)70186-8. [DOI] [PubMed] [Google Scholar]
- Fadrosh D.W., Ma B., Gajer P., Sengamalay N., Ott S., Brotman R.M., Ravel J. An improved dual-indexing approach for multiplexed 16S rRNA gene sequencing on the Illumina MiSeq platform. Microbiome. 2014;2:6. doi: 10.1186/2049-2618-2-6. [DOI] [PMC free article] [PubMed] [Google Scholar]
- Flanagan L., Schmid J., Ebert M., Soucek P., Kunicka T., Liska V., Bruha J., Neary P., Dezeeuw N., Tommasino M. Fusobacterium nucleatum associates with stages of colorectal neoplasia development, colorectal cancer and disease outcome. Eur. J. Clin. Microbiol. Infect. Dis. 2014;33:1381–1390. doi: 10.1007/s10096-014-2081-3. [DOI] [PubMed] [Google Scholar]
- Goedert J.J., Hua X., Yu G., Shi J. Diversity and composition of the adult fecal microbiome associated with history of cesarean birth or appendectomy: analysis of the American Gut Project. EBioMedicine. 2014;1:167–172. doi: 10.1016/j.ebiom.2014.11.004. [DOI] [PMC free article] [PubMed] [Google Scholar]
- Goedert J.J., Sampson J.N., Moore S.C., Xiao Q., Xiong X., Hayes R.B., Ahn J., Shi J., Sinha R. Fecal metabolomics: assay performance and association with colorectal cancer. Carcinogenesis. 2014;35:2089–2096. doi: 10.1093/carcin/bgu131. [DOI] [PMC free article] [PubMed] [Google Scholar]
- Imperiale T.F., Ransohoff D.F., Itzkowitz S.H., Levin T.R., Lavin P., Lidgard G.P., Ahlquist D.A., Berger B.M. Multitarget stool DNA testing for colorectal-cancer screening. N. Engl. J. Med. 2014;370:1287–1297. doi: 10.1056/NEJMoa1311194. [DOI] [PubMed] [Google Scholar]
- Kostic A.D., Gevers D., Pedamallu C.S., Michaud M., Duke F., Earl A.M., Ojesina A.I., Jung J., Bass A.J., Tabernero J. Genomic analysis identifies association of Fusobacterium with colorectal carcinoma. Genome Res. 2012;22:292–298. doi: 10.1101/gr.126573.111. [DOI] [PMC free article] [PubMed] [Google Scholar]
- Kuipers E.J., Rosch T., Bretthauer M. Colorectal cancer screening—optimizing current strategies and new directions. Nat. Rev. Clin. Oncol. 2013;10:130–142. doi: 10.1038/nrclinonc.2013.12. [DOI] [PubMed] [Google Scholar]
- Lieberman D. Screening for colorectal cancer in individuals at average risk: current methods and emerging issues. JAMA Intern. Med. 2014;174:10–11. doi: 10.1001/jamainternmed.2013.11499. [DOI] [PubMed] [Google Scholar]
- Lieberman D.A., Rex D.K., Winawer S.J., Giardiello F.M., Johnson D.A., Levin T.R. Guidelines for colonoscopy surveillance after screening and polypectomy: a consensus update by the US Multi-Society Task Force on Colorectal Cancer. Gastroenterology. 2012;143:844–857. doi: 10.1053/j.gastro.2012.06.001. [DOI] [PubMed] [Google Scholar]
- Loberg M., Kalager M., Holme O., Hoff G., Adami H.O., Bretthauer M. Long-term colorectal-cancer mortality after adenoma removal. N. Engl. J. Med. 2014;371:799–807. doi: 10.1056/NEJMoa1315870. [DOI] [PubMed] [Google Scholar]
- McCoy A.N., Araujo-Perez F., Azcarate-Peril A., Yeh J.J., Sandler R.S., Keku T.O. Fusobacterium is associated with colorectal adenomas. PLoS One. 2013;8:e53653. doi: 10.1371/journal.pone.0053653. [DOI] [PMC free article] [PubMed] [Google Scholar]
- Meester R.G., Doubeni C.A., Lansdorp-Vogelaar I., Goede S.L., Levin T.R., Quinn V.P., Ballegooijen M., Corley D.A., Zauber A.G. Colorectal cancer deaths attributable to nonuse of screening in the United States. Ann. Epidemiol. 2015;25:208–213. doi: 10.1016/j.annepidem.2014.11.011. (e201) [DOI] [PMC free article] [PubMed] [Google Scholar]
- Mira-Pascual L., Cabrera-Rubio R., Ocon S., Costales P., Parra A., Suarez A., Moris F., Rodrigo L., Mira A., Collado M.C. Microbial mucosal colonic shifts associated with the development of colorectal cancer reveal the presence of different bacterial and archaeal biomarkers. J. Gastroenterol. 2015;50:167–179. doi: 10.1007/s00535-014-0963-x. [DOI] [PubMed] [Google Scholar]
- Qin J., Li Y., Cai Z., Li S., Zhu J., Zhang F., Liang S., Zhang W., Guan Y., Shen D. A metagenome-wide association study of gut microbiota in type 2 diabetes. Nature. 2012;490:55–60. doi: 10.1038/nature11450. [DOI] [PubMed] [Google Scholar]
- Sanapareddy N., Legge R.M., Jovov B., McCoy A., Burcal L., Araujo-Perez F., Randall T.A., Galanko J., Benson A., Sandler R.S. Increased rectal microbial richness is associated with the presence of colorectal adenomas in humans. ISME J. 2012;6:1858–1868. doi: 10.1038/ismej.2012.43. [DOI] [PMC free article] [PubMed] [Google Scholar]
- Schwabe R.F., Jobin C. The microbiome and cancer. Nat. Rev. Cancer. 2013;13:800–812. doi: 10.1038/nrc3610. [DOI] [PMC free article] [PubMed] [Google Scholar]
- Sears C.L., Pardoll D.M. Perspective: alpha-bugs, their microbial partners, and the link to colon cancer. J. Infect. Dis. 2011;203:306–311. doi: 10.1093/jinfdis/jiq061. [DOI] [PMC free article] [PubMed] [Google Scholar]
- Shen X.J., Rawls J.F., Randall T., Burcal L., Mpande C.N., Jenkins N., Jovov B., Abdo Z., Sandler R.S., Keku T.O. Molecular characterization of mucosal adherent bacteria and associations with colorectal adenomas. Gut Microbes. 2010;1:138–147. doi: 10.4161/gmic.1.3.12360. [DOI] [PMC free article] [PubMed] [Google Scholar]
- Tjalsma H., Boleij A., Marchesi J.R., Dutilh B.E. A bacterial driver–passenger model for colorectal cancer: beyond the usual suspects. Nat. Rev. Microbiol. 2012;10:575–582. doi: 10.1038/nrmicro2819. [DOI] [PubMed] [Google Scholar]
- Wang Q., Garrity G.M., Tiedje J.M., Cole J.R. Naive Bayesian classifier for rapid assignment of rRNA sequences into the new bacterial taxonomy. Appl. Environ. Microbiol. 2007;73:5261–5267. doi: 10.1128/AEM.00062-07. [DOI] [PMC free article] [PubMed] [Google Scholar]
- Wang T., Cai G., Qiu Y., Fei N., Zhang M., Pang X., Jia W., Cai S., Zhao L. Structural segregation of gut microbiota between colorectal cancer patients and healthy volunteers. ISME J. 2012;6:320–329. doi: 10.1038/ismej.2011.109. [DOI] [PMC free article] [PubMed] [Google Scholar]
- Warren R.L., Freeman D.J., Pleasance S., Watson P., Moore R.A., Cochrane K., Allen-Vercoe E., Holt R.A. Co-occurrence of anaerobic bacteria in colorectal carcinomas. Microbiome. 2013;1:16. doi: 10.1186/2049-2618-1-16. [DOI] [PMC free article] [PubMed] [Google Scholar]
- Weir T.L., Manter D.K., Sheflin A.M., Barnett B.A., Heuberger A.L., Ryan E.P. Stool microbiome and metabolome differences between colorectal cancer patients and healthy adults. PLoS One. 2013;8:e70803. doi: 10.1371/journal.pone.0070803. [DOI] [PMC free article] [PubMed] [Google Scholar]
- Wu N., Yang X., Zhang R., Li J., Xiao X., Hu Y., Chen Y., Yang F., Lu N., Wang Z. Dysbiosis signature of fecal microbiota in colorectal cancer patients. Microb. Ecol. 2013;66:462–470. doi: 10.1007/s00248-013-0245-9. [DOI] [PubMed] [Google Scholar]
- Zackular J.P., Rogers M.A., Ruffin M.T.T., Schloss P.D. The human gut microbiome as a screening tool for colorectal cancer. Cancer Prev. Res. (Phila.) 2014;7:1112–1121. doi: 10.1158/1940-6207.CAPR-14-0129. [DOI] [PMC free article] [PubMed] [Google Scholar]
- Zauber A.G., Winawer S.J., O'Brien M.J., Lansdorp-Vogelaar I., van Ballegooijen M., Hankey B.F., Shi W., Bond J.H., Schapiro M., Panish J.F. Colonoscopic polypectomy and long-term prevention of colorectal-cancer deaths. N. Engl. J. Med. 2012;366:687–696. doi: 10.1056/NEJMoa1100370. [DOI] [PMC free article] [PubMed] [Google Scholar]
- Zeller G., Tap J., Voigt A.Y., Sunagawa S., Kultima J.R., Costea P.I., Amiot A., Bohm J., Brunetti F., Habermann N. Potential of fecal microbiota for early-stage detection of colorectal cancer. Mol. Syst. Biol. 2014;10:766. doi: 10.15252/msb.20145645. [DOI] [PMC free article] [PubMed] [Google Scholar]
Associated Data
This section collects any data citations, data availability statements, or supplementary materials included in this article.
Supplementary Materials
Characteristics associated with colorectal adenoma versus normal.
Richness and alpha diversity with normal versus colorectal adenoma by colonoscopy.
P-values for adenoma cases versus normals or versus all other participants on various fecal microbiota beta diversity parameters.*
Associations of covariates with relative abundance of Proteobacteria taxa.
Mean relative abundance of all taxa, by colonoscopy group.
Supplemental methods.