

Abstract
Although numerous studies highlighted the role of Epstein–Barr Virus (EBV) in B-cell transformation, the involvement of EBV proteins or genome in the development of the most frequent adult leukemia, chronic lymphocytic leukemia (CLL), has not yet been defined. We hypothesized that EBV microRNAs contribute to progression of CLL and demonstrated the presence of EBV miRNAs in B-cells, in paraffin-embedded bone marrow biopsies and in the plasma of patients with CLL by using three different methods (small RNA-sequencing, quantitative reverse transcription PCR [q-RT-PCR] and miRNAs in situ hybridization [miRNA-ISH]). We found that EBV miRNA BHRF1-1 expression levels were significantly higher in the plasma of patients with CLL compared with healthy individuals (p < 0 · 0001). Notably, BHRF1-1 as well as BART4 expression were detected in the plasma of either seronegative or seropositive (anti-EBNA-1 IgG and EBV DNA tested) patients; similarly, miRNA-ISH stained positive in bone marrow specimens while LMP1 and EBER immunohistochemistry failed to detect viral proteins and RNA. We also found that BHRF1-1 plasma expression levels were positively associated with elevated beta-2-microglobulin levels and advanced Rai stages and observed a correlation between higher BHRF1-1 expression levels and shorter survival in two independent patients' cohorts. Furthermore, in the majority of CLL cases where BHRF1-1 was exogenously induced in primary malignant B cells the levels of TP53 were reduced. Our findings suggest that EBV may have a role in the process of disease progression in CLL and that miRNA RT-PCR and miRNAs ISH could represent additional methods to detect EBV miRNAs in patients with CLL.
Keywords: miRNAs, Epstein–Barr Virus, Chronic lymphocytic leukemia, BHRF1-1, Overall survival
Highlights
-
•
EBV miRNA BHRF1-1 expression levels are higher in the plasma of patients with CLL compared with healthy individuals.
-
•
EBV miRNAs are expressed in both, seronegative and seropositive (anti-EBNA-1 IgG and EBV DNA tested) patients with CLL
-
•
BHRF1-1 expression levels are associated with unfavorable prognostic markers and shorter survival
1. Introduction
Over the past decade, numerous studies have highlighted the central role of short non-coding transcripts, named microRNAs (miRNAs), in the pathogenesis of CLL and their influence on the development of the disease and its aggressiveness (Fabbri et al., 2011). MiRNAs are non-coding RNAs which target messenger RNA for degradation and translational repression, and are involved in many physiologic and pathologic processes (Calin and Croce, 2009). A model of CLL pathogenesis that accounts for three of the most frequent recurrent chromosomal abnormalities in B-CLL (13q-, 11q- and 17p-) has been developed explaining the complex interaction networks composed of coding and non-coding genes (Fabbri and Croce, 2011).
The clinical course of CLL is highly heterogeneous; some patients have indolent disease never requiring treatment, whereas others need treatment at the time of disease presentation. Several prognostic markers have been identified including genomic abnormalities according to fluorescent in situ hybridization (FISH) (Dohner et al., 2000), immunoglobulin heavy chain variable gene (IGHV) mutation status (Hamblin et al., 1999, Damle et al., 1999), CD38 (Damle et al., 1999) and ZAP70 expression (Crespo et al., 2003). The prognostic value of biological markers relies on the ability to predict time to first treatment, response to treatment, progression free survival and overall survival (OS). Recently, our group found that a microRNA, miR-155, was expressed at high levels in B-cells from patients with CLL compared with B-cells from normal individuals and in plasma of patients who failed to achieve a complete response compared to responding patients, suggesting its role as a biomarker for risk of progression (Ferrajoli et al., 2013).
Several studies have investigated the role played by the Epstein–Barr Virus (EBV) and other viruses in the pathogenesis of CLL (Tsimberidou et al., 2006, Tarrand et al., 2010), but a definitive mechanism involving EBV proteins or genome has not been identified. EBV is a ubiquitous, human-specific gamma herpes virus, which typically causes subclinical and latent infection of B cells in healthy individuals. It is associated with a variety of B-cell lymphomas that arise in patients with or without overt impairments in cellular immunity (Campo et al., 2011). Interestingly, in EBV-associated lymphomas, the substantial majority of cells show evidence for the presence of EBV genome by in-situ hybridization (ISH) (Delecluse et al., 2007). Three types of EBV latency states have been described in EBV-related lymphomas according to the pattern of EBV nuclear antigen (EBNA) and the latent membrane protein (LMP) expression. Two sets of non-coding RNAs are also expressed in all forms of EBV infection: the EBER RNAs (Arrand and Rymo, 1982, Lerner et al., 1981) and the BamHI A rightward transcripts (BARTs). It has been shown that EBV also encodes miRNAs (Cai et al., 2006). EBV miRNAs map to two regions of the viral genome: BHRF1 miRNAs are located immediately upstream and downstream of the BHRF1 open reading frame, while BART miRNAs lie within the intronic regions of BART genes (Amoroso et al., 2011). To date there is little information regarding their functions in the viral and cell life cycle although some specific targets have been identified (Marquitz et al., 2011, Dolken et al., 2010, Barth et al., 2008, Choy et al., 2008, Lo et al., 2007, Lung et al., 2009, Xia et al., 2008). EBV infection may influence the expression of several cellular miRNAs (Navarro et al., 2008). Interestingly, it has been reported that miR-155 is the cellular miRNA most highly induced after EBV infection of lymphoblastoid B-cells (Linnstaedt et al., 2010).
The purpose of our study is to assess EBV miRNAs expression and their contribution to the CLL disease progression. To do this, we analyzed by different methods (small RNA sequencing analysis, qRT-PCR and miRNA In Situ Hybridization) the expression levels of EBV miRNAs in B-cells, plasma and paraffin-embedded bone marrow biopsy specimens from patients with CLL and determined their association with clinical outcome.
2. Material and Methods
2.1. Patients and Samples
A total of 516 samples obtained from patients evaluated at the University of Texas MD Anderson Cancer Center, Houston, Texas (UTMDACC) and The Mayo Clinics, Rochester, Minnesota were used for this study (Table S1). Informed consent was obtained per institutional guidelines and in accordance with the Declaration of Helsinki.
We initially analyzed 48 samples by small RNA sequencing, including B-cells isolated from 34 patients with CLL and 14 healthy individuals. Subsequently, we performed quantitative reverse transcriptase PCR (qRT-PCR) using the training/validation approach with multiple sets of B-cells and plasma samples. The samples were divided as follows: i) B-cells collected from 93 patients with untreated CLL constituted the training group and; ii) B-cells from a second set of 54 patients with both treated and untreated patients constituted the validation group (clinical characteristics of these patients were described in Rossi et al.) (Rossi et al., 2010); iii) normal B lymphocytes from 20 healthy individuals were used as normal controls. Plasma samples collected from the following groups: i) plasma samples from 143 patients with untreated CLL constituted the training set; ii) plasma samples from a second set of 49 patients with CLL constituted the validation set; iii) plasma samples from 80 healthy individuals were used as normal controls. Finally, we performed miRNA In Situ Hybridization (miRNA ISH) on paraffin-embedded bone marrow biopsies obtained from 29 patients with CLL, (with 19 out of 29 arranged on a Tissue Micro Array (TMA)). None of the CLL patients were on immunosuppressive therapy before the samples collection. The B-cells and the plasma samples in the training cohort were collected from previously untreated patients. Although the B-cells validation cohort included both treated and untreated patients, none of the samples were collected during treatment.
Healthy individuals were volunteer blood donors; here “healthy” was defined as the absence of any type of cancer or known medical condition at the time of the sample collection has previously reported (Zuo et al., 2011).
Patients with CLL had a confirmed diagnosis based on morphologic and immunophenotypic features, and they were staged according to the Rai classification. Immunoglobulin heavy chain variable (IGHV) gene mutational analysis, zeta-chain associated protein kinase 70 kDa (ZAP70) status, CD38 status and fluorescence in situ hybridization (FISH) analysis were available for most of the patients. IGHV mutation was defined by the presence of < 98% homology at sequencing and ZAP70 was defined as being positive if expressed in more than 20% of cells by flow cytometry. The characteristics of the patients are summarized in Table 1.
Table 1.
Clinical characteristics of patients with CLL.
| CLL B-cells |
Plasma |
||
|---|---|---|---|
| Characteristics | (Training set) (n = 93) |
(Validation set) (n = 54) |
CLL (n = 143) |
| No. (%) | No. (%) | No. (%) | |
| Rai stage | |||
| 0–2 | 79 (85) | 26 (72) | 106 (74) |
| 3.–4 | 14 (15) | 10 (28) | 37 (26) |
| No data | 18 | ||
| ZAP70 expression | |||
| Positive | 27 (39) | 34 (63) | 74 (54) |
| Negative | 43 (61) | 20 (37) | 64 (46) |
| No data | 23 | 5 | |
| CD38 expression | |||
| Positive | 25 (27) | 20 (37) | No data |
| Negative | 68 (73) | 34 (63) | |
| FISH results | |||
| Negative | 14 (16) | 19 (45) | 19 (26) |
| 13q deletion | 43 (51) | 2 (5) | 14 (19) |
| Trisomy 12 | 19 (22) | 0 (0) | 9 (12) |
| 11q deletion | 2 (2) | 0 (0) | 24 (33) |
| 17p deletion | 6 (7) | 21 (50) | 7 (10) |
| Other | 1 (1) | 0 (0) | 0 |
| No data | 8 | 12 | 70 |
| IGHV mutation status | |||
| Mutated | 56 (63) | 14 (26) | 36 (27) |
| Unmutated | 33 (37) | 31 (57) | 99 (73) |
| No data | 4 | 9 | 8 |
| Median time to treatment (months) (range) |
79.7 (0–124.94) | 19 (0.07–190.49) | |
Abbreviations: CLL, chronic lymphocytic leukemia; FISH, fluorescence in situ hybridization; IGHV, immunoglobulin heavy chain mutational status.
B-cells were isolated and/or purified from blood samples of healthy individuals and patients with CLL as previously described (Ferrajoli et al., 2013). The typical purity of CD19 + CLL cells for our studies was > 90%.
Plasma samples were obtained from the CLL Research Consortium bank at The University of California, San Diego where they had been stored at − 80 °C until the experiments were performed.
2.2. Small RNA Sequencing
RNA was extracted with Trizol Reagent (Life Technologies, Carlsbad, CA) and the SOLiD Total RNA-Seq kit was used for the library preparation (Life Technologies, Carlsbad, CA). The RNA was run on the SOLiD 5500XL System (Applied Biosystems, Carlsbad, CA). We analyzed the miRNA-sequencing data using CLC Genomics Workbench 6 using default parameters and obtained miRNA sequences from miRBase. In the analysis, after filtering those reads that mapped to human miRNAs, the remaining reads were mapped to various viruses of interest. Sequences for miRNAs of 27 different viruses were obtained from the miRBase database (release 20, June 2013, www.mirbase.org). The match types of mapped reads were annotated according to the location within miRNA genes by the software.
2.3. B-cell RNA Isolation, miRNA Expression Analysis and Normalizer Identification
RNA was extracted with Trizol (Life Technologies, Carlsbad, CA) using B-cells isolated from healthy donors, or patients with CLL. MiRNA expression was measured with the TaqMan miRNA qRT-PCR method (Life Technologies, Carlsbad, CA), with a CFX384 real-time PCR detection system (Biorad, Hercules, CA). Briefly, 10 ng of total RNA was reverse transcribed using the miRNA reverse transcription kit (Life Technologies, Carlsbad, CA) and a specific reverse-transcription stem-loop primer, according to the manufacturer's protocol. Expression levels for the normalizer 5Sr RNA were measured by the SYBR Green method (Bio-Rad-SsoFast, Hercules, CA) and were similar for all groups of samples (Fig. S2). Reverse transcription reaction was performed on 10 ng total RNA of each patient sample with random hexamers using SuperScript III First-Strand Synthesis System (Life Technologies, Carlsbad, CA), according to the manufacturer's instructions. Real-time qPCR analysis was performed using the gene-specific Taqman assay (primers and probes; Life Technologies, Carlsbad, CA) and SYBR Supermix (BioRad, Hercules, CA), according to the manufacture's protocol.
2.4. Plasma RNA Isolation, miRNA Expression Analysis and Normalizer Identification
RNA isolation was performed on 100 μl of stored plasma collected on citrate with Norgen kit (Norgen Biotek, Thorold, Canada); the RNA extraction from the CLL plasma was performed by using Trizol reagent (Life Technologies, Carlsbad, CA). MiRNA expression was measured with the TaqMan miRNA qRT-PCR methods (Life Technologies, Carlsbad, CA) and all reactions were run in duplicate. The expression of a miRNA relative to the endogenous control miR-16 was determined using the 2− ΔCt method (fold change). If expression values for the endogenous control or for a specific miRNA were not obtained after 40 cycles of amplification in two successive experiments in duplicate wells, then the specific values were considered unavailable. Expression levels for miR-16 were similar for all groups of plasma samples (Fig. S3).
2.5. EBNA-1 IgG Enzyme-Linked Immuno Sorbent Assay (ELISA)
In order to verify the EBV serological status of healthy individuals and patients with CLL, the EBNA-1 IgG ELISA assay was performed on plasma samples according to manufacturer's instructions (Fisher Scientific, Carlsbad, CA). Briefly, the 96-well Diamedix ELISA plates were coated with purified recombinant (E. coli as vector) EBNA-1 antigen. Plasma from patients, healthy individuals, negative and positive controls was diluted 1:21 in a phosphate buffer. The plates were treated with goat-anti-human IgG linked to horseradish peroxidase (HRP) and color was developed with 3, 3′, 5, 5′ tetramethylbenzidine TMB solution. The optical density (OD) was read at 450 nm within 60 min from the completion of the reaction.
The cut-off calibrator, a blank sample, the positive and the negative controls were included in each test run. The cut-off calibrator was run in triplicate. The OD450 index value of each well was calculated as the ratio between absorbance of the sample and mean absorbance of the cut-off calibrator according to the manufacturer's instructions.
2.6. EBV-DNA Quantitative PCR
DNA was extracted from 143 CLL patients with the QIAamp® DNA Mini Kit (Qiagen, ND). Quantitative end point PCR was performed on 8 ng of DNA, using the SsoFast Universal Probe Mix (Bio-Rad, Hercules, CA) in a CFX384 Real-Time System (BioRad, Hercules, CA) according to the manufacturer's instructions. The following primers and probes were used: Primer EBV W-F: GCA-GCC-GCC-CAG-TCT-CT, Primer EBV W-R: ACA GAC AGT GCA CAG GAG CCT, Probe EBV BamHIW: 6FAMAAAAGCTGGCGCCCTTGCTAMRA. Endpoint analysis was carried out with the CFX Manager Software (v3.1) (BioRad, Hercules, CA) with the following parameters: 2 end cycles to average and a percentage of range of − 10. The Applied BiosystemsTaqMan® Exogenous Internal Positive Control (Life Technologies, Carlsbad, CA) was used as an internal control to distinguish true negative results from PCR inhibition according to the manufacturer's recommendations. Samples were determined to be positive for EBV DNA expression if the RFU exceeded the cut-off of 249 RFU, which was determined by the CFX Manager Software.
2.7. MiRNA In Situ Hybridization (miRNA ISH) and Immunohistochemistry
The miRNA-ISH was carried out as reported elsewhere (Nishimura et al., 2013). Briefly, double digoxigenin labeled locked nucleic acid probes antisense to BHRF1-1 and miR-155 (Exiqon, Vedbaek, Denmark) (Fig. S4) were hybridized on tissue sections for 3 h at 55 °C. Detection was accomplished with anti-DIG alkaline phosphate Fab fragment followed by nitro blue tetrazolium chloride/5-bromo-4-chloro-3-indolyl phosphate (NBT/BCIP) color development (Ventana, Roche, Basel, CH). Each case was tested for U6 probe reactivity as a positive control and the U6 staining was used as normalizer. The scrambled-miRNA probe (Exiqon Vedbaek, Denmark) was chosen as a negative control for staining.
Additionally, standard ISH for EBER-1 was performed using INFORM probes (Ventana, Roche, Basel, CH) according to the manufacturer's protocol. To detect LMP-1, paraffin-embedded sections were treated with ER1 citrate buffer (pH, 6.0) for 5 min at 100 °C and incubated with diluted primary mouse monoclonal antibody CS1-4 (anti-LMP-1; Dako, Glostrup, Denmark). For detection, the sections were treated with poly HRP anti mouse and anti-rabbit IgG secondary antibodies (BioRad, Hercules, CA) after treatment with 0.1 mol/L citrate buffer (pH, 6.0) for 7 min at 120 °C.
For EBER ISH, cases were scored as positive when nuclei showed positivity that was absent in the negative control. A positive control was included in each experiment. Positivity for LMP-1 was defined by the detection of immunoreactivity that was not present in the negative control.
2.8. Construction of BHRF1-1 Lentivirus, Infection of Primary Malignant B Cells from CLL Patients and TP53 Measurement by Western Blot
We constructed a lentivirus expressing BHRF1-1, the pMIRNA1–BHRF1-1 and the pMIRNA1–Empty Vector provided in E. coli bacterial stock form plated on LB-carbenicillin at 50 μg/ml (System Biosciences). The viral particles were obtained with the protocol from the System Biosciences User Manual, using the 293-TN cell line and pPACKH1 Lentivector Packaging Kit (System Biosciences). Virus pellets were resuspended in DMEM and stored in cryovials at − 80 °C until use.
Primary malignant B cells from serial patients with CLL collected before treatment in the Leukemia Department at MD Anderson Cancer Center were infected with the pMIRNA1–BHRF1-1 lentivirus with an efficiency of approximately 50% as determined by green fluorescent protein measurement by flow cytometry. Empty lentivirus (LVEV, lentivirus empty vector) was used as a negative control for the experiments.
After 96 h from infections, the protein extracts were prepared in ice-cold RIPA lysis buffer 1 × (Santa Cruz Biotechnology) containing phenylmethylsulfonyl fluoride (PMSF), sodium orthovanadate and protease inhibitor cocktail, or in 1 × Lysis buffer (Cell Signaling) supplemented with protease and phosphatase inhibitor (Sigma-Aldrich) according to the manufacturer's instructions.
Total protein (50 μg) was electrophoresed on Criterion TGX Stain Free Precast Gels (Bio-Rad Laboratories) and electroblotted onto pure PVDF or nitrocellulose membranes (Trans-Blot Transfer Turbo midi-format 0.2 μm; Bio-Rad Laboratories) with the Trans Blot Turbo System (Bio-Rad Laboratories). Membrane blocking and antibody incubation were performed according to the Cell Signaling Western Immunoblotting Protocol, and antigen–antibody reactions were detected with SuperSignal West Femto reagents (Thermo Scientific). We used the primary antibodies anti-TP53DINP1 rabbit polyclonal antibody (OriGene) and the anti-Actine antibody as normalizer.
2.9. Statistical Analysis
All statistical analyses were performed in R (version 3.0.1). All tests were two-sided and considered statistically significant at the 0.05 level. The Shapiro–Wilk test was applied to determine whether data followed a normal distribution. The t-test or analysis of variance followed by the post-hoc Tukey test (depending on the number of groups considered) was applied to normally distributed data; otherwise, the Mann–Whitney–Wilcoxon test or Kruskal–Wallis test followed by a post-hoc Nemenyi test was applied to assess the relationship between miRNA expression and clinical parameters. The Spearman correlation test was applied to measure the strength of the association between the variables. For each cohort, we checked for a relationship between miRNA expression and overall survival as follows. Patients were grouped into percentiles according to miRNA expression. The Log-rank test was employed to determine the association between miRNA expression and overall survival (OS). The Kaplan–Meier method was used to generate OS curves. The cut-off to optimally separate the patients into low/high miRNA (log-rank test p-value minim) was chosen. The relationship between OS and covariates (miRNA expression levels and known prognostic factors or other clinical parameters, such as CD38, IGVH mutation status and ZAP70 expression) was examined using a Cox proportional hazard model. Neither FISH (high rate of missing data) nor Rai stage (few cases in the high risk group) were considered in the models. Only the factors that were statistically significant via univariable regression analyses were included in the final multivariable regression model.
3. Results
3.1. Small RNA-sequencing and qRT-PCR Identified EBV miRNAs Expression in Peripheral Blood B-cells
By small RNA-sequencing we identified the presence of EBV miRNAs in the malignant CLL B-cells (n = 34 samples) as well as in normal B-cells (n = 14 samples) (Fig. 1A–B). Sixteen different viruses out of twenty-seven screened, were found by small-RNA sequencing (Fig. 1C). The vast majority (97%) of viral reads were from herpes gamma virus (EBV and Rhesus lymphocryptovirus). In order to confirm the sequencing results, we performed qRT-PCR on 12 samples (8 patients with CLL and 4 healthy individuals) and 3 EBV-positive cell lines (MEC1, MEC2 and Raji) as controls. The expression of 26 different EBV miRNAs, including the miRNAs identified by small RNA sequencing, was evaluated (Table S2 and Fig. S1). We found that BART-4 and BHRF1-1 miRNAs were expressed both in small RNA sequencing and at less than 35 cycles in qRT-PCR (mean cycle threshold [Ct] in CLL samples 25.16, SD = 1.08 and 34.1, SD = 2.09 respectively) and further focused on the study of these two EBV miRNAs.
Fig. 1.

Small RNA-sequencing data on B-cells from normal individuals and patients with CLL. Both in B-cells from normal individuals (A) and patients with CLL (B), more than 50% of reads that mapped to the viral genomes were attributed to the EBV genome. A total of 21 EBV miRNAs were found with BART9 being the highest expressed (3645 reads) to BART12 and BHRF1-1 the lowest ones (1 read). Reads from 15 viruses other than EBV were found by RNAseq (C).
3.2. 5S rRNA in B-cells and miR-16 in Plasma Showed Stable Expression in Normal Individuals and Patients with CLL
We then tested the levels of various non-coding RNAs as normalizer including U6 snRNA, U18 snRNA, U48 snRNA, 5S rRNA and 18S rRNA, as previously described (Ferrajoli et al., 2013). Among them, 5S rRNA showed the most stable expression comparing normal and CLL B-cells, both in training and validation sets (Fig. S2) and therefore we decided to use this as the reference gene. For the plasma analysis, we initially performed qRT-PCR to amplify 2 genes previously used as normalizers in prior studies we conducted using plasma, miR-192 and miR-16 (Cortez et al., 2011, Pritchard et al., 2012, Vasilescu et al., 2009). Mir-16 was expressed at high levels in all samples (mean Ct = 25.4, SD = 1.68), whereas miR-192 was expressed at low levels in about 86% of samples (mean Ct = 33.19, SD = 1.20). However, the miR-16 chromosomal locus (13q14) is deleted or silenced in a consistent proportion of patients with CLL. As we previously published (Ferrajoli et al., 2013), in order to confirm the validity of miR-16 as normalizer we analyzed the miR-16 expression levels between cytogenetic subgroups; in our cohort, no significant differences were observed, depending on FISH abnormalities. These results allowed us to use miR-16 as the sole normalizer according to the published qRT-PCR MIQE guidelines (Fig. S3) (Bustin et al., 2009).
3.3. BHRF1-1 miRNA is Expressed at High Level in Plasma of Patients with CLL and Positively Correlated with miR-155 Expression
The plasma levels of a miRNA might not be proportional to the B-cell expression levels because miRNAs are secreted by various cells, including malignant or microenvironment cells. We previously reported miR-155 overexpression in the plasma of patients with CLL and its correlation to a poor response to therapy (Ferrajoli et al., 2013). Thus, to verify if EBV miRNAs are also detectable in the plasma of patients with CLL, we extended the analysis of the two previously chosen viral miRNAs (BART4 and BHRF1-1) to plasma samples from 143 patients with CLL (none of them were on any treatment that could explain an EBV reactivation) and 80 normal individuals. We measured BHRF1-1 relative expression levels in the plasma of patients with CLL and normal individuals and found that BHRF1-1 was expressed at significantly higher levels in the plasma of patients with CLL (Fig. 2). We, therefore, evaluated a correlation between plasma BHRF1-1 miRNA levels and certain patient clinical characteristics and found that higher BHRF1-1 levels were associated with higher beta-2-microglobulin level (< 3.3 versus > 3.3 mg/L, p = 0.0008) and more advanced Rai stages (Rai 3–4 versus Rai 0–2, p = 0.001).
Fig. 2.
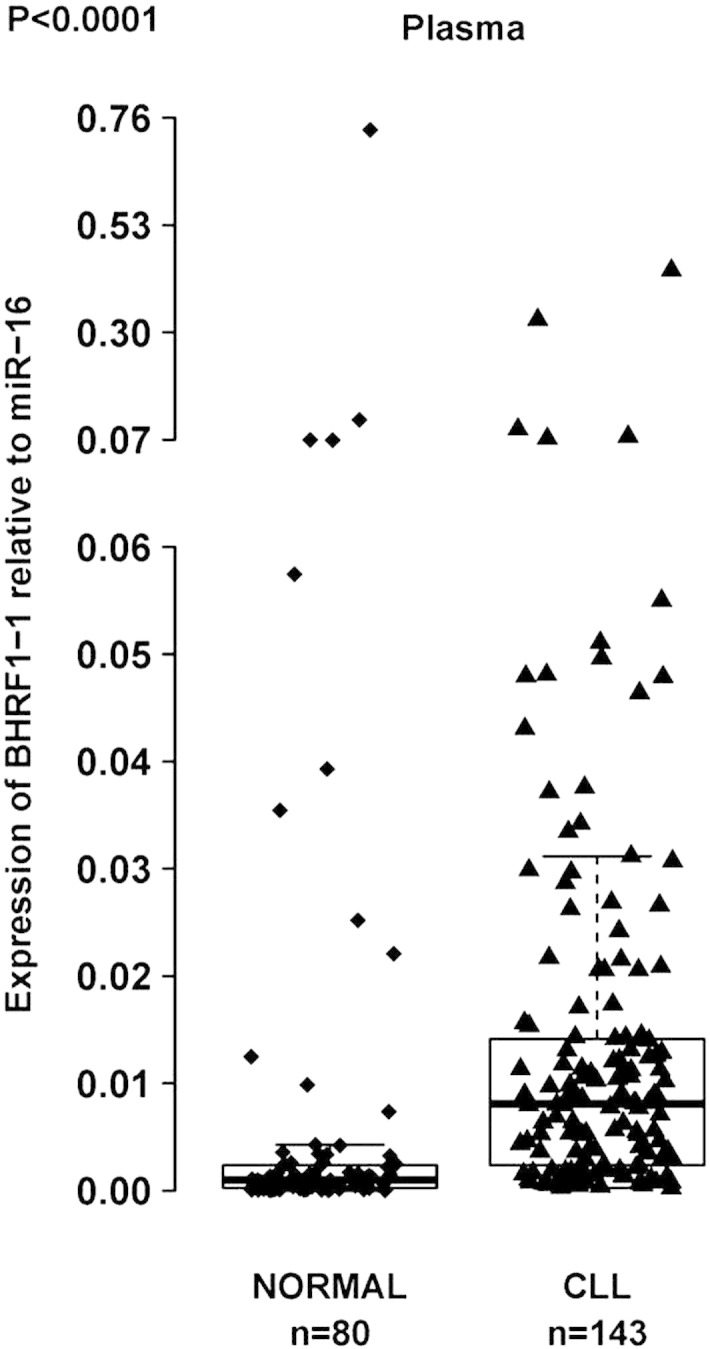
BHRF1-1 relative expression levels in plasma of patients with CLL and normal individuals. BHRF1-1 levels were measured in plasma of 143 patients with CLL. The expression of BHRF1-1 relative to the endogenous control miR-16 was determined using the 2− ΔCt method (fold change). BHRF1-1 levels are significantly higher in patients with CLL than in normal individuals.
We studied BHRF1-1 relative expression levels in B-cells of healthy individuals and patients with CLL and found similar relative expression levels between these two groups (p = 0.5933). We also evaluated the expression levels of BART4 miRNA in B-cells and found a non-significant trend for lower levels in B-cells between normal individuals versus patients with CLL (p = 0.0856). Similarly, we found no difference in BART4 expression in the plasma of normal individuals when compared to the plasma of patients with CLL (p = 0.6849).
Because of the possible role of EBV genes in inducing miR-155 (Lu et al., 2008), we compared miR-155, BART4 and BHRF1-1 expression levels in B-cells and plasma. We found a highly significant positive association between miR-155 and BHRF1-1 expression levels in plasma of patients with CLL (Spearman correlation coefficient 0.43, p < 0.0001).
3.4. BHRF1-1 miRNA is Expressed in both EBNA-1 IgG Seronegative and Seropositive Patients
We evaluated evidence of prior EBV infection in patients and healthy individuals using an established ELISA techniques used in clinical laboratories, the EBNA-1 IgG ELISA. The presence of EBNA-1 IgG is usually consistent with past infection and the majority of normal individuals older than 40 years (89 · 5–100%) are positive for this specific antibody (Rickinson, 2001). Among the previously described 143 untreated patients, the mean values for IgG, IgA or IgM were 725 (89–2190 mg/dL), 89 (7–561 mg/dL), and 51 (4–438 mg/dL) respectively. None of the patients had ongoing infections at the time of sample collection and all patients tested negative for active hepatitis B or C, HIV or HTLV infections. All but one healthy individual showed EBNA-1 IgG positivity (OD450 nm > 1.10). Similarly, 6 out of 143 patients with CLL (4%) were negative (OD450 nm < 0.9) and 6 (4%) revealed an equivocal test result (OD450 nm ranging between 0.9 and 1.09) (Fig. 3A). Two patients out of the six who were negative by EBNA-1 ELISA, had total IgG levels below the lower normal value (570 and 252 mg/dL with normal range between 624–1680 mg/dL).
Fig. 3.

BHRF1-1 relative expression in plasma of patients with CLL according to EBNA-1 IgG status (A) and EBV-DNA qPCR (B). The ELISA assay is expressed in OD450 nm ratio (absorbance of the sample/mean absorbance of the cut off calibrator) and the test was considered negative if the OD450 ratio was less than 0.9 or positive for values greater or equal to 1 · 10. For OD450 ratios between 0.9 and 1.09, the test was considered equivocal according to manufacturer's instructions (A). Expression of BHRF1-1 and BART4 was found in the plasma of patients with a negative and equivocal test for EBV EBNA-1 IgG (C and D). The red dot in panel C and D localizes the patient 116 with the positive EBV-DNA test in the plot-graphs of miR BHRF1-1 and BART4 plasma expression levels, showing the presence of these two miRNAs.
We wondered whether the EBV immunological status correlated with the expression levels of viral miRNAs and whether the absence of past infection by EBV could predict lower or absent expression of viral miRNAs. Surprisingly, not only patients with positive EBNA-1 IgG, but also patients with a negative or equivocal EBNA-1 IgG test were found to express BHRF1-1 (EBNA-1 IgG negative cases, BHRF1-1 mean expression levels = 30.99; SD = 1.33; equivocal cases, mean = 32.71; SD = 1.22; positive cases, mean = 32.65; SD = 1.78) (Fig. 3B). The finding that BHRF1-1 is expressed also in samples from patients who tested negative for EBV infection was confirmed in a second group of 46 patients with CLL (negative EBNA-1 IgG cases, mean BHRF1-1 expression levels = 32.16, SD = 1.19; positive cases, mean = 33.5, SD = 1.58) (Fig. S5). Furthermore, we found that patients who were negative or equivocal for EBV infection expressed BART4, although there was no significant difference among the three different groups (EBNA-1 IgG negative cases, mean BART4 expression levels = 26.41; SD = 0.18; EBNA-1 IgG equivocal cases, mean = 26.72; SD = 0.22; EBNA-1 IgG positive cases, mean = 26.61, SD = 0.36 in group 1; EBNA-1 IgG negative cases, mean BART4 expression levels = 29.25; SD = 0.65; positive, mean = 29.34, SD = 0.43 in group 2) (Figs. 3C and S5). All together, we identified plasma from 15 patients with CLL that when ELISA results are negative or equivocal for the EBV infection, the qRT-PCR for an EBV viral miRNA that has no homology with any human miRNA and therefore cannot cross-hybridize with human miRNAs, show detectable expression (EBNA-1 IgG negative cases, mean BHRF1-1 expression levels = 31.38; SD = 1.34; EBNA-1 IgG equivocal cases, mean = 32.71; SD = 1.22 in group 1 plus 2; EBNA-1 IgG negative cases, mean BART4 expression levels = 27.35; SD = 1.46; EBNA-1 IgG equivocal cases, mean = 26.72; SD = 0.22 in group 1 plus 2).
Although none of the 143 patients had ongoing infections at the time of sample collection, in order to exclude that the expression of EBV miRNAs in patients with CLL could be determined by the occurrence of “active” EBV infection and that the seronegativity for EBNA-1 IgG was depending on a disease-related immunodeficiency, we performed EBV-DNA q-PCR (Fig. 3D). All patients tested negative, with the exception of one patient that had an EBV-viral load slightly above the threshold. This patient had no clinical signs or laboratory signs of EBV infection.
3.5. MiRNA In Situ Hybridization (miRNA-ISH) Confirmed the Presence of EBV miRNAs and miR-155 in Bone Marrow Cells of Patients with CLL
In view of the pattern of differential BHRF1-1 miRNA expression among healthy donors and patients with CLL using qPCR and of the significantly higher expression of BHRF1-1 in patients with no apparent previous infection by EBV, we performed miRNA-ISH in 29 bone marrow biopsies from patients with CLL as an additional validation method. Furthermore, we evaluated miR-155 by ISH in the same bone marrow biopsy sample as we have previously reported that miR-155 is expressed in patients with CLL (Ferrajoli et al., 2013). U6 was chosen as normalizer as we expected to see no variation in staining intensity because it is constitutively transcribed in majority of human cells. The scrambled-miRNA probe was used as a negative control. B-cells in all cases were found to be positive for BHRF1-1 and miR-155 ISH with a more consistent positivity for BHFR1-1 (twice stronger intensity compared with miR-155) (Figs. 4 and S6 and S7).
Fig. 4.

MiRNA In Situ Hybridization (miRNA-ISH) and Immunohistochemistry (IHC) in bone marrow biopsies. The panel shows the results of in situ hybridization with U6 (A), scrambled-miRNA control probes (B), BHRF1-1 (C) and miR-155 (D) (Nikon Microphot-FXA, × 100). BHRF1-1 ISH was diffusely positive (red arrows). E and F showed the results of Hematoxylin&Eosin and LMP-1 staining: the megakaryocyte, as well as scattered small mononuclear cells in the bone marrow show weakly positive immunoreactivity for LMP-1 (blue arrow) (Olympus BX40, Hematoxylin&Eosin × 200 [panel G], LMP-1 immunostain with hematoxylin counterstain × 400 [panel H]).
In Hodgkin lymphoma, LMP-1 is as informative as EBER for determining if a given case is EBV related or not (Herbst et al., 1991). In our series, although all cases were scored negative for EBER and LMP-1 according to standard criteria (data not shown), 2 out of the 10 cases showed the presence of few positive cells for LMP-1 immunostaining; and in one case, LMP-1 was identified in megakaryocytes (Figs. 4 and S8).
3.6. BHRF1-1 Relative Expression in B-cells is Associated with Unfavorable Prognostic Markers and Shorter Overall Survival
In order to investigate the potential impact of BHRF1-1 on disease evolution and progression, we wondered whether BHRF1-1 influenced OS. In 93 patients with CLL (training set), overexpression of BHRF1-1 in B-cells was associated with shorter OS (p = 0.001, Fig. 5A). The ability of BHRF1-1 expression in B-cells to predict outcome was also evaluated in a separate group (validation set) of 54 patients. Within this cohort we confirmed that higher BHRF1-1 relative expression levels in B-cells correlated with an inferior outcome (p = 0.0331, Fig. 5B).
Fig. 5.

Kaplan–Meyer survival curves in patients with CLL according to the relative expression levels of BHRF1-1. Patients with high relative expression levels (cut-offs = 0.58 and 0.31 in the training and validation set, respectively) of BHRF1-1 in B-cells (red line) show a significantly shorter overall survival from those with low levels of BHRF1-1 (blue line) (p = 0.001 and p = 0.03 in the training and in the validation set, respectively). The red and the blue values below the curves represent patients at risk at the specified time points.
Finally, IGHV, ALC, and relative expression of BHRF1-1 were the statistically significant factors, from the univariate Cox proportional hazards models, which were included in the final multivariate analysis of OS. Patients with high BHRF1-1 expression levels had an increased estimated risk of death when compared to those with low relative expression (hazard ratio [HR] = 5.947; 95% confidence interval [CI] = 1.86, 19.015, p = 0.002). Similar result was observed for IgVH mutation status (HR = 3.22; 95% CI = 1.16, 8.91, p = 0.0342) (Table 2) (Hamblin et al., 1999, Damle et al., 1999).
Table 2.
Cox Proportional Hazards Multivariate Regression analysis of overall survival in patients with CLL according to BHRF1-1 expression levels in B-cells.
| Variable | Univariate |
Multivariate |
||
|---|---|---|---|---|
| HR (95% CI) | p-Value | HR (95% CI) | p-Value | |
| ZAP70 (positive vs negative) | 0.56 (0.112, 2.76) | 0.4735 | ||
| CD38 (positive vs negative) | 0.97 (0.35, 2.73) | 0.958 | ||
| IGHV (UM vs M) | 3.22 (1.16, 8.91) | 0.0246 | 3.63 (1.1, 11.99) | 0.0342 |
| ALC (maximum value) | 1.01 (1.002, 1.015) | 0.0165 | 1.01 (0.998, 1.01) | 0.2264 |
| BHRF1-1 (high vs low (cut-off = 0.58)) | 5.09 (1.67, 15.47) | 0.0041 | 5.947 (1.86,19.015) | 0.0026 |
Abbreviations: HR, Hazard Ratio; CI, confidence interval; UM, unmutated; M, mutated; ACL, absolute lymphocyte count; CLL, chronic lymphocytic leukemia, IGHV, immunoglobulin heavy chain variable region.
3.7. Infection of CLL B cells with BHRF1-1 Reduce the Levels of TP53 Protein in most Cases
To start understanding the mechanisms that could explain the clinical correlations with OS identified for BHRF1-1 miRNA, we performed a literature search of proved protein coding targets and identified that in nasopharyngeal cancer cells the TP53 tumor suppressor gene was proved as a BHRF1-1 target (Li et al., 2012). This is of great interest, as CLL cases with deletion of the chromosome 17 locus harboring TP53 are well known to have a significantly poorer survival respect to the non-deleted cases (Calin and Croce, 2009, Fabbri and Croce, 2011). Therefore, we infected the primary malignant B cells from patients with CLL without TP53 deletion with a lentiviral construct expressing BHRF1-1 and measured by Western blot the levels of TP53 protein. Of note, by using a threshold of at least 20% variation, in ten out of the seventeen (59%) analyzed cases we identified variable reduction in the levels of TP53 protein, while in 4 cases we identified an increase and in the remaining three no changes. This explains at least in part, why in the majority of cases the poorer survival of CLL patients correlates with high levels of BHRF1-1 miRNA (Figs. 6 and S9).
Fig. 6.

Examples of the levels of TP53 after infection of B cells from CLL patients with BHRF1-1 lentivirus. (A) The Western blots of TP53 and beta actin as a normalizer. (B) Quantification of protein expression done with Adobe Photoshop CS6. The full set of data from the 17 analyzed patients are presented in Supplementary Fig. 9. The cytogenetics data and the levels of BHRF1-1 expression after infection are also presented.
4. Discussion
In this study, we show that the expression level of EBV BHRF1-1 in patients with CLL was predictive of shorter OS. This predictive power was retained even when common prognostic factors were included in the multivariate analysis. We also confirmed the ability of BHRF1-1 expression levels to define outcome in a validation group of patients with relapsed CLL, which included patients with very high-risk disease. Furthermore, BHRF1-1 plasma levels were associated with high tumor burden markers, namely elevated beta-2-microglobulin and advanced Rai stages suggesting a possible role of this non-human miRNA in the events that lead to CLL progression.
We document the expression of EBV viral miRNAs by three independent methods, small RNA sequencing, qRT-PCR and miRNA-ISH in malignant B cells, plasma and bone marrow biopsies of patients with CLL. It is noteworthy that more than 90% of adults older than 40 years are EBV positive (Rickinson, 2001). We also found that only one healthy donor and 4% of patients with CLL had negative EBNA-1 IgG titers. Furthermore, we observed that BHRF1-1 expression levels in plasma from untreated CLL patients are significantly higher than in plasma of healthy donors. This result is in apparent contradiction with the absence of similar findings in leukemic B-cells. However, EBV infects not only B lymphocytes, but also epithelial cells, smooth muscle cells, T- and NK- cells which can eventually release it into the plasma via microvesicles (Jochum et al., 2012); this phenomenon is likely to explain the discrepancy between plasma and B-cell expression levels in patients with CLL. An alternative explanation is that malignant B cells are actively secreting microvesicles and/or exosomes that contain viral miRNAs (Ghosh et al., 2010). Interestingly, none of the seronegative (EBNA-1 IgG) patients had an EBV-DNA load above the threshold of positivity, suggesting that the presence of EBV-miRNAs could not be explained by the onset of active infection and/or the absence of EBV-specific immunoglobulin due to CLL-related defects of antibody response.
Another interesting finding of our study was that patients who apparently did not experienced EBV infection express BHRF1-1 and BART4 miRNAs. This finding was confirmed in two different groups of patients with CLL (Figs. 3D and S5). However, none of the patients showed a clear positivity for LMP-1 and EBER staining on their respective bone marrow specimens. LMP-1 mRNA has been shown to be expressed in a significant proportion of patients with CLL and to correlate with the degree of bone marrow involvement (Tarrand et al., 2010). However, unlike the study reported by Tarrand et al. where serum levels or mRNA were measured, we evaluated LMP-1 expression by IHC directly on bone marrow specimens. In addition, expression of BHRF1-1 and miR-155 by miRNA-ISH was found diffusely positive in bone marrow specimens from patients.
Based on our experience, the measurement of miRNAs (by RT-PCR and/or miRNA-ISH) may represent a more sensitive method to detect viral components compared with assays detecting viral proteins only (ELISA and IHC). In order to exclude that the positive results could be attributed to the presence of human miRNAs with a homologous sequence, we performed a search within the NCBI database using the BLAST algorithm and did not find a human miRNA with an identical sequence for BHRF1-1. Next, we found a positive correlation in the studied patients between the plasma levels of miR-155 and those of BHRF1-1 miRNA. We have previously reported that miR-155 is a marker of the risk of progression from monoclonal B cell lymphocytosis (MBL) to CLL and a predictor of response to treatment (Ferrajoli et al., 2013).
Although DNA sequences were previously identified in the plasma of patients with various cancers, this is the first study to identify an EBV-associated miRNA in the plasma of patients with CLL (Ghosh et al., 2010). These findings support the possibility that EBV miRNA(s) released by infected cells could be taken up by CLL cells or other cells and affect the gene expression levels in the new “host” cells. It is known that patients with CLL can produce microvesicles (Jochum et al., 2012) as well as exosomes (N Kay, personal communication) and have increased levels of microvesicles in their plasma. Our findings support the possibility that leukemic B-cells can have effective cross talk and exchange of cellular contents with other neighboring cells. Furthermore, this potential interaction expands our understanding of the way CLL may be initiated: “latent” EBV-infected cells communicate with the surrounding cells and the microenvironment by releasing pathogenetic viral miRNAs and induction of the expression of miR-155 as well as other oncogenic cellular miRNAs that affect cell survival and apoptosis. Furthermore, cellular protein coding genes such as TP53 are targets of EBV viral miRNAs. The fact that TP53 level is reduced after BFRF1-1 infection in primary culture of malignant B-cells from the majority of cases but not in all, suggest that other cancer genes involved in the BHRF1-1 signaling pathway have to be identified. However several factors, other than miRNAs, could explain the role of EBV in the pathogenesis of CLL. For example, in the elderly a significantly greater frequency of EBV-specific CD8+ T-cells has been noted along with a lower frequency of EBV antigen-specific interferon-gamma-producing T-cells (Ouyang et al., 2003). Thus, it is possible that an abnormal response to EBV stimuli favors a robust burst of B clones that are EBV-driven, especially in an older individual.
Our observation that all the patients with CLL express EBV miRNAs at high levels and therefore experienced infection with the virus is an interesting finding. The mechanism(s) behind this miRNA expression are under evaluation in our laboratory and once deciphered will help us to better understand the EBV viral cycle. Furthermore, if confirmed in large prospective studies, our data will support the introduction in clinical practice of miRNA-related EBV diagnostic tests.
In conclusion, the increased expression levels of specific EBV miRNAs in patients with CLL and their correlation with survival suggest a possible role of EBV miRNAs in CLL disease progression. The presence of the EBV genome in cells other than B lymphocytes may explain the discrepancy in relative expression of BHRF1-1 between B-cells and plasma. Further studies are required to prospectively validate our findings and to discover further targets of EBV miRNA in CD19/CD5 B-cells in order to better define the molecular mechanism(s) through which EBV miRNAs contribute to CLL.
Acknowledgments
Dr Calin is The Alan M. Gewirtz Leukemia & Lymphoma Society Scholar. Work in Dr. Calin's laboratory is supported in part by the NIH/NCI grants 1UH2TR00943-01 and 1 R01 CA182905-01, the UT MD Anderson Cancer Center SPORE in Melanoma grant from NCI (P50 CA093459), Aim at Melanoma Foundation and the Miriam and Jim Mulva research funds, the Brain SPORE (2P50CA127001), the Center for Radiation Oncology Research Project, the Center for Cancer Epigenetics Pilot project, a 2014 Knowledge GAP MDACC grant, a CLL Moonshot pilot project, the UT MD Anderson Cancer Center Duncan Family Institute for Cancer Prevention and Risk Assessment, a SINF grant in colon cancer, the Laura and John Arnold Foundation, the RGK Foundation and the Estate of C. G. Johnson, Jr. This research was partially supported by the P01-CA81534 and the CLL Research Consortium to Drs. Rassenti and Kipps. Dr. Kay is the recipient of NCI research award CA95241 and support from the CLL Research Consortium and the CLL Global Foundation. Dr. Shanafelt is a Clinical Scholar of the Leukemia and Lymphoma Society. Dr Van Roosbroeck was a Henri Benedictus Fellow of the King Baudouin Foundation and the Belgian American Education Foundation (B.A.E.F.). Dr Ciccone was supported by AIL-Associazione Italiana contro le Leucemie Sezione di Ferrara.
We dedicate this study to the memory of our collaborator Susan Lerner, who played a fundamental role in the development of microRNA CLL research program at MDACC. We thank Dr Richard Julian Jones from MDACC for the critical reading of the manuscript and helpful comments.
Authorship Contributions
Study concept and design: AF, MK, GAC.
Acquisition of data: AF, MC, MS, YK, MO, LDA, JQ, NN, KGR, LZR, KVR, JTM, YY, XZ, TDS, WGW, SS, JJT, ZE, HL, MN, TJK, NEK, MK, GAC.
Analysis and interpretation of data: AF, MK, NEK, GAC.
Statistical analysis: CI, KGR, MR.
Administrative, technical, or material support: MS, SL.
Drafting of the manuscript: AF, MC, MK, GAC.
All authors critically reviewed the manuscript and approved the final version.
Role of Funding Source
The funders had no role in study design, data collection, data analysis, interpretation, writing of the report.
Footnotes
Conflict-of-interest disclosure: the authors declare no competing financial interest.
Supplementary data to this article can be found online at http://dx.doi.org/10.1016/j.ebiom.2015.04.018.
Contributor Information
Michael Keating, Email: mkeating@mdanderson.org.
George A. Calin, Email: gcalin@mdanderson.org.
Appendix A. Supplementary data
Supplementary material.
References
- Amoroso R., Fitzsimmons L., Thomas W.A., Kelly G.L., Rowe M., Bell A.I. Quantitative studies of Epstein–Barr virus-encoded microRNAs provide novel insights into their regulation. J. Virol. 2011;85(2):996–1010. doi: 10.1128/JVI.01528-10. (Jan, PubMed PMID: 21068248. Pubmed Central PMCID: 3020024) [DOI] [PMC free article] [PubMed] [Google Scholar]
- Arrand J.R., Rymo L. Characterization of the major Epstein–Barr virus-specific RNA in Burkitt lymphoma-derived cells. J. Virol. 1982;41(2):376–389. doi: 10.1128/jvi.41.2.376-389.1982. (Feb, PubMed PMID: 6281455. Pubmed Central PMCID: 256768) [DOI] [PMC free article] [PubMed] [Google Scholar]
- Barth S., Pfuhl T., Mamiani A., Ehses C., Roemer K., Kremmer E. Epstein–Barr virus-encoded microRNA miR-BART2 down-regulates the viral DNA polymerase BALF5. Nucleic Acids Res. 2008;36(2):666–675. doi: 10.1093/nar/gkm1080. (Feb, PubMed PMID: 18073197. Pubmed Central PMCID: 2241876) [DOI] [PMC free article] [PubMed] [Google Scholar]
- Bustin S.A., Benes V., Garson J.A., Hellemans J., Huggett J., Kubista M. The MIQE guidelines: minimum information for publication of quantitative real-time PCR experiments. Clin. Chem. 2009;55(4):611–622. doi: 10.1373/clinchem.2008.112797. (Apr, PubMed PMID: 19246619) [DOI] [PubMed] [Google Scholar]
- Cai X., Schafer A., Lu S., Bilello J.P., Desrosiers R.C., Edwards R. Epstein–Barr virus microRNAs are evolutionarily conserved and differentially expressed. PLoS Pathog. 2006;2(3) doi: 10.1371/journal.ppat.0020023. (Mar, PubMed PMID: 16557291. Pubmed Central PMCID: 1409806) [DOI] [PMC free article] [PubMed] [Google Scholar]
- Calin G.A., Croce C.M. Chronic lymphocytic leukemia: interplay between noncoding RNAs and protein-coding genes. Blood. 2009;114(23):4761–4770. doi: 10.1182/blood-2009-07-192740. (Nov 26, PubMed PMID: 19745066. Pubmed Central PMCID: 2786287) [DOI] [PMC free article] [PubMed] [Google Scholar]
- Campo E., Swerdlow S.H., Harris N.L., Pileri S., Stein H., Jaffe E.S. The 2008 WHO classification of lymphoid neoplasms and beyond: evolving concepts and practical applications. Blood. 2011;117(19):5019–5032. doi: 10.1182/blood-2011-01-293050. (May 12, PubMed PMID: 21300984. Pubmed Central PMCID: 3109529) [DOI] [PMC free article] [PubMed] [Google Scholar]
- Choy E.Y., Siu K.L., Kok K.H., Lung R.W., Tsang C.M., To K.F. An Epstein–Barr virus-encoded microRNA targets PUMA to promote host cell survival. J. Exp. Med. 2008;205(11):2551–2560. doi: 10.1084/jem.20072581. (Oct 27, PubMed PMID: 18838543. Pubmed Central PMCID: 2571930) [DOI] [PMC free article] [PubMed] [Google Scholar]
- Cortez M.A., Bueso-Ramos C., Ferdin J., Lopez-Berestein G., Sood A.K., Calin G.A. MicroRNAs in body fluids — the mix of hormones and biomarkers. Nat. Rev. Clin. Oncol. 2011;8(8):467–477. doi: 10.1038/nrclinonc.2011.76. (Aug, PubMed PMID: 21647195. Pubmed Central PMCID: 3423224) [DOI] [PMC free article] [PubMed] [Google Scholar]
- Crespo M., Bosch F., Villamor N., Bellosillo B., Colomer D., Rozman M. ZAP-70 expression as a surrogate for immunoglobulin-variable-region mutations in chronic lymphocytic leukemia. N. Engl. J. Med. 2003;348(18):1764–1775. doi: 10.1056/NEJMoa023143. (May 1, PubMed PMID: 12724482) [DOI] [PubMed] [Google Scholar]
- Damle R.N., Wasil T., Fais F., Ghiotto F., Valetto A., Allen S.L. Ig V gene mutation status and CD38 expression as novel prognostic indicators in chronic lymphocytic leukemia. Blood. 1999;94(6):1840–1847. (Sep 15, PubMed PMID: 10477712) [PubMed] [Google Scholar]
- Delecluse H.J., Feederle R., O'Sullivan B., Taniere P. Epstein Barr virus-associated tumours: an update for the attention of the working pathologist. J. Clin. Pathol. 2007;60(12):1358–1364. doi: 10.1136/jcp.2006.044586. (Dec, PubMed PMID: 17873116. Pubmed Central PMCID: 2095566) [DOI] [PMC free article] [PubMed] [Google Scholar]
- Dohner H., Stilgenbauer S., Benner A., Leupolt E., Krober A., Bullinger L. Genomic aberrations and survival in chronic lymphocytic leukemia. N. Engl. J. Med. 2000;343(26):1910–1916. doi: 10.1056/NEJM200012283432602. (Dec 28, PubMed PMID: 11136261) [DOI] [PubMed] [Google Scholar]
- Dolken L., Malterer G., Erhard F., Kothe S., Friedel C.C., Suffert G. Systematic analysis of viral and cellular microRNA targets in cells latently infected with human gamma-herpesviruses by RISC immunoprecipitation assay. Cell Host Microbe. 2010;7(4):324–334. doi: 10.1016/j.chom.2010.03.008. (Apr 22, PubMed PMID: 20413099) [DOI] [PubMed] [Google Scholar]
- Fabbri M., Croce C.M. Role of microRNAs in lymphoid biology and disease. Curr. Opin. Hematol. 2011;18(4):266–272. doi: 10.1097/MOH.0b013e3283476012. (Jul, PubMed PMID: 21519241. Pubmed Central PMCID: 3400499) [DOI] [PMC free article] [PubMed] [Google Scholar]
- Fabbri M., Bottoni A., Shimizu M., Spizzo R., Nicoloso M.S., Rossi S. Association of a microRNA/TP53 feedback circuitry with pathogenesis and outcome of B-cell chronic lymphocytic leukemia. JAMA. 2011;305(1):59–67. doi: 10.1001/jama.2010.1919. (Jan 5, PubMed PMID: 21205967. Pubmed Central PMCID: 3690301) [DOI] [PMC free article] [PubMed] [Google Scholar]
- Ferrajoli A., Shanafelt T.D., Ivan C., Shimizu M., Rabe K.G., Nouraee N. Prognostic value of miR-155 in individuals with monoclonal B-cell lymphocytosis and patients with B chronic lymphocytic leukemia. Blood. 2013;122(11):1891–1899. doi: 10.1182/blood-2013-01-478222. (Sep 12, PubMed PMID: 23821659. Pubmed Central PMCID: 37793810) [DOI] [PMC free article] [PubMed] [Google Scholar]
- Ghosh A.K., Secreto C.R., Knox T.R., Ding W., Mukhopadhyay D., Kay N.E. Circulating microvesicles in B-cell chronic lymphocytic leukemia can stimulate marrow stromal cells: implications for disease progression. Blood. 2010;115(9):1755–1764. doi: 10.1182/blood-2009-09-242719. (Mar 4, PubMed PMID: 20018914. Pubmed Central PMCID: 2832808) [DOI] [PMC free article] [PubMed] [Google Scholar]
- Hamblin T.J., Davis Z., Gardiner A., Oscier D.G., Stevenson F.K. Unmutated Ig V(H) genes are associated with a more aggressive form of chronic lymphocytic leukemia. Blood. 1999;94(6):1848–1854. (Sep 15, PubMed PMID: 10477713) [PubMed] [Google Scholar]
- Herbst H., Dallenbach F., Hummel M., Niedobitek G., Finn T., Young L.S. Epstein–Barr virus DNA and latent gene products in Ki-1 (CD30)-positive anaplastic large cell lymphomas. Blood. 1991;78(10):2666–2673. (Nov 15, PubMed PMID: 1668608) [PubMed] [Google Scholar]
- Jochum S., Ruiss R., Moosmann A., Hammerschmidt W., Zeidler R. RNAs in Epstein–Barr virions control early steps of infection. Proc. Natl. Acad. Sci. U. S. A. 2012;109(21):E1396–E1404. doi: 10.1073/pnas.1115906109. (May 22, PubMed PMID: 22543160. Pubmed Central PMCID: 3361417) [DOI] [PMC free article] [PubMed] [Google Scholar]
- Lerner M.R., Andrews N.C., Miller G., Steitz J.A. Two small RNAs encoded by Epstein–Barr virus and complexed with protein are precipitated by antibodies from patients with systemic lupus erythematosus. Proc. Natl. Acad. Sci. U. S. A. 1981;78(2):805–809. doi: 10.1073/pnas.78.2.805. (Feb, PubMed PMID: 6262773. Pubmed Central PMCID: 319891) [DOI] [PMC free article] [PubMed] [Google Scholar]
- Li Z., Chen X., Li L., Liu S., Yang L., Ma X. EBV encoded miR-BHRF1-1 potentiates viral lytic replication by downregulating host p53 in nasopharyngeal carcinoma. Int. J. Biochem. Cell Biol. 2012;44:275–279. doi: 10.1016/j.biocel.2011.11.007. [DOI] [PubMed] [Google Scholar]
- Linnstaedt S.D., Gottwein E., Skalsky R.L., Luftig M.A., Cullen B.R. Virally induced cellular microRNA miR-155 plays a key role in B-cell immortalization by Epstein–Barr virus. J. Virol. 2010;84(22):11670–11678. doi: 10.1128/JVI.01248-10. (Nov, PubMed PMID: 20844043. Pubmed Central PMCID: 2977875) [DOI] [PMC free article] [PubMed] [Google Scholar]
- Lo A.K., To K.F., Lo K.W., Lung R.W., Hui J.W., Liao G. Modulation of LMP1 protein expression by EBV-encoded microRNAs. Proc. Natl. Acad. Sci. U. S. A. 2007;104(41):16164–16169. doi: 10.1073/pnas.0702896104. (Oct 9, PubMed PMID: 17911266. Pubmed Central PMCID: 2042179) [DOI] [PMC free article] [PubMed] [Google Scholar]
- Lu F., Weidmer A., Liu C.G., Volinia S., Croce C.M., Lieberman P.M. Epstein–Barr virus-induced miR-155 attenuates NF-kappaB signaling and stabilizes latent virus persistence. J. Virol. 2008;82(21):10436–10443. doi: 10.1128/JVI.00752-08. (Nov, PubMed PMID: 18753206. Pubmed Central PMCID: 2573162) [DOI] [PMC free article] [PubMed] [Google Scholar]
- Lung R.W., Tong J.H., Sung Y.M., Leung P.S., Ng D.C., Chau S.L. Modulation of LMP2A expression by a newly identified Epstein–Barr virus-encoded microRNA miR-BART22. Neoplasia. 2009;11(11):1174–1184. doi: 10.1593/neo.09888. (Nov, PubMed PMID: 19881953. Pubmed Central PMCID: 2767219) [DOI] [PMC free article] [PubMed] [Google Scholar]
- Marquitz A.R., Mathur A., Nam C.S., Raab-Traub N. The Epstein–Barr Virus BART microRNAs target the pro-apoptotic protein Bim. Virology. 2011;412(2):392–400. doi: 10.1016/j.virol.2011.01.028. (Apr 10, PubMed PMID: 21333317. Pubmed Central PMCID: 3340891) [DOI] [PMC free article] [PubMed] [Google Scholar]
- Navarro A., Gaya A., Martinez A., Urbano-Ispizua A., Pons A., Balague O. MicroRNA expression profiling in classic Hodgkin lymphoma. Blood. 2008;111(5):2825–2832. doi: 10.1182/blood-2007-06-096784. (Mar 1, PubMed PMID: 18089852) [DOI] [PubMed] [Google Scholar]
- Nishimura M., Jung E.J., Shah M.Y., Lu C., Spizzo R., Shimizu M. Therapeutic synergy between microRNA and siRNA in ovarian cancer treatment. Cancer Discov. 2013;3(11):1302–1315. doi: 10.1158/2159-8290.CD-13-0159. (Sep 3. PubMed PMID: 24002999) [DOI] [PMC free article] [PubMed] [Google Scholar]
- Ouyang Q., Wagner W.M., Walter S., Muller C.A., Wikby A., Aubert G. An age-related increase in the number of CD8 + T cells carrying receptors for an immunodominant Epstein–Barr virus (EBV) epitope is counteracted by a decreased frequency of their antigen-specific responsiveness. Mech. Ageing Dev. 2003;124(4):477–485. doi: 10.1016/s0047-6374(03)00026-5. (Apr, PubMed PMID: 12714256) [DOI] [PubMed] [Google Scholar]
- Pritchard C.C., Kroh E., Wood B., Arroyo J.D., Dougherty K.J., Miyaji M.M. Blood cell origin of circulating microRNAs: a cautionary note for cancer biomarker studies. Cancer Prev. Res. 2012;5(3):492–497. doi: 10.1158/1940-6207.CAPR-11-0370. (Mar, PubMed PMID: 22158052) [DOI] [PMC free article] [PubMed] [Google Scholar]
- Rickinson A.B. Epstein–Barr virus. In: Knipe D.M., Howley P.M., Griffin D.E., Martin M.A., Lamb R.A., Roizman B., editors. Field Virology. Lippincott Williams & Wilkins; Philadelphia: 2001. pp. 2575–2627. [Google Scholar]
- Rossi S., Shimizu M., Barbarotto E., Nicoloso M.S., Dimitri F., Sampath D. MicroRNA fingerprinting of CLL patients with chromosome 17p deletion identify a miR-21 score that stratifies early survival. Blood. 2010;116(6):945–952. doi: 10.1182/blood-2010-01-263889. (Aug 12, PMID: 20393129) [DOI] [PMC free article] [PubMed] [Google Scholar]
- Tarrand J.J., Keating M.J., Tsimberidou A.M., O'Brien S., LaSala R.P., Han X.Y. Epstein–Barr virus latent membrane protein 1 mRNA is expressed in a significant proportion of patients with chronic lymphocytic leukemia. Cancer. 2010;116(4):880–887. doi: 10.1002/cncr.24839. (Feb 15, PubMed PMID: 20052729) [DOI] [PubMed] [Google Scholar]
- Tsimberidou A.M., Keating M.J., Bueso-Ramos C.E., Kurzrock R. Epstein–Barr virus in patients with chronic lymphocytic leukemia: a pilot study. Leuk. Lymphoma. 2006;47(5):827–836. doi: 10.1080/10428190500398856. (May, PubMed PMID: 16753866) [DOI] [PubMed] [Google Scholar]
- Vasilescu C., Rossi S., Shimizu M., Tudor S., Veronese A., Ferracin M. MicroRNA fingerprints identify miR-150 as a plasma prognostic marker in patients with sepsis. PLoS One. 2009;4(10) doi: 10.1371/journal.pone.0007405. (PubMed PMID: 19823581. Pubmed Central PMCID: 2756627) [DOI] [PMC free article] [PubMed] [Google Scholar]
- Xia T., O'Hara A., Araujo I., Barreto J., Carvalho E., Sapucaia J.B. EBV microRNAs in primary lymphomas and targeting of CXCL-11 by ebv-mir-BHRF1-3. Cancer Res. 2008;68(5):1436–1442. doi: 10.1158/0008-5472.CAN-07-5126. (Mar 1, PubMed PMID: 18316607. Pubmed Central PMCID: 2855641) [DOI] [PMC free article] [PubMed] [Google Scholar]
- Zuo Z., Calin G.A., de Paula H.M., Medeiros L.J., Fernandez M.H., Shimizu M. Circulating microRNAs let-7a and miR-16 predict progression-free survival and overall survival in patients with myelodysplastic syndrome. Blood. 2011;118(2):413–415. doi: 10.1182/blood-2011-01-330704. (Jul 14, PubMed PMID: 21602527. Pubmed Central PMCID: 3293748) [DOI] [PMC free article] [PubMed] [Google Scholar]
Associated Data
This section collects any data citations, data availability statements, or supplementary materials included in this article.
Supplementary Materials
Supplementary material.