

Abstract
A Gaussian accelerated molecular dynamics (GaMD) approach for simultaneous enhanced sampling and free energy calculation of biomolecules is presented. By constructing a boost potential that follows Gaussian distribution, accurate reweighting of the GaMD simulations is achieved using cumulant expansion to the second order. Here, GaMD is demonstrated on three biomolecular model systems: alanine dipeptide, chignolin folding, and ligand binding to the T4-lysozyme. Without the need to set predefined reaction coordinates, GaMD enables unconstrained enhanced sampling of these biomolecules. Furthermore, the free energy profiles obtained from reweighting of the GaMD simulations allow us to identify distinct low-energy states of the biomolecules and characterize the protein-folding and ligand-binding pathways quantitatively.
Introduction
Dynamic biomolecules often undergo large-scale structural changes and visit distinct conformational states during their biological function.1 It is of great biological and pharmaceutical interest to characterize their structures and conformational transition pathways. Ideally, detailed free energy landscapes are sought to understand the functional mechanisms of biomolecules in a quantitative manner. However, due to large energy barriers, conformational transitions of biomolecules usually take place on time scales of milliseconds or even longer.1a,2 This has presented a grand challenge for computational molecular dynamics (MD) simulations that are limited to typically hundreds-of-nanoseconds to tens-of-microseconds.3
To address this challenge, biasing simulation methods have been found useful in enhanced sampling and free energy calculation of the biomolecules. These methods include umbrella sampling,4 conformational flooding,5 metadynamics,6 adaptive biasing force (ABF) calculations,7 and orthogonal space sampling,8 etc. During the simulations, a potential or force bias is applied along certain reaction coordinates (or collective variables) to facilitate the biomolecular conformational transitions across high-energy barriers. Typical reaction coordinates include atom distances, torsional dihedrals, root-mean-square deviation (RMSD) relative to a reference configuration, eigenvectors generated from the principal component analysis,5b and so on. The definition of the reaction coordinates, however, often requires expert knowledge of the studied systems. Furthermore, the predefined reaction coordinates largely place constraints on the pathway and conformational space to be sampled during the biasing simulations. It often leads to slow convergence of the simulations when important reaction coordinates are missed during the simulation setup.6b
Accelerated molecular dynamics (aMD) is an enhanced sampling technique that works often by adding a non-negative boost potential to smoothen the biomolecular potential energy surface. The boost potential, ΔV, decreases the energy barriers and thus accelerates transitions between the different low-energy states.9 With this, aMD is able to sample distinct biomolecular conformations and rare barrier-crossing events that are not accessible to conventional MD (cMD) simulations. Unlike the previously mentioned biasing simulation methods, aMD does not require predefined reaction coordinate(s), which can be advantageous for exploring the biomolecular conformational space without a priori knowledge or restraints. aMD has been successfully applied to a number of biological systems, (10) and hundreds-of-nanosecond aMD simulations have been shown to capture millisecond-time-scale events in both globular and membrane proteins.11
While aMD has been demonstrated to greatly enhance conformational sampling of biomolecules, it suffers from large energetic noise during reweighting.12 The boost potential applied in aMD simulations is typically on the order of tens-to-hundreds of kilocalories per mole, which is much greater in magnitude and wider in distribution than that of other biasing simulation methods that make use of predefined reaction coordinates (e.g., several kilocalories per mole). It has been a long-standing problem to accurately reweight aMD simulations and recover the original free energy landscapes, especially for large proteins.13 Our recent studies showed that when the boost potential follows near-Gaussian distribution, cumulant expansion to the second order provides improved reweighting of aMD simulations compared with the previously used exponential average and Maclaurin series expansion reweighting methods.14 The reweighted free energy profiles are in good agreement with the long-time-scale cMD simulations as demonstrated on alanine dipeptide and fast-folding proteins.15 However, such improvement is limited to rather small systems (e.g., proteins with less than ∼35 amino acid residues).15 In simulations of larger systems, the boost potential exhibits significantly wider distribution and does not allow for accurate reweighting.
Here, a Gaussian accelerated molecular dynamics (GaMD) approach is presented to reduce the energetic noise for simultaneous unstrained enhanced sampling and free energy calculation of biomolecules, even for large proteins. GaMD makes use of harmonic functions to construct the boost potential that is adaptively added to the biomolecular potential energy surface. A minimal set of simulation parameters is dynamically adjusted to control the magnitude and distribution width of the boost potential. As such, the resulting boost potential follows Gaussian distribution and allows for accurate reweighting of the simulations using cumulant expansion to the second order. In this study, GaMD is demonstrated on unconstrained simulations of the alanine dipeptide, chignolin folding, and ligand binding to the T4-lysozyme.
Methods
Gaussian Accelerated Molecular Dynamics
Gaussian accelerated
molecular dynamics enhances the conformational sampling of biomolecules
by adding a harmonic boost potential to smoothen the system potential
energy surface (Figure 1). Consider a system with N atoms at positions  = {
= { 1,...,
 N} . When the
system potential V(
N} . When the
system potential V( ) is lower than
a threshold energy, E, a boost potential is added
as
) is lower than
a threshold energy, E, a boost potential is added
as
| 1 |
where k is
the harmonic force
constant. The modified system potential, V*( ) = V(
 ) + ΔV(
 ), is given
by
), is given
by
| 2 |
Otherwise, when the system potential
is above
the threshold energy, i.e., V( ) ≥ E, the boost
potential is set to zero and V*(
) ≥ E, the boost
potential is set to zero and V*( ) = V(
 ).
).
Figure 1.
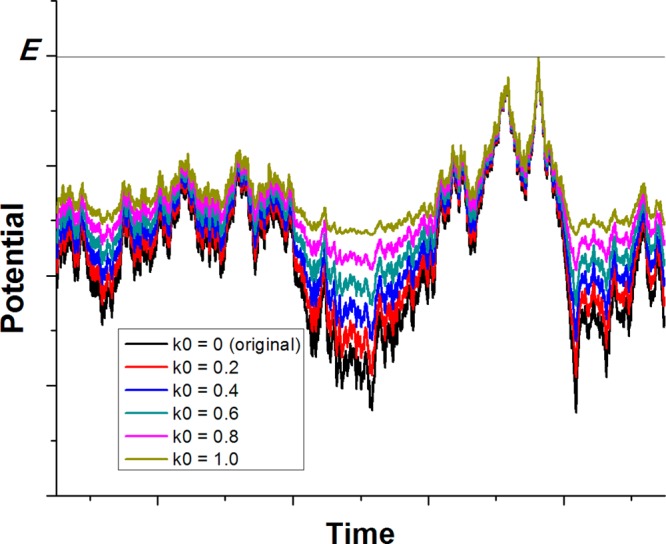
Scheme illustration of Gaussian accelerated molecular dynamics (GaMD). When the threshold energy is set to the maximum potential (E = Vmax), the system potential energy surface is smoothened by adding a harmonic boost potential that follows Gaussian distribution. The coefficient k0 in the range of 0–1 determines the magnitude of the applied boost potential. With greater k0, higher boost potential is added to the original energy surface in conventional molecular dynamics (cMD), which provides enhanced sampling of biomolecules across decreased energy barriers.
In order to smoothen the potential energy surface
for enhanced
sampling, the boost potential needs to satisfy the following criteria.
First, for any two arbitrary potential values V1( ) and V2(
 ) found on the
original energy surface,
if V1(
) found on the
original energy surface,
if V1( ) < V2(
 ), ΔV should be a
monotonic function that does not change the relative order of the
biased potential values; i.e., V1*(
), ΔV should be a
monotonic function that does not change the relative order of the
biased potential values; i.e., V1*( ) < V2(
 ). By replacing V*(
 ) with eq 2 and isolating E, we then obtain
| 3 |
Second,
if V1( ) < V2(
 ), the potential
difference observed on
the smoothened energy surface should be smaller than that of the original;
i.e., V2*(
), the potential
difference observed on
the smoothened energy surface should be smaller than that of the original;
i.e., V2*( ) – V1(
 ) < V2(
 ) – V1(
 ). Similarly,
by replacing V*(
). Similarly,
by replacing V*( ) with eq 2, we can derive
| 4 |
With Vmin ≤ V1( ) < V2(
 ) ≤ Vmax, we need to set the threshold energy E in the following
range by combining eqs 3 and 4:
) ≤ Vmax, we need to set the threshold energy E in the following
range by combining eqs 3 and 4:
| 5 |
where Vmin and Vmax are the system minimum and maximum potential energies. To ensure that eq 5 is valid, Vmax ≤ Vmin + (1/k) and k has to satisfy the following:
| 6 |
We define k ≡ k0(1/(Vmax – Vmin)); then 0 < k0 ≤ 1. As illustrated in Figure 1, k0 determines the magnitude of the applied boost potential. With greater k0, higher boost potential is added to the potential energy surface, which provides enhanced sampling of biomolecules across decreased energy barriers.
Third, the standard deviation of ΔV needs to be small enough (i.e., narrow distribution) to ensure accurate reweighting using cumulant expansion to the second order:14
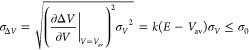 |
7 |
where Vav and σV are the average and standard deviation of the system potential energies and σΔV is the standard deviation of ΔV with σ0 as a user-specified upper limit (e.g., 10kBT) for accurate reweighting.
Provided eq 5 gives the range of threshold energy E, when E is set to the lower bound E = Vmax, we plug in E and k and obtain
| 8 |
We define the right-hand side in eq 8 as k0′ = (σ0/σV)((Vmax – Vmin)/(Vmax – Vav)). For efficient enhanced sampling with the highest possible acceleration, k0 can then be set to its upper bound as
| 9 |
The greater σΔV that is obtained from the original potential energy surface (particularly for large biomolecules), the smaller k0 may be applicable to allow for accurate reweighting. Alternatively, when the threshold energy E is set to its upper bound E = Vmin + (1/k) according to eq 5, we plug in E and k in eq 7 and obtain
| 10 |
We define the right-hand side in eq 10 as k0″ ≡ (1 – (σ0/σV)) ((Vmax – Vmin)/(Vav – Vmin)). When k0 ≤ 0 with σV ≤ σ0, k0 can be theoretically set to any value between zero and 1, although k0 = 1 is applied in this case for the current implementation of GaMD (See Appendix A). Note that a smaller k0 will give higher threshold energy E, but smaller force constant k. When 0 < k0″ ≤ 1, k0 can be set to either k0 for the highest threshold energy E or its upper bound 1.0 for the greatest force constant k. In this case k0 = k0″ is applied in the current GaMD implementation. When k0 > 1, we have to lower the threshold energy E to ensure that 0 < k0 ≤ 1; e.g., E = Vmax for default k0 = 1.
Given E and k0, we can calculate the boost potential as
| 11 |
Similar to aMD, GaMD provides options to add only the total potential boost ΔVP, only dihedral potential boost ΔVD, or the dual potential boost (both ΔVP and ΔVD). The dual-boost simulation generally provides higher acceleration than the other two types of simulations for enhanced sampling.9b The simulation parameters comprise of the threshold energy values and the effective harmonic force constants, k0P and k0D for the total and dihedral potential boost, respectively.
To characterize the extent to which ΔV follows Gaussian distribution, its distribution anharmonicity, γ, is calculated as was done previously:14
| 12 |
where ΔV is dimensionless as divided by kBT with kB and T being the Boltzmann constant and system temperature, respectively, and Smax = (1/2) ln(2πeσΔV2) is the maximum entropy of ΔV.16 When γ is zero, ΔV follows exact Gaussian distribution with sufficient sampling. Reweighting by approximating the exponential average term with cumulant expansion to the second order is able to accurately recover the original free energy landscape (Appendix B). As γ increases, the ΔV distribution becomes less harmonic and the reweighted free energy profile obtained from cumulant expansion to the second order deviates from the original. As demonstrated on the alanine dipeptide, chignolin, and T4-lysozyme in this study, a Gaussian distribution of the boost potential is normally achieved in the GaMD simulations. The anharmonicity of ΔV distribution serves as an indicator of the enhanced sampling convergence and accuracy of the reweighted free energy.
Simulation Protocols
GaMD is currently implemented in the GPU version of AMBER 1217 (see Appendix A for implementation details). Simulations of the alanine dipeptide, chignolin, and T4-lysozyme were performed using the AMBER ff99SB force field on GPUs.18 The simulated systems were built using the Xleap module of the AMBER package. Alanine dipeptide and chignolin were constructed as described previously.19 For T4-lysozyme, the ligand benzene was removed from the X-ray crystal structure of the Leu99Ala mutant (Protein Data Bank (PDB), 181L). Another four benzene molecules were placed in the bulk solvent at least 40 Å away from the ligand-binding site in the starting configuration. By solvating the structures in a TIP3P20 water box that extends 8–10 Å from the solute surface, the alanine dipeptide system contained 630 water molecules, 2,211 waters for chignolin, and 9,011 waters for T4-lysozyme. The total number of atoms in the three systems are 1,912; 6,773; and 29,692 for alanine dipeptide, chignolin, and T4-lysozyme, respectively (Table 1).
Table 1. Biomolecular Model Systems Simulated with GaMD in the Present Study (Nres and Natoms, Number of Residues and System Atoms, Respectively; ΔVav and σΔV, Average, Standard Deviation of the Boost Potential, ΔV).
| system | Nres | Natoms | GaMD | ΔVav (kcal/mol) | σΔV (kcal/mol) |
|---|---|---|---|---|---|
| alanine dipeptide | 2 | 1,912 | 30 ns × 3 | 10.9 | 2.9 |
| chignolin | 10 | 6,773 | 300 ns × 3 | 9.8 | 2.4 |
| T4-lysozyme | 162 | 29,692 | 800 ns × 4 | 36.3 | 4.7 |
| 1800 ns |
Periodic boundary conditions were applied for all of the simulation systems. Bonds containing hydrogen atoms were restrained with the SHAKE algorithm,21 and a 2 fs time step was used. Weak coupling to an external temperature and pressure bath was used to control both temperature and pressure.22 The electrostatic interactions were calculated using the PME (particle mesh Ewald summation)23 with a cutoff of 8.0 Å for long-range interactions.
The three systems were initially minimized for 2,000 steps using the conjugate gradient minimization algorithm, and then the solvent was equilibrated for 50 ps in an isothermal–isobaric (NPT) ensemble with the solute atoms fixed. Another minimization was performed with all atoms free, and the systems were slowly heated to 300 K over 500 ps. Final system equilibration was achieved by a 200 ps isothermal–isovolumetric (NVT) and 400 ps NPT run to ensure that the water box of the simulated systems had reached the appropriate density.
In the present study, the system threshold energy is set as E = Vmax for all GaMD simulations. The maximum, minimum, average, and standard deviation values of the system potential (Vmax, Vmin, Vav, and σV) were obtained from an initial 2 ns NVT simulation with no boost potential. For optimal acceleration, the greatest σ0 and k0 were determined through short testing simulations (e.g., 2 ns): with increasing σ0, either k0 calculated using eq 9 reaches 1.0 (highest acceleration level) or σΔV reaches 10kBT (the upper limit of the ΔV distribution width for accurate reweighting). Each GaMD simulation proceeds with a 2 ns equilibration run, followed by production simulations.
Testing simulations were performed with either the “total potential boost” or “dihedral potential boost” only to identify the optimal σ0 and k0 acceleration parameters (Supporting Information Tables S1–S3). Long-time dual-boost GaMD simulations were then obtained for analysis, including three independent 30 ns simulations of alanine dipeptide and three independent 300 ns simulations of chignolin. For the T4-lysozyme, five independent 800 ns simulations were initially performed. Complete binding of benzene to the target ligand-binding site was observed in one of the five simulations. Even when the simulation was extended to 1,800 ns, benzene remained tightly bound in the ligand-binding cavity. The simulation frames were saved every 0.1 ps for analysis. A summary of the simulations is listed in Table 1.
Simulation Analysis
Time courses of dihedral angles, RMSD, radius of gyration (Rg), and residue distances in the AMBER simulation trajectories were analyzed using the cpptraj tool.24 Particularly, the backbone dihedral angles Φ and Ψ were calculated for alanine dipeptide (Figure 2A). For chignolin, the Rg and RMSD of simulation frames relative to the PDB native structure (Figure 3A) were calculated for the protein Cα atoms with the terminal residues Gly1 and Gly10 excluded. For ligand binding to the T4-lysozyme (Figure 5A), the symmetry-corrected RMSD of benzene was obtained by generating six symmetrically imaged reference benzene configurations from the 181L crystal structure, calculating the RMSDs for the diffusing benzene molecules in each frame after aligning the protein C-terminal domain (residues 80–160) and then extracting the minimum value of the calculated RMSDs. Moreover, the number of protein atoms found within 5 Å of benzene (Ncontact, only heavy atoms are considered) was calculated using pbwithin in VMD that accounts for the periodic boundary conditions.25
Figure 2.

(A) Scheme representation of backbone dihedrals Φ and Ψ in alanine dipeptide. (B) Distribution of the boost potential ΔV applied in the GaMD simulation. (C) 2D potential of mean force (PMF) of backbone dihedrals (Φ, Ψ) calculated from three 30 ns GaMD simulations combined using cumulant expansion to the second order. The low-energy wells are labeled corresponding to the right-handed α helix (αR), left-handed α helix (αL), β-sheet (β), and polyproline II (PII) conformations. (D) Distribution anharmonicity of ΔV of frames found in each bin of the PMF profile.
Figure 3.

Folding of chignolin captured in GaMD simulations: (A) comparison of simulation-folded chignolin (blue) with the PDB (1UAO) native structure (red) that exhibits 0.2 Å RMSD, (B) distribution of the boost potential ΔV, (C) 2D (RMSD, Rg) PMF calculated by reweighting the three 300 ns GaMD simulations combined, and (D) the distribution anharmonicity of ΔV of frames found in each bin of the PMF profile.
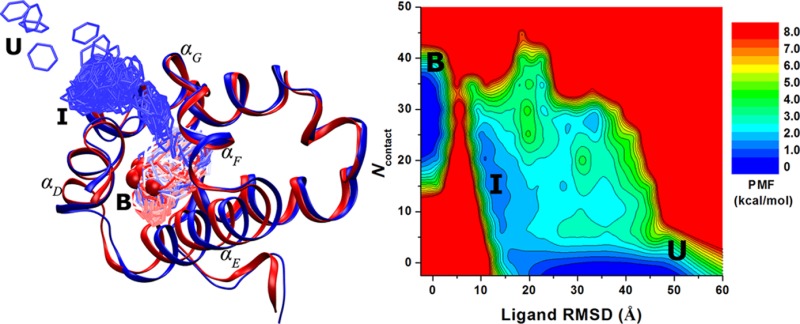
Figure 5.

Binding of benzene to the Leu99Ala T4-lysozyme simulated via GaMD: (A) comparison of simulation-derived complex structure that captures benzene binding (blue) with 0.1 Å ligand RMSD relative to the 181L PDB structure (red), (B) distribution of the boost potential ΔV, (C) 2D (ligand RMSD, Ncontact) PMF calculated by reweighting the 1,800 ns GaMD simulation, and (D) distribution anharmonicity of ΔV of frames found in each bin of the free energy profile.
The PyReweighting toolkit14 was used to reweight the GaMD simulations for calculating the PMF profiles and to examine the boost potential distributions. Two-dimensional (2D) PMF profiles were computed for backbone dihedrals (Φ, Ψ) in alanine dipeptide. A bin size of 6° is selected to balance between reducing the anharmonicity and increasing the bin resolution as discussed earlier.14 Two-dimensional PMF profiles were also constructed using (RMSD, Rg) for chignolin with a bin size of (1.0 Å, 1.0 Å). For benzene binding to the T4-lysozyme, 2D PMF was constructed using (ligand RMSD, Ncontact) with a bin size of (1.0 Å, 5). When the number of simulation frames within a bin is lower than a certain limit (i.e., cutoff), the bin is not sufficiently sampled and thus is excluded for reweighting. The cutoff can be determined by iteratively increasing it until the minimum position of the PMF profile does not change.14 The final cutoff was set as 10, 50, and 1000 for reweighting of GaMD simulations on alanine dipeptide, chignolin, and T4-lysozyme, respectively.
Results
GaMD provides enhanced sampling of conformational transitions in alanine dipeptide, chignolin folding, and ligand binding to the T4-lysozyme. Furthermore, the boost potential applied in the present GaMD simulations follows Gaussian distribution, which allows accurate reweighting using cumulant expansion to the second order and recovery of the original biomolecular free energy landscapes, even for proteins as large as the T4-lysozyme. Notably, hundreds-of-nanoseconds GaMD simulations are able to capture complete folding of chignolin and ligand binding of benzene to the T4-lysozyme that take place on significantly longer time scales.
Alanine Dipeptide
In order to balance between achieving the highest acceleration (large ΔV) and ensuring accurate reweighting (small enough standard deviation, σΔV), short GaMD simulations (2 ns) were tested on alanine dipeptide to search for optimal acceleration parameters. For the total potential boost, when σ0P was adjusted from 1.0 to 2.0, the resulting k0P calculated using eq 9 was increased from 0.21 to 1.0, accompanied by increases of the ΔVP standard deviation from 1.03 to 1.75 kcal/mol and the ΔVP average from 2.36 to 3.85 kcal/mol (see Supporting Information Table S1a). After k0P reached its maximum 1.0, slight changes were observed when σ0P was further increased from 2.0 to 3.0. For the dihedral potential boost, the calculated k0D reached 1.0 when σ0D was increased to 3.0 (Supporting Information Table S1b). Therefore, (σ0P,σ0D) were set to (3.0, 3.0) for the production dual-boost GaMD simulations of alanine dipeptide, which enables the highest acceleration as well as accurate reweighting with both k0P and k0D equal to 1.0 (Supporting Information Table S1c).
As shown in Figure 2B, the boost potential ΔV applied in GaMD simulation of the alanine dipeptide follows Gaussian distribution. Its distribution anharmonicity is small enough to be 1.69 × 10⁻³. The average and standard deviation of ΔV are 10.9 and 2.9 kcal/mol, respectively (Table 1). Figure 2C plots the 2D PMF of backbone dihedrals (Φ, Ψ) that are obtained by reweighting the three 30 ns GaMD simulations combined using cumulant expansion to the second order. The reweighted PMF is able to recover five energy minimum wells that are centered around (−162°, −12°) and (−72°, −12°) for the right-handed α helix (αR), (48°, 18°) for the left-handed α helix (αL), (−156°, 162°) for the β-sheet, and (−66°, 156°) for the polyproline II (PII) conformation. The corresponding minimum free energies are estimated as 0, 1.40, 1.07, 2.94, and 4.27 kcal/mol, respectively. This is in good agreement with the PMF results of an exceptionally long 1000 ns cMD simulation as presented earlier.14 Additionally, the distribution anharmonicity of ΔVof frames clustered in each bin of the 2D PMF exhibits values smaller than 0.10 in the low-energy regions (Figure 2D), which suggests sufficient sampling for reweighting using cumulant expansion to the second order. Greater anharmonicity is found in high-energy regions (especially the energy barriers), for which low boost potential is applied and less sampling is normally achieved. Therefore, the anharmonicity of ΔV distribution appears to be a good indicator for sufficiency of the enhanced sampling and accuracy of the reweighted free energy.
Folding of Chignolin
For chignolin, short 2 ns testing GaMD simulations showed that k0P reached the 1.0 maximum for the highest total potential boost when σ0P was increased to 3.0 (Supporting Information Table S2a). For the dihedral potential boost, the simulation crashed when σ0D was increased to 0.9 and stable simulation was achieved only when σ0D was increased to 0.6 (Supporting Information Table S2b). Thus, (σ0P,σ0D) were set to (3.0, 0.6) for the production dual-boost GaMD simulations of chignolin (Supporting Information Table S2c). The resulting boost potential follows Gaussian distribution and the calculated γ = 9.22 × 10⁻³ (Figure 3B). The average and standard deviation of ΔV are 9.8 and 2.4 kcal/mol, respectively (Table 1).
Started from an extended conformation, GaMD simulations were able to capture complete folding of chignolin into its native structure (Supporting Information Movie S1). The RMSD obtained between the simulation-folded chignolin and NMR experimental native structure (PDB, 1UAO) reaches a minimum of 0.2 Å (Figure 3A). Using the protein RMSD relative to the PDB native structure and Rg, a 2D PMF profile was calculated by reweighting the three 300 ns GaMD simulations combined (Figure 3C). The reweighted PMF allows us to identify three distinct low-energy conformational states: the folded (“F”), unfolded (“U”), and an intermediate (“I”). The folded state corresponds to the global energy minimum at (1.0 Å, 4.0 Å), the unfolded state is 3.68 kcal/mol higher in a local-energy well centered at (6.0 Å, 7.0 Å), and the intermediate in a 3.06 kcal/mol free energy well centered at (4.0 Å, 5.5 Å). The energy barrier for chignolin folding between the unfolded and folded states is ∼4.0 kcal/mol, and ∼3.5 kcal/mol for transitions between the intermediate and folded states (Figure 3C). In comparison, when the three 300 ns GaMD simulations were analyzed separately, the reweighted PMF profiles exhibit significant differences (Supporting Information Figure S2). Whereas the three folded, intermediate, and unfolded low-energy states were captured in sim2, the unfolded and intermediate states were not sufficiently sampled (no converged low-energy wells) in sim1 and sim3, respectively. Improved sampling was obtained by combining the three independent GaMD simulations. Figure 3D plots the distribution anharmonicity of ΔV for frames found in each bin of the 2D PMF as shown in Figure 3C. The anharmonicity exhibits values smaller than 0.05 in the simulation sampled conformational space, suggesting that ΔV achieves sufficient sampling for reweighting using cumulant expansion to the second order.
Compared with the native structure, the unfolded chignolin exhibits an extended conformation without proper secondary structure formed in the protein backbone as shown in Figure 4A. The intermediate conformation observed during folding of chignolin is characterized by hydrophobic interactions between the Pro4 and Trp9 residue side chains and a turn at Thr8. Such conformation was also observed in previous microsecond-time-scale cMD simulations.26 In the simulation-derived folded state, the protein residue side chains exhibit closely similar conformations as in the NMR native structure (Figure 4C). Residues Tyr2 and Pro4 form hydrophobic interactions between their side chains. Hydrophilic residues Asp3, Glu5, Thr6, and Thr8 expose side chains to the solvent.
Figure 4.
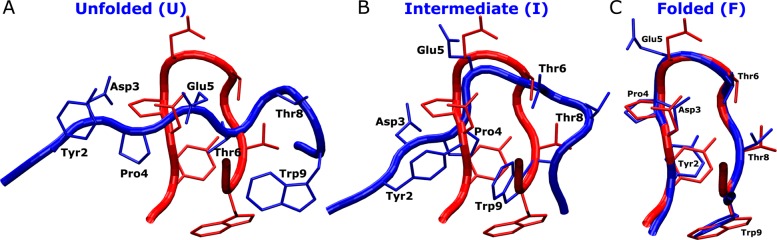
Structures of chignolin observed during GaMD simulations corresponding to the (A) unfolded (“U”), (B) intermediate (“I”), and (C) folded (“F”) states (blue) aligned to the PDB native structure (red). Residues including Tyr2, Asp3, Pro4, Glu5, Thr6, Thr8, and Trp9 are represented by sticks. Notably, Trp9 and Pro4 form hydrophobic interactions in the intermediate state.
Finally, a 2D free energy profile of chignolin was calculated using the RMSD of the protein Cα atoms relative to the native PDB structure and the backbone dihedral Ψ of residue Gly7 (Supporting Information Figure S3). The three independent 300 ns GaMD simulations were combined for the reweighting. This allows for identification of a misfolded (“M”) low-energy state, in addition to the F, I, and U states as observed in Figure 3C. The M conformation of chignolin shows ∼180° rotation of the C-terminal strand about its long axis relative to the native PDB structure. The free energy of the misfolded chignolin is found to be 1.89 kcal/mol greater than that of the folded state. This is consistent with previous findings that the misfolded chignolin was observed with higher probability in simulations with the AMBER ff99SB force field,27 which is used in the present study.
Benzene Binding to T4-Lysozyme
Short testing GaMD simulations of the T4-lysozyme showed that k0P reached the 1.0 maximum for the highest total potential boost when σ0P was increased to 3.0 (Supporting Information Table S3a). For the dihedral potential boost, the simulation crashed when σ0D was increased to 5.0 (Supporting Information Table S3b). Stable simulation was achieved when σ0D was increased to 4.0 and the calculated k0D was 0.35. With further testing for stable dual-boost GaMD simulation, (σ0P,σ0D) were set to (3.0, 4.0) for the final production simulations of the T4-lysozyme (Supporting Information Table S3c).
GaMD captured complete binding of benzene to the deeply buried ligand-binding cavity in the Leu99Ala T4-lysozyme within ∼100 ns in one of the five independent 800 ns simulations (Supporting Information Movie S2). Benzene remained bound in the ligand-binding site even when the simulation was extended to 1,800 ns. By aligning the C-terminal domain (residues 80–160) of the T4-lysozyme, the RMSD of the diffusing benzene molecules relative to the bound pose in the 181L X-ray crystal structure reaches a minimum of 0.1 Å (Figure 5A). The boost potential applied during the 1,800 ns GaMD simulation follows Gaussian distribution, and its γ = 1.39 × 10⁻³ (Figure 5B). The average and standard deviation of ΔV are 36.5 and 4.7 kcal/mol, respectively (Table 1). Although the ΔV average values exhibit variations between five independent simulations, the ΔV standard deviations are closely similar to each other provided that (σ0P,σ0D) were set to (3.0, 4.0) (Supporting Information Table S3c). Using the RMSD of benzene relative to the bound pose and the number of protein heavy atoms that are within 5 Å of benzene (Ncontact), a 2D PMF profile was calculated by reweighting the 1,800 ns GaMD simulation (Figure 5C). The reweighted PMF allows us to identify three distinct low-energy states: the unbound (“U”), intermediate (“I”), and bound (“B”) states. The bound state corresponds to the global energy minimum located at ∼(0 Å, 30), the unbound state in a local-energy well centered at ∼(33 Å, 0), and the intermediate centered at ∼(11 Å, 20). It is important to note that since the complete binding of benzene to the target ligand-binding site was observed only once, the calculated binding free energy between the bound and unbound states is subject to the error of limited sampling. Nevertheless, benzene visits the intermediate site many times during the 1800 ns GaMD simulation with the ligand RMSD decreased to ∼11 Å (Supporting Information Figure S2A). Repeated sampling of the intermediate state was observed in the other four 800 ns GaMD simulations as well (Supporting Information Figure S2), for which a local-energy well appears around (11.0 Å, 20) in the 2D PMF profiles (Supporting Information Figure S3). The relative free energy between the intermediate and unbound states is estimated to be 0.53 ± 0.46 kcal/mol from PMF profiles of the five GaMD simulations. Furthermore, benzene was observed to bind another intermediate 2 (“I2”) site that is located in the pocket formed by the hinge αC helix and the αB helix from the N-terminal domain (Supporting Information Figure S2). A corresponding local energy well of the I2 state appears in the calculated 2D PMF profiles. Figure 5D plots the ΔV distribution anharmonicity, γ, for frames found in each bin of the 2D PMF. It exhibits relatively large values in the high-energy regions (less sampling), notably the energy barrier between the intermediate and bound states. The ligand entry from the intermediate to the bound state is thus suggested to be the rate-limiting step for benzene binding. In comparison, γ exhibits values smaller than 0.01 in the energy well regions, suggesting that ΔV achieves sufficient sampling for reweighting using cumulant expansion to the second order.
A complete binding pathway of benzene that was observed in the GaMD simulation is shown in Figure 6A. Benzene diffuses from the bulk solvent to the protein surface formed by the αD and αG helices and then to the target ligand-binding site in the protein C-terminal domain. Figure 6B depicts the unbound pose of a benzene molecule that is located far away from the ligand-binding site in the 181L X-ray crystal structure. In the intermediate state, benzene interacts with residues Lys83, Pro86, and Val87 from the αD helix and the Thr115, Thr119, and Gln122 residues from the αG helix (Figure 6C). In the bound pose, benzene is superimposable with the ligand cocrystallized in the 181L crystal structure. It forms hydrophobic interactions with residues Ile78, Leu84, Tyr88, Val87, Leu91, Val111, Leu118, and Leu121 in the deeply buried protein cavity (Figure 6D). Supporting Information Figure S5 shows a transient snapshot observed during benzene binding between the intermediate and bound poses. Benzene appears to slide into the ligand-binding cavity, interacting with residues Gln81, Lys83, Leu84, Val111, Phe114, Thr115, and Leu118 from the αD, αF, and αG helices.
Figure 6.

(A) Pathway of benzene binding to the T4-lysozyme observed during the GaMD simulation. (B–D) The (B) unbound (“U”), (C) intermediate (“I”), and (D) bound (“B”) poses of the protein–ligand complex (blue) with the protein C-terminal domain (residues 80–160) aligned to the PDB native structure (red). The protein and benzene are represented by ribbons and spheres, respectively, and they are colored by blue for the simulation structure while red for the PDB native structure, except that in A the simulated benzene is represented by lines and colored by simulation time in a BWR color scale. Residues with heavy atoms found within 3 Å of benzene are represented by sticks.
Discussion
By adaptively adding a harmonic boost potential to smoothen the system energy surface, GaMD provides both unconstrained enhanced sampling and free energy calculation of biomolecules. Important statistical properties of the system potential, such as the average, maximum, minimum, and standard deviation values, are used to calculate the simulation acceleration parameters, particularly the threshold energy, E, and force constant, k0.
For alanine dipeptide, both k0P and k0D can be increased to the 1.0 maximum for the greatest possible boost of the total and dihedral potential energies. The resulting standard deviation of ΔV that follows Gaussian distribution is 2.9 kcal/mol, which allows for accurate reweighting using cumulant expansion to the second order. Notably, high-energy regions of the GaMD sampled free energy surface (especially the energy barriers) exhibit increased anharmonicity compared with the low-energy wells (Figure 2D). Thus, the free energy barriers appear unconverged and still suffer from insufficient sampling during the three short 30 ns GaMD simulations. Nevertheless, the GaMD reweighted PMF profile is able to recover low-energy states of the system that are in good agreement with those observed in a 1000 ns cMD simulation.14
Furthermore, GaMD is able to fold chignolin from an extended conformation to the NMR native structure in three independent 300 ns simulations. While k0P can be increased to 1.0 for the greatest total potential boost, k0D can reach only 0.15–0.17 for stable simulation. Nevertheless, this seems to provide sufficient sampling of the chignolin-folding process. Among the three independent simulations, although the folded, intermediate, and unfolded low-energy states are captured in sim2, the unfolded and intermediate states are not sufficiently sampled in sim1 and sim3, respectively (Supporting Information Figure S2). More sufficient sampling is obtained by combining the three GaMD simulations. All three folded, intermediate, and unfolded states are identified from the resulting reweighted free energy profiles. Particularly, the intermediate conformation was also observed in earlier microsecond-time-scale cMD simulations.26 GaMD appears to achieve better convergence than the previous aMD simulations that were not able to distinguish between the intermediate and unfolded states within the same simulation time.28
Finally, GaMD captured complete binding of benzene to the ligand-binding site of the T4-lysozyme. In one of the five independent simulations, benzene diffused into the deeply buried ligand-binding cavity within ∼100 ns and remained bound even when the simulation was extended to 1800 ns. Similar to chignolin, while k0P can be increased to the 1.0 maximum for the greatest total potential boost in the T4-lysozyme simulations, k0D can reach only 0.33–0.35 for the greatest dihedral boost. The resulting ΔV standard deviation is ∼4.7 kcal/mol in the final dual-boost GaMD simulations. Such narrow distribution of ΔV ensures accurate reweighting using cumulant expansion to the second order. Distinct low-energy unbound, intermediate, and bound states were identified from the reweighted PMF profiles. The atomistic GaMD simulation also elucidates a highly detailed binding pathway of benzene that diffuses from the bulk solvent to an intermediate site located on the protein surface formed by the αD and αG helices and then slides into the target ligand-binding cavity through a channel formed by the αD, αF, and αG helices. The free energy difference between the intermediate and unbound states was found to be small at 0.53 ± 0.46 kcal/mol as estimated from the five independent GaMD simulations. Benzene repeatedly visits the intermediate site on the protein surface. In comparison, the ligand entry from protein surface to the deeply buried protein cavity appears to be the rate-limiting step for complete benzene binding. It is important to note that the complete ligand binding was not observed in the four 800 ns GaMD simulations, suggesting that the present GaMD simulations still suffer from insufficient sampling of the ligand entry process and the reweighted free energy profiles remain unconverged (Figure 5C and Supporting Information Figure S5). This is also indicated by the increased anharmonicity corresponding to the free energy barrier between the intermediate and bound states as shown in Figure 5D. Nevertheless, our GaMD simulation captured a binding pathway of benzene to the T4-lysozyme. The ligand entry site is indeed adjacent to the mobile αF helix (residues 108–113), which has been suggested earlier29 based on the finding that the αF helix exhibits increased B-factors in the Leu99Ala complex structures compared to the apo structures.30
Here, GaMD is compared with the original aMD, particularly on the performance of smoothening the potential energy surface and energetic reweighting. Supporting Information Table S4 summarizes the statistical properties of the boost potential and the original and modified potential energies as obtained from aMD and GaMD simulations of the alanine dipeptide, chignolin, and T4-lysozyme, with reference to the cMD simulations. Specifically, dual-boost aMD simulations of the alanine dipeptide and chignolin obtained from our previous study14 were used for comparison. For the T4-lysozyme, restarting from the initial configuration of GaMD simulations, a 200 ns dual-boost aMD simulation was performed using the following acceleration parameters: Edihed = Vdihed_av + 4Nres, αdihed = 4Nres/5, Etotal = Vtotal_av + 0.2Natoms, and αtotal = 0.2Natoms, where Vdihed_av and Vtotal_av are the average dihedral and total potential energies calculated from a short 10 ns cMD simulation. As shown in Supporting Information Table S4, although higher average boost potentials are applied in GaMD simulations of the three systems than in the aMD simulations, the boost potentials exhibit smaller standard deviations (i.e., narrower distribution) in the GaMD simulations, except for the alanine dipeptide. Furthermore, anharmonicity of the boost potential distribution is significantly reduced in the GaMD simulations. Relative to cMD, both aMD and GaMD simulations mostly exhibit smaller standard deviations in the modified dihedral and total potential energies. Notably for the T4-lysozyme, standard deviations of the modified potential energies are significantly smaller in the GaMD simulations than in aMD. Thus, the potential energy surfaces appear more smoothened in GaMD enhanced sampling of the T4-lysozyme. Provided the narrower distribution and lower anharmonicity of the boost potential (Supporting Information Table S4), GaMD allows for more accurate approximation of exponential average reweighting factor using cumulant expansion to the second order and thus improved free energy calculation, especially for the T4-lysozyme.
In the present simulations of ligand binding to the T4-lysozyme, complete binding of benzene was observed only once, largely because the target ligand-binding site is deeply buried in the protein. However, benzene binding to the intermediate site on the protein surface formed by the αD and αG helices was captured many times, which provides better statistics for free energy calculation. It has been suggested that a PMF-based approach is appropriate to calculate binding free energy for ligands (especially the charged) that bind to the protein surface.31 Systems of this type for future applications of GaMD might include binding of benzamidine to trypsin32 and allosteric modulators to the protein surface of the G-protein coupled receptors.33
In comparison with many enhanced sampling methods such as umbrella sampling,4 conformational flooding,5 metadynamics,6 ABF calculations,7 and orthogonal space sampling,8 GaMD has the advantage of no need to set predefined reaction coordinates. Metadynamics, in particular, is another potential biasing technique that has been widely used to map the free energy landscapes of biomolecules such as protein conformational changes34 and protein–ligand binding.6b,35 By monitoring the energy surface of biomolecules during the simulation, metadynamics keeps adding small Gaussians of potential energies to the low-energy regions. This will eventually fill the low-energy wells and achieve uniform sampling of the free energy surface along selected reaction coordinates. The usage of predefined coordinates greatly reduces the complexity of biomolecular simulation problems and facilitates the free energy calculations (e.g., significantly lower energetic noise compared with aMD simulations). However, it is key to select proper reaction coordinates, which often requires expert knowledge of the studied systems. Construction of biomolecular reaction coordinates or collective variables has thus been one of the main objectives in metadynamics studies.6a When important reaction coordinates are missed during the simulation setup, metadynamics simulations may suffer from slow convergence problems as discussed earlier. Furthermore, the predefined reaction coordinates tend to place constraints on the sampled space and pathways. It seems difficult to identify certain intermediate states during the protein-folding and ligand-binding pathways, e.g., intermediate 2 as observed during the binding of benzene to the T4-lysozyme. In comparison, aMD simulations are not constrained by reaction coordinates, but this also leads to much higher energetic noise and presents grand challenge for accurate reweighting to recover the original free energy landscapes of biomolecules.12 Although cumulant expansion to the second order was shown to improve aMD reweighting when the boost potential follows near Gaussian distribution,14 such improved reweighting is still limited to small systems such as protein with ≤35 residues.15 Here, by constructing boost potential using a harmonic function that follows Gaussian distribution, GaMD enables rigorous energetic reweighting through cumulant expansion to the second order, even for simulations of larger proteins (e.g., T4-lysozyme). With this, GaMD achieves simultaneous unconstrained enhanced sampling and free energy calculations.
However, several cautions also result from this study. First, while the present GaMD simulations seem to provide sufficient sampling of the low-energy regions, they appear to remain unconverged in sampling of the high-energy barriers. This is particularly true for the ligand entry step in the GaMD simulation of benzene binding to the T4-lysozyme. It is worth recalling that the threshold energy for adding the boost potential is set to its lower bound in the present GaMD simulations. It is subject to future investigation into whether using the upper bound of the threshold energy will facilitate sampling of the high-energy barriers in GaMD simulations. Second, based on a potential biasing approach, GaMD mainly accelerates transitions across enthalpic energy barriers. Improvement for its application to systems with high entropic barriers is still in need. On this regard, GaMD can be potentially combined with the parallel tempering36 and replica exchange37 algorithms for further enhanced sampling. Particularly, the combination of parallel tempering and metadynamics (PT-MetaD)34a has been shown to facilitate enhanced sampling of biomolecules over entropic barriers.
In summary, without the need to set predefined reaction coordinates, GaMD is generally applicable to a wide range of biomolecular systems as demonstrated on protein folding and ligand binding in this study. For systems of increasing size, the upper limit of the ΔV standard deviation, σ0 can be adjusted dynamically to ensure that the distribution width of the applied boost potential is narrow enough for accurate energetic reweighting using cumulant expansion to the second order. Therefore, GaMD provides both unconstrained enhanced sampling and free energy calculation for biomolecular simulations.
Acknowledgments
Computing time was provided on GPU nodes of the Triton Shared Computing Cluster (TSCC) at the San Diego Supercomputer Center (SDSC).
Appendix A: Implementation Algorithm of Gaussian Accelerated Molecular Dynamics
Gaussian accelerated molecular dynamics (GaMD) is currently implemented in the GPU version of AMBER 12,17 but should be transferable to AMBER 14 and other molecular dynamics programs as well. GaMD provides enhanced sampling of biomolecules by adding a harmonic boost potential to smoothen the system potential energy surface. Following is a list of the input parameters for a GaMD simulation:
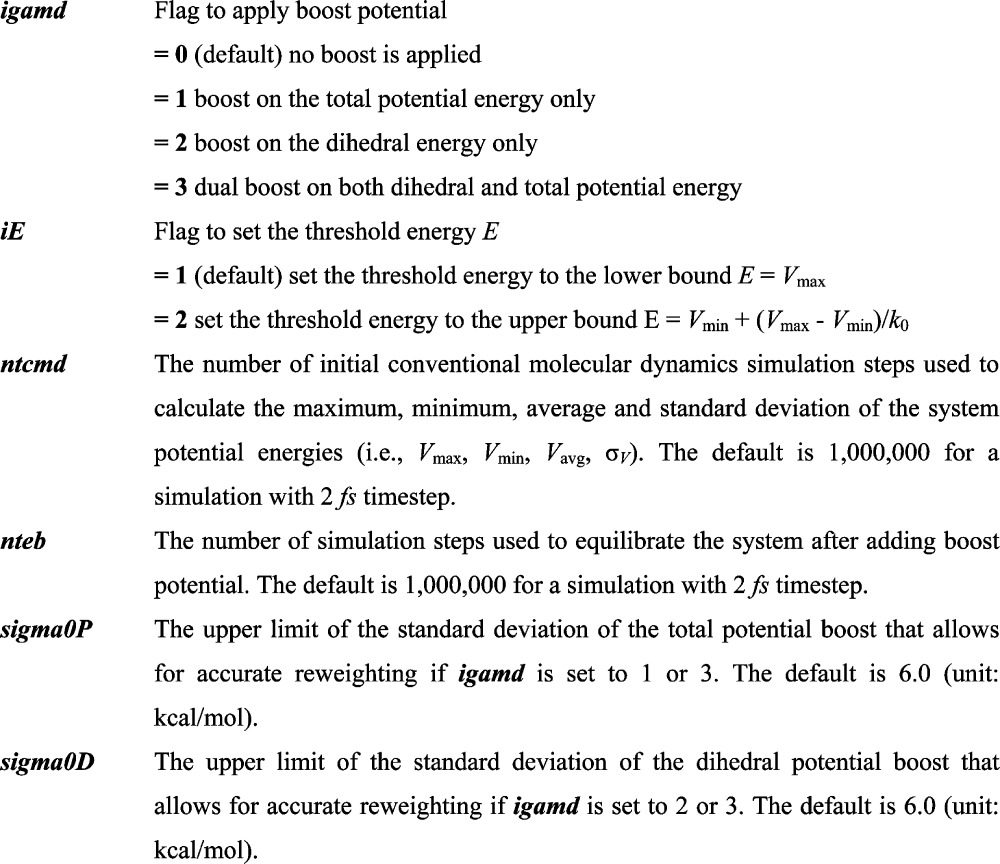 |
The GaMD algorithm is summarized as the following:
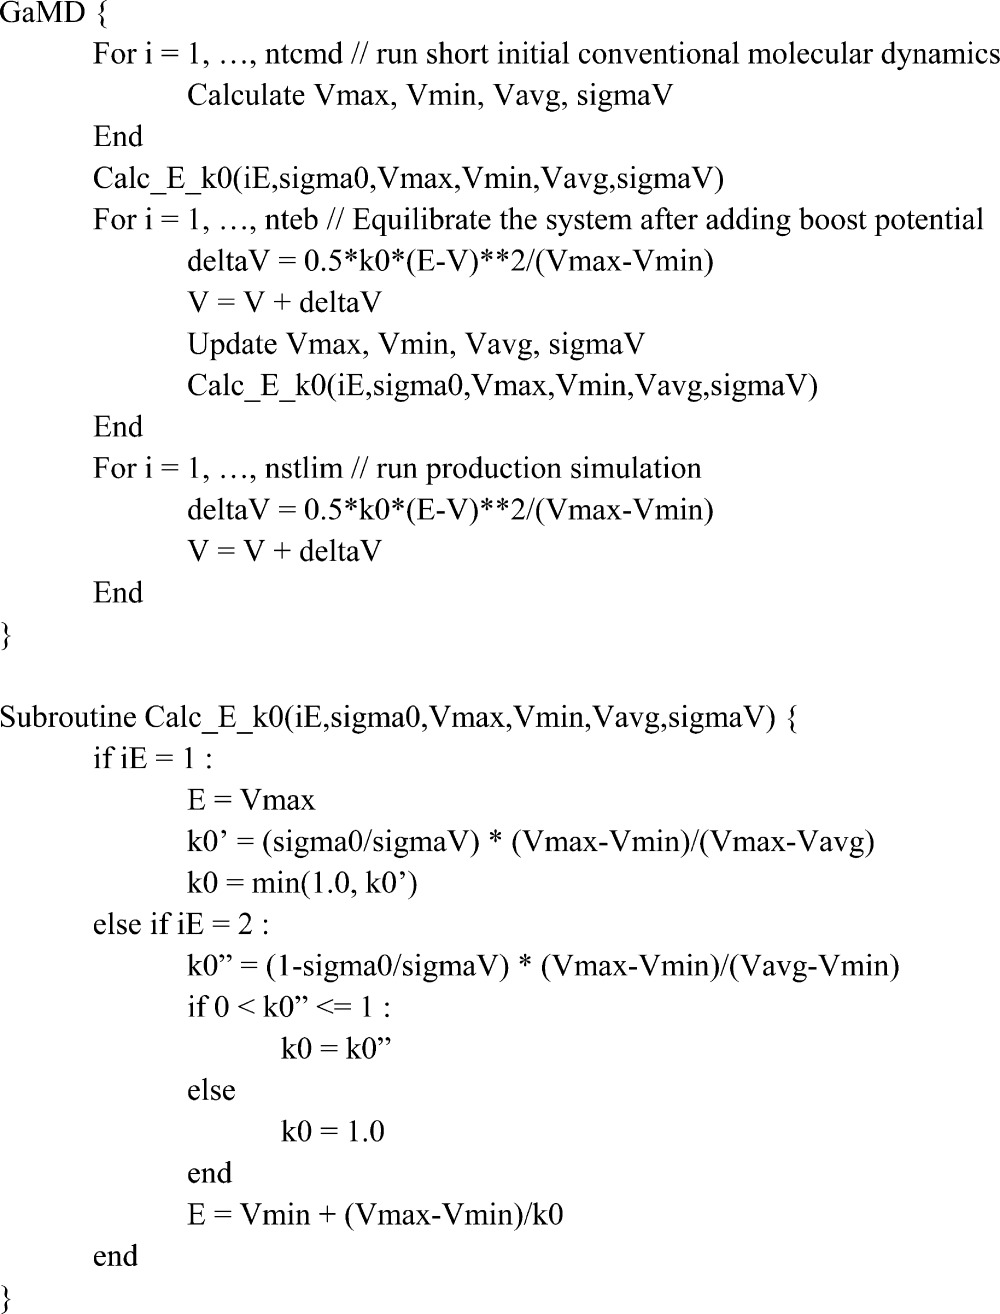 |
Appendix B: Energetic Reweighting with Cumulant Expansion to the Second Order
For simulations of a biomolecular system, the probability distribution along a selected reaction coordinate A(r) is written as p*(A), where r denotes the atomic positions {r1,...,rN}. Given the boost potential ΔV(r) of each frame, p*(A) can be reweighted to recover the canonical ensemble distribution, p(A), as
| B1 |
where M is the number of bins, β = kBT and ⟨eβΔV(r)⟩j is the ensemble-averaged Boltzmann factor of ΔV(r) for simulation frames found in the jth bin. In order to reduce the energetic noise, the ensemble-averaged reweighting factor can be approximated using cumulant expansion:38
| B2 |
where the first three cumulants are given by
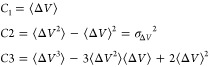 |
B3 |
As shown earlier, when the boost potential follows near-Gaussian distribution, cumulant expansion to the second order provides the more accurate reweighting compared with the exponential average and Maclaurin series expansion methods.14 Finally, the reweighted free energy is calculated as F(Aj) = −(1/β) ln p(Aj).
Supporting Information Available
Test GaMD simulations and comparison of GaMD and aMD (Tables S1–S4), RMSD and Rg plots, free energy profiles and misfolded conformation of chignolin, GaMD simulations of ligand binding to T4-lysozyme, PMF profiles, intermediate 2 state of ligand binding to T4-lysozyme, and transition snapshot of benzene binding to T4-lysozyme (Figures S1–S7), and protein folding and protein–ligand binding (Movies S1–S2). The Supporting Information is available free of charge on the ACS Publications website at DOI: 10.1021/acs.jctc.5b00436.
This work was supported by NSF (Grant MCB1020765), NIH (Grants GM31749, 1U01GM111528, and DP2-OD007237), Howard Hughes Medical Institute, and National Biomedical Computation Resource (NBCR).
The authors declare no competing financial interest.
Supplementary Material
References
- a Henzler-Wildman K.; Kern D. Dynamic personalities of proteins. Nature 2007, 450, 964–972 10.1038/nature06522. [DOI] [PubMed] [Google Scholar]; b Miao Y.; Johnson J. E.; Ortoleva P. J. All-atom multiscale simulation of cowpea chlorotic mottle virus capsid swelling. J. Phys. Chem. B 2010, 114, 11181–95 10.1021/jp102314e. [DOI] [PMC free article] [PubMed] [Google Scholar]; c Kruse A. C.; Ring A. M.; Manglik A.; Hu J.; Hu K.; Eitel K.; Hubner H.; Pardon E.; Valant C.; Sexton P. M.; Christopoulos A.; Felder C. C.; Gmeiner P.; Steyaert J.; Weis W. I.; Garcia K. C.; Wess J.; Kobilka B. K. Activation and allosteric modulation of a muscarinic acetylcholine receptor. Nature 2013, 504, 101–106 10.1038/nature12735. [DOI] [PMC free article] [PubMed] [Google Scholar]
- a Vilardaga J.-P.; Bunemann M.; Krasel C.; Castro M.; Lohse M. J. Measurement of the millisecond activation switch of G protein-coupled receptors in living cells. Nat. Biotechnol. 2003, 21, 807–812 10.1038/nbt838. [DOI] [PubMed] [Google Scholar]; b Miao Y.; Ortoleva P. J. Viral structural transitions: an all-atom multiscale theory. J. Chem. Phys. 2006, 125, 214901. 10.1063/1.2400858. [DOI] [PubMed] [Google Scholar]
- a Harvey M. J.; Giupponi G.; De Fabritiis G. ACEMD: Accelerating Biomolecular Dynamics in the Microsecond Time Scale. J. Chem. Theory Comput. 2009, 5, 1632–1639 10.1021/ct9000685. [DOI] [PubMed] [Google Scholar]; b Johnston J. M.; Filizola M. Showcasing modern molecular dynamics simulations of membrane proteins through G protein-coupled receptors. Curr. Opin. Struct. Biol. 2011, 21, 552–558 10.1016/j.sbi.2011.06.008. [DOI] [PMC free article] [PubMed] [Google Scholar]; c Shaw D. E.; Maragakis P.; Lindorff-Larsen K.; Piana S.; Dror R. O.; Eastwood M. P.; Bank J. A.; Jumper J. M.; Salmon J. K.; Shan Y. B.; Wriggers W. Atomic-Level Characterization of the Structural Dynamics of Proteins. Science 2010, 330, 341–346 10.1126/science.1187409. [DOI] [PubMed] [Google Scholar]; d Lane T. J.; Shukla D.; Beauchamp K. A.; Pande V. S. To milliseconds and beyond: challenges in the simulation of protein folding. Curr. Opin. Struct. Biol. 2013, 23, 58–65 10.1016/j.sbi.2012.11.002. [DOI] [PMC free article] [PubMed] [Google Scholar]
- a Torrie G. M.; Valleau J. P. Nonphysical sampling distributions in Monte Carlo free-energy estimation: Umbrella sampling. J. Comput. Phys. 1977, 23, 187–199 10.1016/0021-9991(77)90121-8. [DOI] [Google Scholar]; b Kumar S.; Bouzida D.; Swendsen R. H.; Kollman P. A.; Rosenberg J. M. The Weighted Histogram Analysis Method for Free-Energy Calculations on Biomolecules 0.1. The Method. J. Comput. Chem. 1992, 13, 1011–1021 10.1002/jcc.540130812. [DOI] [Google Scholar]
- a Grubmüller H. Predicting slow structural transitions in macromolecular systems: Conformational flooding. Phys. Rev. E: Stat. Phys., Plasmas, Fluids, Relat. Interdiscip. Top. 1995, 52, 2893–2906 10.1103/PhysRevE.52.2893. [DOI] [PubMed] [Google Scholar]; b Bouvier B.; Grubmuller H. Molecular dynamics study of slow base flipping in DNA using conformational flooding. Biophys. J. 2007, 93, 770–786 10.1529/biophysj.106.091751. [DOI] [PMC free article] [PubMed] [Google Scholar]
- a Laio A.; Gervasio F. L. Metadynamics: a method to simulate rare events and reconstruct the free energy in biophysics, chemistry and material science. Rep. Prog. Phys. 2008, 71, 126601. 10.1088/0034-4885/71/12/126601. [DOI] [Google Scholar]; b Besker N.; Gervasio F. L.. Using Metadynamics and Path Collective Variables to Study Ligand Binding and Induced Conformational Transitions. Computational Drug Discovery and Design: Methods and Protocols; Springer Protocols; Humana Press: New York, 2012; Vol. 819, pp 501–513. [DOI] [PubMed] [Google Scholar]
- a Darve E.; Pohorille A. Calculating free energies using average force. J. Chem. Phys. 2001, 115, 9169–9183 10.1063/1.1410978. [DOI] [Google Scholar]; b Darve E.; Rodriguez-Gomez D.; Pohorille A. Adaptive biasing force method for scalar and vector free energy calculations. J. Chem. Phys. 2008, 128, 144120. 10.1063/1.2829861. [DOI] [PubMed] [Google Scholar]
- a Zheng L. Q.; Yang W. Practically Efficient and Robust Free Energy Calculations: Double-Integration Orthogonal Space Tempering. J. Chem. Theory Comput. 2012, 8, 810–823 10.1021/ct200726v. [DOI] [PubMed] [Google Scholar]; b Zheng L.; Chen M.; Yang W. Random walk in orthogonal space to achieve efficient free-energy simulation of complex systems. Proc. Natl. Acad. Sci. U. S. A. 2008, 105, 20227–32 10.1073/pnas.0810631106. [DOI] [PMC free article] [PubMed] [Google Scholar]
- a Hamelberg D.; Mongan J.; McCammon J. A. Accelerated molecular dynamics: A promising and efficient simulation method for biomolecules. J. Chem. Phys. 2004, 120, 11919–11929 10.1063/1.1755656. [DOI] [PubMed] [Google Scholar]; b Hamelberg D.; de Oliveira C. A. F.; McCammon J. A. Sampling of slow diffusive conformational transitions with accelerated molecular dynamics. J. Chem. Phys. 2007, 127, 155102. 10.1063/1.2789432. [DOI] [PubMed] [Google Scholar]
- a Wereszczynski J.; McCammon J. A. Nucleotide-dependent mechanism of Get3 as elucidated from free energy calculations. Proc. Natl. Acad. Sci. U. S. A. 2012, 109, 7759–7764 10.1073/pnas.1117441109. [DOI] [PMC free article] [PubMed] [Google Scholar]; b Gasper P. M.; Fuglestad B.; Komives E. A.; Markwick P. R. L.; McCammon J. A. Allosteric networks in thrombin distinguish procoagulant vs. anticoagulant activities. Proc. Natl. Acad. Sci. U. S. A. 2012, 109, 21216–21222 10.1073/pnas.1218414109. [DOI] [PMC free article] [PubMed] [Google Scholar]; c Pierce L. C. T.; Markwick P. R. L.; McCammon J. A.; Doltsinis N. L. Accelerating chemical reactions: Exploring reactive free-energy surfaces using accelerated ab initio molecular dynamics. J. Chem. Phys. 2011, 134, 174107. 10.1063/1.3581093. [DOI] [PMC free article] [PubMed] [Google Scholar]; d Bucher D.; Grant B. J.; Markwick P. R.; McCammon J. A. Accessing a Hidden Conformation of the Maltose Binding Protein Using Accelerated Molecular Dynamics. PLoS Comput. Biol. 2011, 7, e1002034. 10.1371/journal.pcbi.1002034. [DOI] [PMC free article] [PubMed] [Google Scholar]; e Wang Y.; Markwick P. R. L.; de Oliveira C. A. F.; McCammon J. A. Enhanced Lipid Diffusion and Mixing in Accelerated Molecular Dynamics. J. Chem. Theory Comput. 2011, 7, 3199–3207 10.1021/ct200430c. [DOI] [PMC free article] [PubMed] [Google Scholar]
- a Pierce L. C. T.; Salomon-Ferrer R.; de Oliveira C. A. F.; McCammon J. A.; Walker R. C. Routine Access to Millisecond Time Scale Events with Accelerated Molecular Dynamics. J. Chem. Theory Comput. 2012, 8, 2997–3002 10.1021/ct300284c. [DOI] [PMC free article] [PubMed] [Google Scholar]; b Miao Y.; Nichols S. E.; Gasper P. M.; Metzger V. T.; McCammon J. A. Activation and dynamic network of the M2 muscarinic receptor. Proc. Natl. Acad. Sci. U. S. A. 2013, 110, 10982–10987 10.1073/pnas.1309755110. [DOI] [PMC free article] [PubMed] [Google Scholar]; c Miao Y.; Caliman A. D.; McCammon J. A. Allosteric Effects of Sodium Ion Binding on Activation of the M3Muscarinic G-Protein Coupled Receptor. Biophys. J. 2015, 108, 1796–1806 10.1016/j.bpj.2015.03.003. [DOI] [PMC free article] [PubMed] [Google Scholar]
- Shen T. Y.; Hamelberg D. A statistical analysis of the precision of reweighting-based simulations. J. Chem. Phys. 2008, 129, 034103. 10.1063/1.2944250. [DOI] [PubMed] [Google Scholar]
- a Miao Y.; Nichols S. E.; McCammon J. A. Free Energy Landscape of G-Protein Coupled Receptors, Explored by Accelerated Molecular Dynamics. Phys. Chem. Chem. Phys. 2014, 16, 6398–6406 10.1039/c3cp53962h. [DOI] [PMC free article] [PubMed] [Google Scholar]; b Kappel K.; Miao Y.; McCammon J. A.. Accelerated Molecular Dynamics Simulations of Ligand Binding to a Muscarinic G-protein Coupled Receptor. Quarterly Reviews of Biophysics 2015, DOI: 10.1017/S0033583515000153. [DOI] [PMC free article] [PubMed] [Google Scholar]
- Miao Y.; Sinko W.; Pierce L.; Bucher D.; Walker R. C.; McCammon J. A. Improved reweighting of accelerated molecular dynamics simulations for free energy calculation. J. Chem. Theory Comput. 2014, 10, 2677–2689 10.1021/ct500090q. [DOI] [PMC free article] [PubMed] [Google Scholar]
- Miao Y.; Feixas F.; Eun C.; McCammon J. A. Accelerated molecular dynamics simulations of protein folding. J. Comput. Chem. 2015, 36, 1536–49 10.1002/jcc.23964. [DOI] [PMC free article] [PubMed] [Google Scholar]
- Lange O. F.; Grubmuller H. Full correlation analysis of conformational protein dynamics. Proteins: Struct., Funct., Genet. 2008, 70, 1294–1312 10.1002/prot.21618. [DOI] [PubMed] [Google Scholar]
- Le Grand S.; Gotz A. W.; Walker R. C. SPFP: Speed without compromise-A mixed precision model for GPU accelerated molecular dynamics simulations. Comput. Phys. Commun. 2013, 184, 374–380 10.1016/j.cpc.2012.09.022. [DOI] [Google Scholar]
- a Case D. A.; Darden T. A.; Cheatham T. E. III; Simmerling C. L.; Wang J.; Duke R. E.; Luo R.; Walker R. C.; Zhang W.; Merz K. M.; Roberts B.; Hayik S.; Roitberg A.; Seabra G.; Swails J.; Goetz A. W.; Kolossváry I.; Wong K. F.; Paesani F.; Vanicek J.; Wolf R. M.; Liu J.; Wu X.; Brozell S. R.; Steinbrecher T.; Gohlke H.; Cai Q.; Ye X.; Wang J.; Hsieh M.-J.; Cui G.; Roe D. R.; Mathews D. H.; Seetin M. G.; Salomon-Ferrer R.; Sagui C.; Babin V.; Luchko T.; Gusarov S.; Kovalenko A.; Kollman P. A.. AMBER 12; University of California: San Francisco, 2012.; b Gotz A. W.; Williamson M. J.; Xu D.; Poole D.; Le Grand S.; Walker R. C. Routine Microsecond Molecular Dynamics Simulations with AMBER on GPUs. 1. Generalized Born. J. Chem. Theory Comput. 2012, 8, 1542–1555 10.1021/ct200909j. [DOI] [PMC free article] [PubMed] [Google Scholar]; c Salomon-Ferrer R.; Götz A. W.; Poole D.; Le Grand S.; Walker R. C. Routine Microsecond Molecular Dynamics Simulations with AMBER on GPUs. 2. Explicit Solvent Particle Mesh Ewald. J. Chem. Theory Comput. 2013, 9, 3878–3888 10.1021/ct400314y. [DOI] [PubMed] [Google Scholar]; d Salomon-Ferrer R.; Case D. A.; Walker R. C. An overview of the Amber biomolecular simulation package. Wiley Interdisciplinary Reviews-Computational Molecular Science 2013, 3, 198–210 10.1002/wcms.1121. [DOI] [Google Scholar]
- Sinko W.; Miao Y.; de Oliveira C. A. F.; McCammon J. A. Population Based Reweighting of Scaled Molecular Dynamics. J. Phys. Chem. B 2013, 117, 12759–12768 10.1021/jp401587e. [DOI] [PMC free article] [PubMed] [Google Scholar]
- Jorgensen W. L.; Chandrasekhar J.; Madura J. D.; Impey R. W.; Klein M. L. Comparison of Simple Potential Functions for Simulating Liquid Water. J. Chem. Phys. 1983, 79, 926–935 10.1063/1.445869. [DOI] [Google Scholar]
- Ryckaert J.-P.; Ciccotti G.; Berendsen H. J. C. Numerical integration of the cartesian equations of motion of a system with constraints: molecular dynamics of n-alkanes. J. Comput. Phys. 1977, 23, 327–341 10.1016/0021-9991(77)90098-5. [DOI] [Google Scholar]
- Berendsen H. J. C.; Postma J. P. M.; Vangunsteren W. F.; Dinola A.; Haak J. R. Molecular-Dynamics with Coupling to an External Bath. J. Chem. Phys. 1984, 81, 3684–3690 10.1063/1.448118. [DOI] [Google Scholar]
- Essmann U.; Perera L.; Berkowitz M. L.; Darden T.; Lee H.; Pedersen L. G. A Smooth Particle Mesh Ewald Method. J. Chem. Phys. 1995, 103, 8577–8593 10.1063/1.470117. [DOI] [Google Scholar]
- Roe D. R.; Cheatham T. E. PTRAJ and CPPTRAJ: Software for Processing and Analysis of Molecular Dynamics Trajectory Data. J. Chem. Theory Comput. 2013, 9, 3084–3095 10.1021/ct400341p. [DOI] [PubMed] [Google Scholar]
- Humphrey W.; Dalke A.; Schulten K. VMD: Visual molecular dynamics. J. Mol. Graphics 1996, 14, 33–38 10.1016/0263-7855(96)00018-5. [DOI] [PubMed] [Google Scholar]
- Enemark S.; Kurniawan N. A.; Rajagopalan R. beta-hairpin forms by rolling up from C-terminal: Topological guidance of early folding dynamics. Sci. Rep. 2012, 2, 649. 10.1038/srep00649. [DOI] [PMC free article] [PubMed] [Google Scholar]
- Kuhrova P.; De Simone A.; Otyepka M.; Best R. B. Force-Field Dependence of Chignolin Folding and Misfolding: Comparison with Experiment and Redesign. Biophys. J. 2012, 102, 1897–1906 10.1016/j.bpj.2012.03.024. [DOI] [PMC free article] [PubMed] [Google Scholar]
- Miao Y.; Feixas F.; Eun C.; McCammon J. A. Accelerated molecular dynamics simulations of protein folding. J. Comput. Chem. 2015, 36, 1536. 10.1002/jcc.23964. [DOI] [PMC free article] [PubMed] [Google Scholar]
- a Feher V. A.; Baldwin E. P.; Dahlquist F. W. Access of ligands to cavities within the core of a protein is rapid. Nat. Struct. Biol. 1996, 3, 516–521 10.1038/nsb0696-516. [DOI] [PubMed] [Google Scholar]; b Baase W. A.; Liu L. J.; Tronrud D. E.; Matthews B. W. Lessons from the lysozyme of phage T4. Protein Sci. 2010, 19, 631–641 10.1002/pro.344. [DOI] [PMC free article] [PubMed] [Google Scholar]; c Feher V. A.; Pierce L. C. T.; McCammon J. A.; Amaro R.. Ligand gating, cavity fluidity and conformational selection observed for T4 lysozyme cavity mutants sampled by aMD simulation.. Modeling of Biomolecular Systems Interactions, Dynamics, and Allostery: Bridging Experiments and Computations, Biophysical Society Thematic Meeting: Program & Abstracts, Sep. 10–14, 2014, Istanbul, Turkey; 2014; 96-POS.
- a Eriksson A. E.; Baase W. A.; Wozniak J. A.; Matthews B. W. A Cavity-Containing Mutant of T4 Lysozyme Is Stabilized by Buried Benzene. Nature 1992, 355, 371–373 10.1038/355371a0. [DOI] [PubMed] [Google Scholar]; b Morton A.; Matthews B. W. Specificity of Ligand-Binding in a Buried Nonpolar Cavity of T4 Lysozyme - Linkage of Dynamics and Structural Plasticity. Biochemistry 1995, 34, 8576–8588 10.1021/bi00027a007. [DOI] [PubMed] [Google Scholar]; c Merski M.; Fischer M.; Balius T. E.; Eidam O.; Shoichet B. K. Homologous ligands accommodated by discrete conformations of a buried cavity. Proc. Natl. Acad. Sci. U. S. A. 2015, 112, 5039–5044 10.1073/pnas.1500806112. [DOI] [PMC free article] [PubMed] [Google Scholar]
- Deng Y. Q.; Roux B. Computations of Standard Binding Free Energies with Molecular Dynamics Simulations. J. Phys. Chem. B 2009, 113, 2234–2246 10.1021/jp807701h. [DOI] [PMC free article] [PubMed] [Google Scholar]
- Buch I.; Giorgino T.; De Fabritiis G. Complete reconstruction of an enzyme-inhibitor binding process by molecular dynamics simulations. Proc. Natl. Acad. Sci. U. S. A. 2011, 108, 10184–10189 10.1073/pnas.1103547108. [DOI] [PMC free article] [PubMed] [Google Scholar]
- Dror R. O.; Green H. F.; Valant C.; Borhani D. W.; Valcourt J. R.; Pan A. C.; Arlow D. H.; Canals M.; Lane J. R.; Rahmani R.; Baell J. B.; Sexton P. M.; Christopoulos A.; Shaw D. E. Structural basis for modulation of a G-protein-coupled receptor by allosteric drugs. Nature 2013, 503, 295–299 10.1038/nature12595. [DOI] [PubMed] [Google Scholar]
- a Bussi G.; Gervasio F. L.; Laio A.; Parrinello M. Free-energy landscape for beta hairpin folding from combined parallel tempering and metadynamics. J. Am. Chem. Soc. 2006, 128, 13435–13441 10.1021/ja062463w. [DOI] [PubMed] [Google Scholar]; b Marinelli F.; Pietrucci F.; Laio A.; Piana S. A Kinetic Model of Trp-Cage Folding from Multiple Biased Molecular Dynamics Simulations. PLoS Comput. Biol. 2009, 5, e1000452. 10.1371/journal.pcbi.1000452. [DOI] [PMC free article] [PubMed] [Google Scholar]
- Pietrucci F.; Marinelli F.; Carloni P.; Laio A. Substrate Binding Mechanism of HIV-1 Protease from Explicit-Solvent Atomistic Simulations. J. Am. Chem. Soc. 2009, 131, 11811–11818 10.1021/ja903045y. [DOI] [PubMed] [Google Scholar]
- Hansmann U. H. E. Parallel tempering algorithm for conformational studies of biological molecules. Chem. Phys. Lett. 1997, 281, 140–150 10.1016/S0009-2614(97)01198-6. [DOI] [Google Scholar]
- a Sugita Y.; Okamoto Y. Replica-exchange multicanonical algorithm and multicanonical replica-exchange method for simulating systems with rough energy landscape. Chem. Phys. Lett. 2000, 329, 261–270 10.1016/S0009-2614(00)00999-4. [DOI] [Google Scholar]; b Fajer M.; Hamelberg D.; McCammon J. A. Replica-Exchange Accelerated Molecular Dynamics (REXAMD) Applied to Thermodynamic Integration. J. Chem. Theory Comput. 2008, 4, 1565–1569 10.1021/ct800250m. [DOI] [PMC free article] [PubMed] [Google Scholar]
- a Hummer G. Fast-growth thermodynamic integration: Error and efficiency analysis. J. Chem. Phys. 2001, 114, 7330–7337 10.1063/1.1363668. [DOI] [Google Scholar]; b Eastwood M. P.; Hardin C.; Luthey-Schulten Z.; Wolynes P. G. Statistical mechanical refinement of protein structure prediction schemes: Cumulant expansion approach. J. Chem. Phys. 2002, 117, 4602–4615 10.1063/1.1494417. [DOI] [Google Scholar]
Associated Data
This section collects any data citations, data availability statements, or supplementary materials included in this article.