

Abstract
Cells undergo controlled changes in morphology in response to intracellular and extracellular signals. These changes require a means for sensing and interpreting the signalling cues, for generating the forces that act on the cell's physical material, and a control system to regulate this process. Experiments on Dictyostelium amoebae have shown that force-generating proteins can localize in response to external mechanical perturbations. This mechanosensing, and the ensuing mechanical feedback, plays an important role in minimizing the effect of mechanical disturbances in the course of changes in cell shape, especially during cell division, and likely in other contexts, such as during three-dimensional migration. Owing to the complexity of the feedback system, which couples mechanical and biochemical signals involved in shape regulation, theoretical approaches can guide further investigation by providing insights that are difficult to decipher experimentally. Here, we present a computational model that explains the different mechanosensory and mechanoresponsive behaviours observed in Dictyostelium cells. The model features a multiscale description of myosin II bipolar thick filament assembly that includes cooperative and force-dependent myosin–actin binding, and identifies the feedback mechanisms hidden in the observed mechanoresponsive behaviours of Dictyostelium cells during micropipette aspiration experiments. These feedbacks provide a mechanistic explanation of cellular retraction and hence cell shape regulation.
Keywords: cell shape regulation, force feedback, mechanosensing, myosin II
1. Introduction
The regulation of cell morphology marks an important step during pattern formation and cell-type specialization in multicellular development [1–4]. In amoebazoans and metazoans, the shape of most cells is largely determined by the actin cytoskeleton, a network consisting of actin filaments and cross-linking and motor proteins. Other proteins connect this network to the plasma membrane allowing external forces to influence the actin cytoskeleton. Cell morphology is influenced by both internal and external forces acting on the cell's physical material, all under the regulation of biochemical signalling pathways [5]. Internal forces could be generated by actin filament assembly and disassembly dynamics and by myosin motors acting upon these filaments [4,6], or owing to changes in osmotic pressure [7]. The external forces are those that arise from the cell's interactions with neighbouring cells or the extracellular matrix [7]. Propagation of these forces through the actin network also depends on the actin-cross-linking proteins, which link the filaments together establishing the network.
Although cell shape changes are usually envisioned as open-loop processes in which forces acting on the physical material of the cell lead to changes in morphology, ample evidence demonstrates that the mechanical response of cells to forces is highly regulated [1,4,8,9]. For example, Dictyostelium cells subjected to mechanical stresses through micropipette aspiration (MPA) or agar overlay respond by locally recruiting motor (myosin II) and other cross-linking proteins (e.g. cortexillin I, α-actinin, fimbrin, etc.) to the site of applied stress [10,11]. This response suggests the existence of a mechanism for sensing and actively controlling cellular shape.
Further experiments have demonstrated that this mechanosensation acts by regulating myosin II bipolar thick filament (BTF) assembly–disassembly dynamics [12], and that the external force applied on the cell membrane is directly transmitted to the cell cortex by membrane–cortex anchoring proteins and is shared between myosin II and other actin-cross-linking proteins [13]. Furthermore, depletion of any of the actin cross-linkers leads to a redistribution of the force that would be borne by that cross-linker on to the remaining proteins resulting in greater mechanosensitive myosin II accumulation [13]. This accumulation of myosin II and specific actin cross-linkers allows the cell to counteract the strain induced by internal or external mechanical stresses, so that the cell can control its resulting shape.
This mechanochemical system connects the cell's force-generating proteins with its mechanosensory system, forming a biomechanical feedback loop. Owing to the complexity of the mechanochemically interlinked feedback loop, understanding the mechanisms of this shape control calls for the development of theoretical approaches that can guide further experimentation and investigation. Such theoretical approaches offer insights that are difficult to discern from experiments alone. A first step towards explaining the mechanosensory step was the development of a dynamical model of myosin BTF assembly with force-sensitive steps [12]. Incorporation of cooperative and force-dependent myosin–actin binding led to simulations that successfully recreated the cooperative binding of myosin to actin observed experimentally [14]. While this model explains the accelerating (or rising) phase of mechanosensitive myosin II accumulation observed during MPA experiments, it was not designed to address the feedback effect of myosin accumulation and hence the biphasic kinetics observed experimentally. A parallel effort considered the effect of myosin II accumulation on cell morphology [13]. Viscoelastic descriptions of both wild-type (WT) [15] and genetically modified Dictyostelium cells [13] were obtained based on MPA experiments. Using experimentally measured myosin II intensities arising in response to applied stress, a dynamic description of the total stress acting on the cell was calculated. Simulations that assumed that this stress acted on the viscoelastic models recreated the observed pattern of deformation of the cells [13]. Once again, however, this model did not address the feedback nature of the interaction between myosin mechanosensory accumulation and stresses generated.
In summary, the above-described models independently explain the parts of the mechanosensitive accumulation and ensuing cellular retraction, but do not delineate the mechanochemical regulation hidden in this mechanosensing and mechanical feedback system. In this study, we present a generalized biomechanical feedback model by expanding and coupling the previously established model for BTF assembly to explain the biphasic nature of mechanosensitive myosin accumulation and the ensuing cellular retraction as observed in MPA experiments. Specifically, we are now able to explain an entire cell morphological event including the initial change in cell shape, the molecular dynamics of myosin-II-mediated accumulation and the resulting contractility, all of which is stimulated by a single initial signal input, specifically an applied stress. Further, the biomechanical feedback model suggests the presence of a new element of myosin II regulation, namely a compliant element in the myosin II tail, which allows for indirect regulation of an enzyme where mechanical force acts upon the enzyme's substrate.
2. Material and methods
2.1. Description of forces acting in an aspirated cell
Cellular deformation is a function of net stresses acting on the cell's material along with the mechanical properties of a cell. Total stress transmitted to the cell cortex is given by a balance of internal and external forces acting on an aspirated cell (figure 1a). This balance is given by
Figure 1.

Force feedback model. (a) Cartoon describing the stresses acting in an aspirated cell. (b) Assembly scheme for BTF formation (adapted from [13,14]). (c) Viscoelastic model used to simulate cell deformations. (d) Force feedback model incorporating the feedback effects arising from myosin accumulation by coupling BTF assembly dynamics to viscoelastic model for cellular deformation. (Online version in colour.)
Here, σapplied represents the externally imposed mechanical stresses (e.g. from the micropipette aspirator) and σinternal is the sum of all internally generated stresses. Some of the latter arise from cortical tension, and some are due to active myosin-II-driven contractility [15,16]. For example, based on the Young–Laplace equation for liquid interfaces, the equilibrium surface tension experienced by a spherical cell of radius r is  [17]. Because the local curvature (or radius) of the cell is different between the aspirated and non-aspirated ends, this contribution differs between the two ends. We denote
  and
and  as stresses on the left (non-aspirated) and right (aspirated) sides, respectively, and the net stress as
 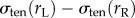 . We also account for the increased stresses on the aspirated side owing to accumulation of actin cross-linking proteins (
 ) and myosin II (
 ). Both these terms are functions of the local concentration of myosin II and cross-linkers, denoted by Imyo, and Icross, respectively, at the aspirated end of the cell. Thus,
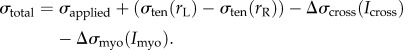 |
For an aspirated cell at rest, the net stress at the site of aspiration ( ) balances the stress from the non-aspirated side (
 ), which maintains the spherical shape of the cell. During aspiration, the cortical tension again resists the externally applied stress and rejects the shape disturbance imposed by external stress. For this reason, the signs in front of
  ,
,  and
and  in the above equation are all negative. In practice, the accumulation of cross-linkers and myosin II differs, though there is a strong correlation between the two [10,14]. To keep the model simple, we assumed that the increase in accumulation of the cross-linkers is the same as that of myosin II; i.e. Icross = Imyo.
In our simulations, unless otherwise stated, σapplied is taken to be 1 nN µm−2. The stress from the resting cortical tension on the non-aspirated side of the cell  is given by the Young–Laplace equation
where γten0 is the resting cortical tension which is measured by MPA experiments on each of the cell types considered. The measured values are listed in table 1. Rc is the spherical cell radius (5 µm). The stress from resting cortical tension at the aspirated side  is also given by the Young–Laplace equation. However, the curvatures are different between the aspirated and non-aspirated sides. Therefore,
where Rcap is the radius of the spherical or hemispherical cap formed inside the pipette. This radius transitions from the radius of a spherical cell to that of a pipette over the course of aspiration and can be written as a function of cellular protrusion length (Lp) from the geometric relations connecting Rcap and Lp (derived in [15]). Because the experiments and simulations presented in this paper are above the critical aspiration pressure (pressure at which Lp = Rp), Rcap reaches the value of Rp (2.5 µm) in less than 1 s, so the curvature at the aspirated site is taken to be 2/Rp.
Table 1.
Values of viscoelastic model parameters used in simulations of generalized biomechanical feedback model.

During aspiration experiments, mechanosensitive accumulation of actin cross-linking proteins and myosin II contribute to an increase in cortical tension at the site of aspiration. The stress owing to an increase in cortical tension is given by
where Δγ (0.3 nN µm−1) is the change in cortical tension at the site of aspiration owing to accumulation of cross-linking proteins, and Icross is the intensity of cross-linkers accumulated at the tip of the aspirated cell. Finally, the accumulated cross-linker intensity Icross is normalized against the steady-state intensity, Iss.
The increase in resistive stress from the motor activity of mechanosensitive myosin accumulation ( ) is given by the formula
As myosin BTF is the functional form of myosin with the ability to generate contractile force, the amount of myosin in BTF form over the volume of hemispherical cap in the pipette is first calculated. To determine this BTF amount, we calculated the concentration of myosin in BTF form (CBTF) over the surface of the hemispherical cap and multiplied by the cortex thickness (h = 0.5 µm), and Avogadro's number (NA). The number of molecules in BTF form is then multiplied by 2 to account for the number of heads in a myosin II monomer. To calculate the contractile force from myosin, we multiply the number of molecules in BTF form by the force per head (F/H = 4 pN) and duty ratio (0.06, assuming a 10-fold shift owing to externally imposed load from the unloaded duty ratio value of 0.006 [18]). Finally, we calculate the resistive stress from myosin force by dividing the surface area of the hemispherical cap.
2.2. Bipolar thick filament assembly model
The functional form of myosin II is the BTF, which is a macromolecular assembly formed by the association of tails of myosin II motors. The myosin heads on these assembled BTFs pull the anti-parallel actin filaments, generating the contractile force necessary for cell movement [19].
The first step in the BTF assembly process is the conversion of assembly incompetent ( ) to assembly competent myosin monomers (M). The interconversion between the two states is governed by myosin heavy chain kinase (MHCK) and phosphatase. Furthermore, in vitro experiments using actin filaments and purified Dictyostelium myosin II revealed that the self-association of myosin monomers into BTFs is accelerated by the presence of actin filaments, and that this accelerated myosin assembly requires transient binding of myosin to actin before incorporation into BTFs [20]. The effect of actin filaments on myosin assembly has been incorporated into the BTF assembly scheme through the actin-bound assembly incompetent
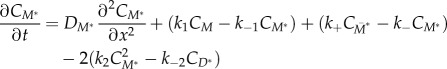
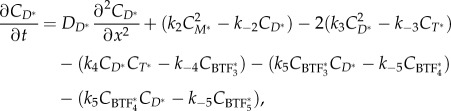
  and competent (M*) myosin monomer forms. Further, the actin-bound competent myosin monomer (M*) form is considered to be the fundamental unit of BTF assembly. Then, M* undergoes parallel association to form dimers (D*). These dimers then associate in an anti-parallel fashion to form the tetramer
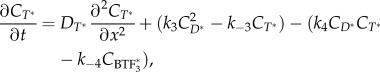
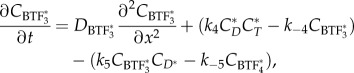
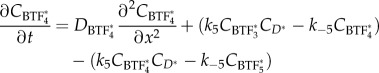
  . The process of assembling a tetramer from monomers constitutes the nucleation process of BTF assembly. The dimers then add laterally to the bipolar tetramer to build the BTFs, which range in size from 3 to 36 dimers for Dictyostelium myosin II. The assembly scheme describing this process is illustrated in figure 1b. The dynamics of BTF assembly can be modelled using reaction–diffusion equations (2.1)–(2.9).
| 2.1 |
| 2.2 |
| 2.3 |
 |
2.4 |
 |
2.5 |
 |
2.6 |
 |
2.7 |
 |
2.8 |
| 2.9 |
where each of the C terms describes the concentration of the specific species. In theory, the system of reaction–diffusion equations could be extended up to  , however, we have limited the model to
  to reduce the computational complexity arising from solving a larger system of equations.
The parameters and their values used for solving the BTF assembly scheme are listed in table 2. Furthermore, because the detachment of bound myosin from actin is force-dependent [30], and the isometric, cooperative binding state yields a slower unbinding rate ([14] and references therein), the effect of cooperative and force-dependent myosin actin interactions is incorporated into the rate constant k−1. The form used to describe this molecular dependency is based on a molecular-level catch bond model proposed by Bell [31].
Table 2.
BTF assembly model parameters.
| parameter | value (unit) | references |
|---|---|---|
 |
0.8 µm2 s−1 | [21] |
 |
0.002 µm2 s−1 | estimated |
 |
0 µm2 s−1 | estimated |
| k+ | 0.05 s−1 | [22] |
 |
300 s−1 | [23] |
| k2 | 0.37 µM−1 s−1 | [24] |
| k−2 | 0.01 s−1 | [14] |
| k3 | 0.0395 µM−1 s−1 | [24] |
| k−3 | 0.045 s−1 | [23] |
| k4 | 1.25 µM−1 s−1 | [23] |
| k−4 | 0.025 s−1 | [23] |
| k5 | 10 µM−1 s−1 | [14] |
| k−5 | 0.2 s−1 | [25–27] |
| kon | 0.45 µM−1 s−1 | [28] |
 |
72 µM | [29] |
 |
79 µM | [26] |
 |
3.4 µM | [27] |
| k− | 0.259−0.262 s−1 | estimated |
| k1 |  |
[14] |
| χ1 | 11.11 kBT Nm | [14] |
| χ2 | 1.92 kBT Nm | [14] |
| ϕ* | 0.18 | [14] |
 |
0.008 s−1 | estimated in electronic supplementary material, figure S3 |
Based on the Bell model, k−1 can be written as
| 2.10 |
where  is the unbinding rate constant in the absence of force and cooperative interactions, and ΔEb is the change in binding energy (Eb) associated with cooperative and force-dependent myosin II–actin binding, which can be written as
| 2.11 |
Here, the first term, ΔEs, is the change in strain energy (Es) associated with myosin–actin cooperative interactions and is calculated from mean-field approximations of myosin–actin binding [14]. The second term in equation (2.11) corresponds to the fraction of total transmitted force (Ftotal) or stress (σtotal) that is shared between bound myosin heads (αm).
The change in strain energy, ΔEs, can be approximated as a piecewise linear function given
| 2.12 |
where ϕ is the fraction of myosin bound to F-actin; χ1 and χ2 are the slopes of the mean-field approximation of myosin–actin binding. The bound myosin fraction ϕ is related to bound myosin (m) and actin concentration (Cactin) by the following relation
| 2.13 |
The factor 3 comes from the assumption that each binding site consists of three neighbouring actin monomers in a double helical actin filament ([14] and references there in). Following the above relation, equation (2.12) can also be written in terms of bound myosin concentration (m). The bound myosin concentration (m) introduced in equation (2.12) and equation (2.13) is written in terms of bound myosin monomer concentration in BTF form as
| 2.14 |
Based on the force-sharing model resulting from experiments on interphase Dictyostelium cells, WT myosin bears approximately one-seventh of the transmitted force and deletion of several other cross-linkers increases the force borne by myosin. Therefore, the fraction of transmitted force borne by myosin based on the force-sharing model can be written as
| 2.15 |
Here, Imyo(t) is the accumulated myosin intensity ratio. This is normalized against the steady state myosin intensity ratio (Iss). Imyo(t) is the ratio of total myosin concentration at the tip (Ip) and the opposite cortex (Io) of an aspirated cell
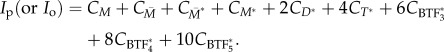 |
This expression calculates the total myosin concentration in terms of the number of myosin monomers in each of the higher-order forms (i.e. dimers, tetramers or BTFs). Although the effect of cross-linking proteins could be incorporated into the equation for force fraction, the resulting myosin intensity was not different from that calculated from equation (2.15) (electronic supplementary material, figure S1).
2.3. Linking viscoelastic mechanical model to feedback model to explain cellular deformations
To explain the cellular deformation resulting from mechanosensitive myosin II accumulation, a viscoelastic model of Dictyostelium cells previously obtained from MPA experiments [15] is coupled to the BTF assembly model with force feedback (figure 1c,d).
The viscoelastic model used here is a system consisting of two elements: a damper (γa) in series with the parallel combination of a damper (γc) and elastic (kc) element [13,15]. The displacement of the two elements is denoted by xa and xc, respectively. For an applied stress, σtotal, the rate of change of displacement of the two elements is given by
The total displacement of the two elements, x = xa + xc, is also the Lp of a cell aspirated into a micropipette. Thus, the rate of change of total displacement or cellular deformation is given by
The total displacement is obtained by solving the following system of equations
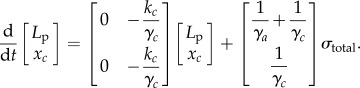 |
2.16 |
2.4. Solving the equations pertaining to the complete biomechanical feedback model
The complete biomechanical feedback model consists of
(1) partial reaction–diffusion equations ((2.1)–(2.9)), including the equations ((2.10)–(2.13)) for cooperative and force-dependent myosin–actin binding, all of which describe the BTF assembly scheme;
(2) compartmental ordinary differential equations (3.1) that describe the conversion between the various BTF assembly states; and
(3) ordinary differential equations (2.16) accounting for the cellular deformation.
These equations were solved using Comsol Multiphysics (Burlington, MA, USA) v. 4.3. The spatial simulations assumed the three-dimensional geometry of an aspirated cell, with stress profile σtotal cos(θ) applied to the tip of the aspirated cell. All equations pertaining to the complete biomechanical feedback model were first solved at steady-state using a nonlinear stationary solver, and the resultant solution was used as the initial condition for subsequent time-dependent solutions. For time-dependent solutions, a multifrontal massively parallel sparse direct solver, along with a backward differentiation formula time-stepping method was used. For most of the simulations, the time step for the computation was allowed to be chosen by the solver through the ‘free’ time-stepping option with a maximum time step chosen by the solver fixed to 0.1 s. These simulations took approximately 1–5 h of CPU time on a desktop machine for a total simulated time of 300 s. However, for certain parameters in the BTF assembly scheme, the above-described simulation setting gave rise to numerical instabilities. To overcome these numerical instabilities, an ‘intermediate’ time-stepping option along with a fixed time step of 0.05 s was used. These simulations took approximately 20 h of CPU time on a desktop machine for a total simulation time of 300 s.
3. Results
3.1. Mechanosensitive myosin II accumulation during micropipette aspiration experiments displays biphasic kinetics
When WT or genetically modified Dictyostelium cells are subjected to constant mechanical perturbation through a micropipette aspirator, myosin II is recruited to the site of deformation [10,12–14] (figure 1a). The kinetics of myosin II accumulation in each of the cell types can be characterized as three distinct temporal phases: an initial accelerating accumulation, followed by a plateau, and subsequent decay (figure 2, left panels; [13,14]). The cooperative rising phase can be explained by the presence of a positive feedback loop that is formed by force-dependent cooperative interaction between myosin and actin [14]. This cooperativity, however, does not explain the ensuing plateau and eventual fall. We conjectured that the biphasic accumulation of myosin II could be due to a build-up of myosin-II-driven contractile stress that arises from increases in myosin II localization. Thus, the contractile force generated by myosin accumulation would close a negative feedback loop that would help to counteract the applied external stress. In mutant cells lacking specific actin cross-linkers, the magnitude of myosin II accumulation is higher than in WT cells. Moreover, in several of these cell types, this accumulation is accompanied by retraction of cells from the micropipette despite maintaining a constant aspiration pressure (figure 2, right panels). We hypothesize that the increased accumulation is due to a redistribution of force that increases the amount of stress borne by myosin II and the remaining cross-linkers [13]. This greater accumulation likely increases the cortical resistance leading to the observed retraction of cells.
Figure 2.

Biphasic myosin accumulation and ensuing retraction observed in WT and mutant Dictyostelium cells depleted of different actin cross-linking proteins. Left panels show myosin intensity at the site of aspiration (Ip) normalized against the intensity at the cortex opposite to the site of aspiration (Io). Right panels show length of cell protrusion (Lp) into the pipette measured during the course of aspiration for different Dictyostelium strains. The blue and red data presented in this figure are measurements of single cells; the black markers denote their average. Some of these data were published in [13]. (Online version in colour.)
3.2. Force feedback alone is not sufficient to recreate the biphasic response
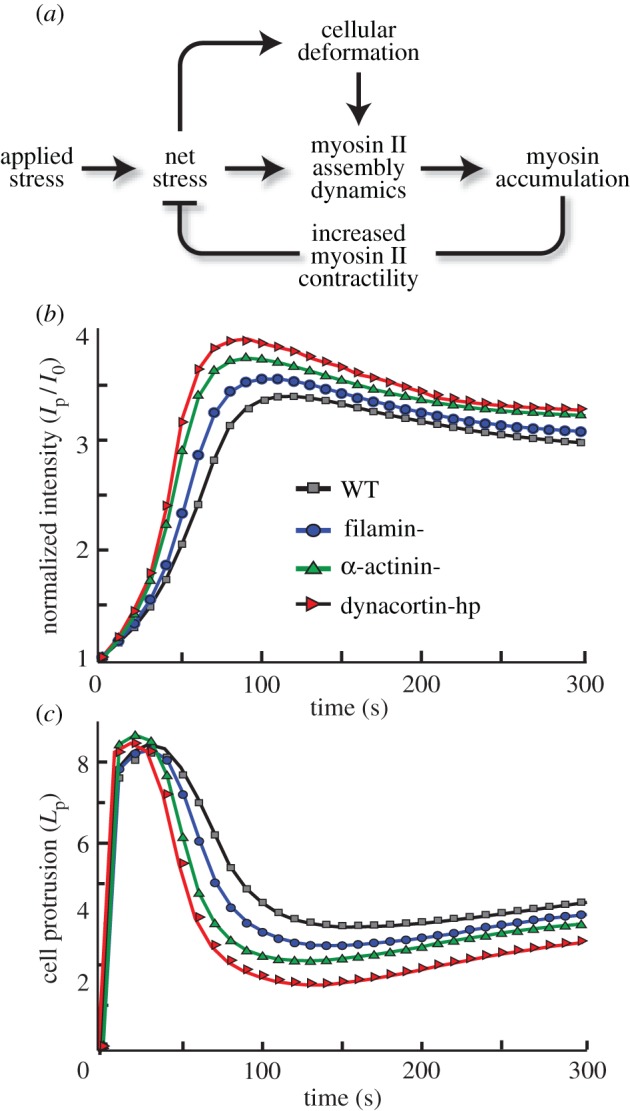
To explore quantitatively the observed biomechanical regulation during mechanosensitive myosin II accumulation, we developed a computational model that accounts for the feedback effects arising from myosin accumulation (figure 3a). We first identified the total stress transmitted to the cell cortex (figure 1a; §2). To explain how stress leads to myosin II accumulation, we used a mathematical model that describes stress-dependent myosin II BTF assembly (figure 1b; [14]). This model couples cooperative and force-dependent myosin actin binding to the myosin II BTF assembly scheme (§2). We simulated the system assuming an externally applied stress, but without incorporating any effect arising from the accumulation of myosin (i.e.  ). In other words, the change in binding energy (ΔEb) associated with myosin–actin binding described in equation (2.11) is a function of externally applied stress and resultant ΔEs only. These simulations recreated the stress-dependent accelerating phase of myosin accumulation (figure 3b, no feedback). However, the accumulation did not stabilize, but rose unboundedly. Thus, the existing BTF assembly model cannot explain the complete biphasic nature of the response.
Figure 3.
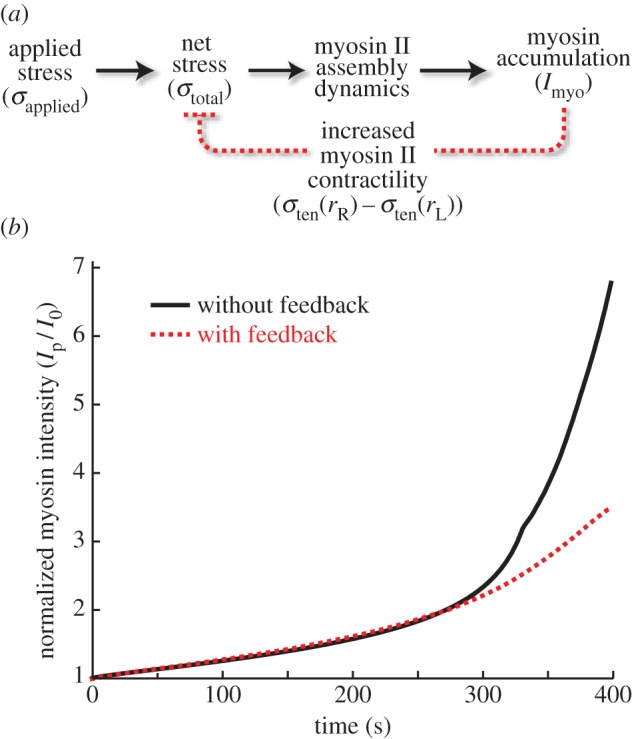
Simulations comparing effect of force feedback on myosin accumulation kinetics. (a) Diagram showing (b) comparison of BTF accumulation in response to externally applied stress σapplied, with (solid) and without (dotted) feedback from mechanosensitive accumulation of myosin and actin cross-linkers σtotal. (Online version in colour.)
We next incorporated the effect of accumulating myosin II on the externally applied stress given in equation (2.11). Specifically, because application of an external stress increases myosin II accumulation, we conjectured that this would lead to greater contractile stress, which can counteract the applied stress. The mechanosensitive accumulation of myosin II slowed down in simulations of this simple model, but the experimentally observed biphasic response was not recreated (figure 3b, with feedback). Increasing the strength of the negative feedback loop eventually led to simulations in which myosin II stopped accumulating, but the magnitude of the peak myosin II accumulation and the resulting change in Lp arising from cellular deformation differed greatly from those seen experimentally (data not shown). These simulations confirm that negative feedback from an increase in contractile stress induced by mechanosensory myosin II accumulation may explain some of the experimental observations. However, they also suggest that, in addition to the force feedback, other unidentified mechanisms must be incorporated into the mechanosensory model.
3.3. Strained myosin–actin unbinding along with force feedback can explain multiple phases of myosin accumulation and ensuing cellular retraction
To further explore the origin of the biphasic nature of myosin II accumulation, we considered the myosin II–actin interaction cycle before and after stressing the cytoskeletal network with an external force (figure 4a). Before an external force is applied, the network can be assumed to be at a steady state in which actin filaments and any bound BTFs are unstrained. Immediately after application of the external force, the filaments become strained. Owing to this external force, tension in the actin filaments increases, causing the motors of strained myosin BTFs to experience more load, locking onto the actin filaments in the isometric, cooperative binding state. As more myosin II motors accumulate locally and assemble into BTFs, these heads begin to share mechanical force, allowing the heads to unbind from and rebind to the actin filament. During this rebinding process, the stress extending across the BTF can relax.
Figure 4.
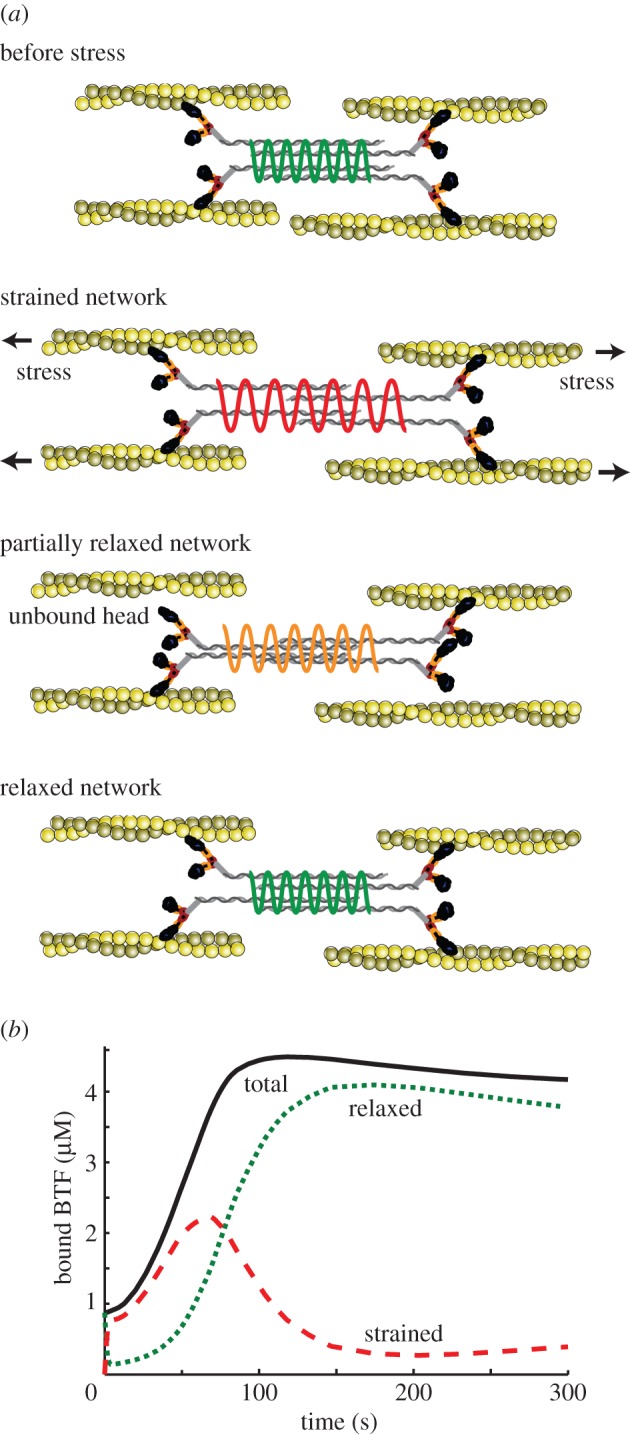
Strained myosin–actin unbinding theory can explain multiple phases of myosin accumulation. (a) The cartoon depicts myosin II interactions with actin before, during, and after perturbation of the cytoskeletal network with external force. In this model, myosin II initially strained by the external stress relaxes over time. (b) Simulation of the stress induced strain and relaxation of myosin II. (Online version in colour.)
We hypothesized that the strained myosin BTFs locked onto actin filaments, contribute to an increase in Es associated with myosin–actin binding, resulting in a cooperative mechanosensitive myosin accumulation. Moreover, we conjectured that the Es decreases as BTFs convert from a strained to an unstrained state. This effect, in addition to the contractile force feedback from the accumulation of myosin and other actin cross-linkers, is likely to contribute to the falling phase of mechanosensitive myosin accumulation observed in experiments.
To test this hypothesis, we incorporated a two-state BTF model that accounts for the conversion between strained and unstrained BTFs as shown
In this scheme, the rate of formation of strained BTFs can be written as
Because the number of BTFs is conserved, the above equation can be rewritten as
| 3.1 |
The two interconversion rates are functions of cellular strain arising from deforming a cell by externally applied stress. In particular, the on rate is
which mimics the straining of unstrained BTF heads. The form of the off rate,
was chosen to account for the hysteretic effects arising while the strained myosin heads unbind from an actin filament. Here  is a strain-independent off rate estimated from sensitivity analysis (electronic supplementary material, figure S3) by assuming that the strained BTFs convert to an unstrained state at a constant rate. The constants α0 and β0 are fitting parameters for calculating the strain rate and strain from the available deformation rate (
 ); these were shown through sensitivity analysis (α0 in the electronic supplementary material, figure S4 and β0 in the electronic supplementary material, figure S5).
The ΔEs described in equation (2.12) is now a function of fraction of strained myosin (ϕstrained) instead of total fraction (ϕ)
| 3.2 |
The fraction of strained myosins bound to F-actin (ϕstrained) is now given by
This modified change in Es was incorporated into the feedback model by substituting the above equation into the expression for ΔEb described in equation (2.11).
Simulations using this coupled model (figure 4b) showed that in the absence of external force, bound myosin BTFs are unstrained and their concentration is equal to the steady-state BTF concentration. Immediately after applying an external force, the concentration of strained BTFs increased, whereas that of unstrained BTFs decreased. Over time, however, the concentration of strained BTFs fell after reaching a peak, and the unstrained BTFs caught up. Simulations of this complete biomechanical feedback model, depicted in figure 5a, reproduced the biphasic natures of the myosin II accumulation (figure 5b) and cellular retraction (figure 5c) of cells.
Figure 5.
Simulations of the complete biomechanical feedback model. (a) Complete biomechanical feedback model. (b) Normalized myosin II intensity and (c) cellular protrusion after the application of a micropipette stress for various cellular strains. (Online version in colour.)
To validate our complete model and the resulting simulations, we compared key features of the experiments (figure 2) with our simulations (figure 5b,c and the electronic supplementary material, figure S6). First, our model captured the three phases of myosin accumulation, namely a rising phase, followed by a plateau and then a falling phase. Second, in the experiments, the peak myosin intensity was reached in 100–200 s. In the simulations, the peak intensity was reached in about the same time (figures 2 and 5b). With respect to the Lp, the model reproduces the entire change in cellular morphology, starting before aspiration. However, the simulated cell retracted 50–100 s faster than those observed experimentally (compare figure 2 with figure 5c).
These simulations assumed that the viscoelastic parameters (listed in table 1), measured over timescales 20–30 s long, do not change with deformation or with the ensuing myosin II accumulation. However, because the timescales of the experiments being recreated here are over a longer timescale (200–300 s), we might expect that the viscoelastic properties of cells might change over these longer timescales. Therefore, we tested a number of functional forms that assume that the viscoelastic parameters (particularly the elastic component) are altered as a function of cellular strain and myosin intensity as described in the electronic supplementary material. In all of the forms considered, the biphasic myosin accumulation and ensuing cellular retraction was reproduced (electronic supplementary material, figure S6).
4. Discussion
Regulated cell shape changes in the presence of internal and external disturbances, for example during cell division and cell motility, are a result of interlinked biochemical and mechanical feedback loops [32]. In this study, we have developed a biomechanical feedback model that explains the entire cellular response to a mechanical disturbance. Further, this biomechanical feedback model should be applicable to any monotonically retracting cell type, exhibiting biphasic mechanosensitive myosin accumulation.
Our theoretical model aims at recreating the response of cells subjected to an aspiration pressure from a micropipette. In response to this applied force, cells first accumulate myosin II at the site of aspiration, and then use the contractility of myosin II to retract [10]. One of the advantages of this experimental set-up is that it isolates the response of the actomyosin network from that of other mechanosensory components such as integrins, cadherins and focal adhesions. In fact, MPA does not lead to accumulation of talin [13]. Because the mechanosensory response is seen at the end of the aspirated cell, where there is no physical connection to a substrate or another cell, it is clear that this response is independent of these other mechanosensory elements. We have also previously shown that the coupling of the actin network to the membrane is an important requirement for the transmission of force, and hence, the mechanosensory response considered here. Of course, in these other modes, this role would be played by transmembrane proteins such as integrins and cadherins.
To gain a systems-level understanding of the biomechanical regulation of cell shape change in response to external mechanical perturbations, we identified the functional modules responsible for cellular mechanosensing and cellular deformation based on experiments on Dictyostelium cells. The major module responsible for cellular mechanosensing is the force-dependent accumulation of myosin II involving the assembly–disassembly of myosin II BTFs [10,12]. In our model, we coupled this to the viscoelastic properties of a cell to explain the biphasic mechanosensitive myosin accumulation and ensuing cellular deformation observed in WT and actin cross-linker-depleted mutant Dictyostelium cells.
The mechanisms for biphasic mechanosensitive myosin accumulation established here will be helpful in identifying the molecular mechanisms inherent in the interaction of myosin assembly inhibitors with myosin BTFs during mechanosensing. Clearly, increased contractile force from mechanosensitive myosin accumulation owing to load-dependent shifts in duty ratio is an important inhibitor of myosin accumulation. However, our simulations show that force feedback alone is not sufficient to reproduce the biphasic myosin accumulation kinetics.
The other well-established mechanism for myosin assembly regulation is myosin heavy chain phosphorylation by MHCKs. In Dictyostelium, three MHCKs (A, B, C) regulate myosin II assembly and maintain the available pool of free myosin II monomers by phosphorylating the myosin tail on three critical threonines [25,33]. MHCKC is the major kinase that co-localizes with cortical assembled myosin II heavy chain [25,34]. Further MHCKC accumulates along with myosin II during mechanosensitive localization [14]. This co-localization of MHCKC with myosin raises the following question: how does myosin reach its peak accumulation despite co-localizing with its inhibitor MHCKC? We suggest that when myosin BTFs are mechanically strained, MHCKC cannot access its phosphorylation sites to disassemble BTFs, hence contributing to the peak mechanosensitive accumulation. However, these strained BTFs cannot remain strained indefinitely and hence turn into a relaxed state, which may then be freely accessible to MHCKC for phosphorylation leading to a drop in mechanosensitive myosin accumulation. Together with the force feedback, the strained myosin–actin unbinding theory is one way to quantitatively account for the conversion between different BTF states (stressed and relaxed) and hence the biphasic myosin accumulation in response to external stress. We note a recent model that also considers the role of myosin in relaxation of actin stress fibres [35].
Additional evidence for this proposed cross-talk between the mechanosensitive motor and the thick filament regulation is found in our observations of engineered 3xAsp, 3xAla and 2xELC-3xAsp myosin motors [36]. In these motors, the critical threonines are mutated to either aspartic acids (3xAsp) or alanines (3xAla). The former mimics the heavy chain phosphorylation state of myosin leading to impaired BTF assembly. In contrast, 3xAla motors accumulate at higher levels than WT motors at the cleavage furrow of dividing cells [37,38]. Interestingly, neither motor responds to aspiration pressures [12], suggesting that the thick filament regulation is not sufficient to account for mechanosensitive accumulation. The incorporation of a second essential light chain binding site (2xELC) into otherwise normal myosin II motors results in highly mechanosensitive cells when compared with WT [12,13]. When these two mutations are combined by forming a 2xELC-3xAsp myosin motor, cells show intermediate BTF assembly, cleavage furrow accumulation and myosin II function when compared with 3xAsp and WT myosin II proteins, thus demonstrating cross-talk between the mechanosensitive motor and the BTF assembly process.
Finally, in our model, the coupling of the complete biomechanical feedback system to the viscoelastic state of a cell reproduces the cellular retraction resulting from the biphasic myosin accumulation, particularly in dividing cells and in interphase actin cross-linker-depleted mutant Dictyostelium cells [10,13]. This biomechanical feedback model allows us to account for a complete cell morphological response to applied stress from a single signal input, namely mechanical stress. In the model, the cell deforms, the molecular machinery mobilizes, redistributes, assembles and generates mechanical stress, and the cell morphology responds in a manner observed in real cells. This biomechanical feedback system establishes a framework for understanding cell shape regulation, which is driven by the regulated assembly of myosin BTFs.
Most significantly, this system likely explains the myosin II-dependent cellular responses to mechanical stress. For example, it is now established that accumulation of myosin at the cell rear is essential for motility in three-dimensional, but not two-dimensional microenvironments ([39] and references therein). Our model supports the hypothesis that this accumulation is driven by the force acting on the actin filaments at the rear of cells in three-dimensional environments, which is expected to be much greater than that of a cell migrating on a two-dimensional surface. Our model also explains how the resultant increase in the experienced force will drive myosin II accumulation and, subsequently, retraction of the rear of the cell.
Supplementary Material
Acknowledgements
The authors thank all the members of the Iglesias and Robinson Labs for useful comments on the manuscript.
Authors' contributions
K.M., T.L., D.N.R. and P.A.I. conceived the study. K.M., D.N.R. and P.A.I. designed the study. K.M. carried out the simulations and T.L. performed the experiments. K.M., D.N.R. and P.A.I. wrote the manuscript. All authors discussed the results, commented and approved the manuscript.
Competing interests
We declare we have no competing interests.
Funding
This study was supported by the NIH (GM66817 and GM86704).
References
- 1.Effler JC, Iglesias PA, Robinson DN. 2007. A mechanosensory system controls cell shape changes during mitosis. Cell Cycle 6, 30 ( 10.4161/cc.6.1.3674) [DOI] [PMC free article] [PubMed] [Google Scholar]
- 2.Sampathkumar A, Yan A, Krupinski P, Meyerowitz EM. 2014. Physical forces regulate plant development and morphogenesis. Curr. Biol. 24, R475–R483. ( 10.1016/j.cub.2014.03.014) [DOI] [PMC free article] [PubMed] [Google Scholar]
- 3.Majkut S, Dingal P, Discher DE. 2014. Stress sensitivity and mechanotransduction during heart development. Curr. Biol. 24, R495–R501. ( 10.1016/j.cub.2014.04.027) [DOI] [PMC free article] [PubMed] [Google Scholar]
- 4.Levayer R, Lecuit T. 2012. Biomechanical regulation of contractility: spatial control and dynamics. Trends Cell Biol. 22, 61–81. ( 10.1016/j.tcb.2011.10.001) [DOI] [PubMed] [Google Scholar]
- 5.Mohan K, Iglesias PA, Robinson DN. 2012. Separation anxiety: stress, tension and cytokinesis. Exp. Cell Res. 318, 1428–1434. ( 10.1016/j.yexcr.2012.03.028) [DOI] [PMC free article] [PubMed] [Google Scholar]
- 6.Robinson DN, Kee YS, Luo T, Surcel A. 2012. 7.5 Understanding how dividing cells change shape. In Comprehensive biophysics (ed. Egelman EH.), pp. 48–72. Amsterdam, The Netherlands: Elsevier. [Google Scholar]
- 7.Paluch E, Heisenberg CP. 2009. Biology and physics of cell shape changes in development. Curr. Biol. 19, R790–R799. ( 10.1016/j.cub.2009.07.029) [DOI] [PubMed] [Google Scholar]
- 8.Dai J, Sheetz MP, Wan X, Morris CE. 1998. Membrane tension in swelling and shrinking molluscan neurons. J. Neurosci. 18, 6681–6692. [DOI] [PMC free article] [PubMed] [Google Scholar]
- 9.Hamant O, Traas J, Boudaoud A. 2010. Regulation of shape and patterning in plant development. Curr. Opin. Genet. Dev. 20, 454–459. ( 10.1016/j.gde.2010.04.009) [DOI] [PubMed] [Google Scholar]
- 10.Effler JC, Kee YS, Berk JM, Tran MN, Iglesias PA, Robinson DN. 2006. Mitosis-specific mechanosensing and contractile-protein redistribution control cell shape. Curr. Biol. 16, 1962–1967. ( 10.1016/j.cub.2006.08.027) [DOI] [PMC free article] [PubMed] [Google Scholar]
- 11.Kee YS, Ren Y, Dorfman D, Iijima M, Firtel R, Iglesias PA, Robinson DN. 2012. A mechanosensory system governs myosin II accumulation in dividing cells. Mol. Biol. Cell 23, 1510–1523. ( 10.1091/mbc.E11-07-0601) [DOI] [PMC free article] [PubMed] [Google Scholar]
- 12.Ren Y, Effler JC, Norstrom M, Luo T, Firtel RA, Iglesias PA, Rock RS, Robinson DN. 2009. Mechanosensing through cooperative interactions between myosin II and the actin crosslinker cortexillin I. Curr. Biol. 19, 1421–1428. ( 10.1016/j.cub.2009.07.018) [DOI] [PMC free article] [PubMed] [Google Scholar]
- 13.Luo T, Mohan K, Iglesias PA, Robinson DN. 2013. Molecular mechanisms of cellular mechanosensing. Nat. Mater. 12, 1064–1071. ( 10.1038/nmat3772) [DOI] [PMC free article] [PubMed] [Google Scholar]
- 14.Luo T, Mohan K, Srivastava V, Ren Y, Iglesias PA, Robinson DN. 2012. Understanding the cooperative interaction between myosin II and actin cross-linkers mediated by actin filaments during mechanosensation. Biophys. J. 102, 238–247. ( 10.1016/j.bpj.2011.12.020) [DOI] [PMC free article] [PubMed] [Google Scholar]
- 15.Yang L, Effler JC, Kutscher BL, Sullivan SE, Robinson DN, Iglesias PA. 2008. Modeling cellular deformations using the level set formalism. BMC Syst. Biol. 2, 68 ( 10.1186/1752-0509-2-68) [DOI] [PMC free article] [PubMed] [Google Scholar]
- 16.Poirier CC, Ng WP, Robinson DN, Iglesias PA. 2012. Deconvolution of the cellular force-generating subsystems that govern cytokinesis furrow ingression. PLoS Comput. Biol. 8, e1002467 ( 10.1371/journal.pcbi.1002467) [DOI] [PMC free article] [PubMed] [Google Scholar]
- 17.Yeung A, Evans E. 1989. Cortical shell–liquid core model for passive flow of liquid-like spherical cells into micropipets. Biophys. J. 56, 139–149. ( 10.1016/S0006-3495(89)82659-1) [DOI] [PMC free article] [PubMed] [Google Scholar]
- 18.Murphy CT, Rock RS, Spudich JA. 2001. A myosin II mutation uncouples ATPase activity from motility and shortens step size. Nat. Cell Biol. 3, 311–315. ( 10.1038/35060110) [DOI] [PubMed] [Google Scholar]
- 19.Warrick HM, Spudich JA. 1987. Myosin structure and function in cell motility. Annu. Rev. Cell Biol. 3, 379–421. ( 10.1146/annurev.cb.03.110187.002115) [DOI] [PubMed] [Google Scholar]
- 20.Mahajan RK, Vaughan KT, Johns JA, Pardee JD. 1989. Actin filaments mediate Dictyostelium myosin assembly in vitro. Proc. Natl Acad. Sci. USA 86, 6161–6165. ( 10.1073/pnas.86.16.6161) [DOI] [PMC free article] [PubMed] [Google Scholar]
- 21.Uehara R, Goshima G, Mabuchi I, Vale RD, Spudich JA, Griffis ER. 2010. Determinants of myosin II cortical localization during cytokinesis. Curr. Biol. 20, 1080–1085. ( 10.1016/j.cub.2010.04.058) [DOI] [PMC free article] [PubMed] [Google Scholar]
- 22.Berlot C, Devreotes P, Spudich J. 1987. Chemoattractant-elicited increases in Dictyostelium myosin phosphorylation are due to changes in myosin localization and increases in kinase activity. J. Biol. Chem. 262, 3918–3926. [PubMed] [Google Scholar]
- 23.Mahajan RK, Pardee JD. 1996. Assembly mechanism of Dictyostelium myosin II: regulation by K+, Mg2+, and actin filaments. Biochemistry 35, 15 504–15 514. ( 10.1021/bi9618981) [DOI] [PubMed] [Google Scholar]
- 24.Moores SL, Spudich JA. 1998. Conditional loss-of-myosin-II-function mutants reveal a position in the tail that is critical for filament nucleation. Mol. Cell. 1, 1043–1050. ( 10.1016/S1097-2765(00)80104-5) [DOI] [PubMed] [Google Scholar]
- 25.Yumura S, et al. 2005. Multiple myosin II heavy chain kinases: roles in filament assembly control and proper cytokinesis in Dictyostelium. Mol. Biol. Cell 16, 4256–4266. ( 10.1091/mbc.E05-03-0219) [DOI] [PMC free article] [PubMed] [Google Scholar]
- 26.Reichl EM, et al. 2008. Interactions between myosin and actin crosslinkers control cytokinesis contractility dynamics and mechanics. Curr. Biol. 18, 471–480. ( 10.1016/j.cub.2008.02.056) [DOI] [PMC free article] [PubMed] [Google Scholar]
- 27.Zhou Q, et al. 2010. 14–3–3 coordinates microtubules, Rac, and myosin II to control cell mechanics and cytokinesis. Curr. Biol. 20, 1881–1889. ( 10.1016/j.cub.2010.09.048) [DOI] [PMC free article] [PubMed] [Google Scholar]
- 28.Takács B, O'Neall-Hennessey E, Hetényi C, Kardos J, Szent-Györgyi AG, Kovács M. 2011. Myosin cleft closure determines the energetics of the actomyosin interaction. FASEB J. 25, 111–121. ( 10.1096/fj.10-164871) [DOI] [PMC free article] [PubMed] [Google Scholar]
- 29.Haugwitz M, Noegel AA, Karakesisoglou J, Schleicher M. 1994. Dictyostelium amoebae that lack G-actin-sequestering profilins show defects in F-actin content, cytokinesis, and development. Cell 79, 303–314. ( 10.1016/0092-8674(94)90199-6) [DOI] [PubMed] [Google Scholar]
- 30.Veigel C, Molloy JE, Schmitz S, Kendrick-Jones J. 2003. Load-dependent kinetics of force production by smooth muscle myosin measured with optical tweezers. Nat. Cell Biol. 5, 980–986. ( 10.1038/ncb1060) [DOI] [PubMed] [Google Scholar]
- 31.Bell GI. 1978. Models for the specific adhesion of cells to cells. Science 200, 618–627. ( 10.1126/science.347575) [DOI] [PubMed] [Google Scholar]
- 32.Surcel A, Kee YS, Luo T, Robinson DN. 2010. Cytokinesis through biochemical–mechanical feedback loops. Semin. Cell Dev. Biol. 21, 866–873. ( 10.1016/j.semcdb.2010.08.003) [DOI] [PMC free article] [PubMed] [Google Scholar]
- 33.Egelhoff TT, Lee RJ, Spudich JA. 1993. Dictyostelium myosin heavy chain phosphorylation sites regulate myosin filament assembly and localization in vivo. Cell 75, 363–371. ( 10.1016/0092-8674(93)80077-R) [DOI] [PubMed] [Google Scholar]
- 34.Nagasaki A, Itoh G, Yumura S, Uyeda TQ. 2002. Novel myosin heavy chain kinase involved in disassembly of myosin II filaments and efficient cleavage in mitotic Dictyostelium cells. Mol. Biol. Cell 13, 4333–4342. ( 10.1091/mbc.E02-04-0228) [DOI] [PMC free article] [PubMed] [Google Scholar]
- 35.Wu T, Feng JJ. 2015. A biomechanical model for fluidization of cells under dynamic strain. Biophys. J. 108, 43–52. ( 10.1016/j.bpj.2014.11.015) [DOI] [PMC free article] [PubMed] [Google Scholar]
- 36.Ren Y, West-Foyle H, Surcel A, Miller C, Robinson DN. 2014. Genetic suppression of a phosphomimic myosin II identifies system-level factors that promote myosin II cleavage furrow accumulation. Mol. Biol. Cell 25, 4150–4165. ( 10.1091/mbc.E14-08-1322). [DOI] [PMC free article] [PubMed] [Google Scholar]
- 37.Sabry JH, Moores SL, Ryan S, Zang JH, Spudich JA. 1997. Myosin heavy chain phosphorylation sites regulate myosin localization during cytokinesis in live cells. Mol. Biol. Cell 8, 2605–2615. ( 10.1091/mbc.8.12.2605) [DOI] [PMC free article] [PubMed] [Google Scholar]
- 38.Robinson DN, Cavet G, Warrick HM, Spudich JA. 2002. Quantitation of the distribution and flux of myosin-II during cytokinesis. BMC Cell Biol. 3, 4 ( 10.1186/1471-2121-3-4) [DOI] [PMC free article] [PubMed] [Google Scholar]
- 39.Chi Q, Yin T, Gregersen H, Deng X, Fan Y, Zhao J, Liao D, Wang G. 2014. Rear actomyosin contractility-driven directional cell migration in three-dimensional matrices: a mechano-chemical coupling mechanism. J. R. Soc. Interface 11, 20131072 ( 10.1098/rsif.2013.1072) [DOI] [PMC free article] [PubMed] [Google Scholar]
Associated Data
This section collects any data citations, data availability statements, or supplementary materials included in this article.