

Abstract
Theobroma cacao, the key ingredient in chocolate production, is one of the world's most important tree fruit crops, with ∼4,000,000 metric tons produced across 50 countries. To move towards gene discovery and marker-assisted breeding in cacao, a single-nucleotide polymorphism (SNP) identification project was undertaken using RNAseq data from 16 diverse cacao cultivars. RNA sequences were aligned to the assembled transcriptome of the cultivar Matina 1-6, and 330,000 SNPs within coding regions were identified. From these SNPs, a subset of 6,000 high-quality SNPs were selected for inclusion on an Illumina Infinium SNP array: the Cacao6kSNP array. Using Cacao6KSNP array data from over 1,000 cacao samples, we demonstrate that our custom array produces a saturated genetic map and can be used to distinguish among even closely related genotypes. Our study enhances and expands the genetic resources available to the cacao research community, and provides the genome-scale set of tools that are critical for advancing breeding with molecular markers in an agricultural species with high genetic diversity.
Keywords: cacao, SNP, mapping, breeding, markers
1. Introduction
The beans of Theobroma cacao, prized worldwide for their cocoa solids and cocoa butter that serve as the defining ingredient of chocolate, are now commercially produced in over 50 countries,1 including tropical regions of Central and South America, Asia and Africa. Although the species was initially domesticated from wild ancestors in Central America and Mexico,2–4 modern efforts to improve cacao were initiated in the early 1900s,5 with the classification of cacao germplasm into three major morphological/geographic groups: Criollo, Forastero and Trinitario. Only since the advent of molecular marker technology, however, has modern molecular breeding become possible for cacao. Using the precision afforded by such molecular markers, Motamayor et al.6 more accurately classified cacao germplasm into 10 major genetic clusters: Marañon, Curaray, Criollo, Iquitos, Nanay, Contamana, Amelonado, Purús, Nacional and Guiana. The tremendous genetic diversity extant within the cacao species represents a key resource for the improvement of flavour, yield and disease resistance. Moreover, breeders can exploit the heterosis that occurs in crosses between trees of different genetic groups to improve production.7
Crop improvement programs rely on the accurate characterization of genetic resources (germplasm) for breeding and propagation. Historically, germplasm collections were curated based on morphology and the agronomic characteristics of individual clones.8,9 More recently, however, efforts have been underway to assess, describe and characterize cacao collections based on population structure, genetic diversity and evolutionary relationships using molecular markers.6,10–12 In addition to assisting in the curation of existing cacao germplasm collections, a key goal of an integrated cacao genetics program is to use molecular markers to select for improved varieties and maintain these in breeding programs.11,13–19
Although simple sequence repeats (SSRs) have served as genetic markers in most cacao studies to date,6,11,20,21 SSR data can exhibit platform-to-platform variation, which complicates the sharing of genotype data among different research groups.22 The recent sequencing of two cacao genomes (Criollo B97-61/B223 and Matina 1-624) has substantially increased the number of resources available to cacao researchers for the identification of novel molecular markers. The most abundant marker type is the single-nucleotide polymorphism (SNP). The use of SNPs has revolutionized genetic research in many species, including cacao.25–28 SNPs are detected by aligning and comparing sequence data from genetically diverse individuals.29–31 In cacao, ∼1,300 SNPs have been discovered and used for comparative genomic studies, production of consensus genetic maps, marker-assisted breeding and for curation of germplasm collections.22,32–36
The ease of use and abundance of SNPs make them particularly well suited for generating saturated linkage maps. SNP-based linkage maps have been built for a variety of tree crops, including cacao.22,24,35,37 In the present study, we describe the discovery of hundreds of thousands of SNPs using next-generation sequencing, laying the foundation for future genetic mapping studies. We present results from the design and use of a 6k Illumina Infinium SNP array and demonstrate that the array is useful for the generation of a saturated genetic linkage map and the differentiation of two closely related cacao accessions.
2. Methods
2.1. Plant material
The 16 cacao accessions making up the diversity panel used here for SNP discovery (Fig. 1) represent the 10 distinct genetic clusters of cacao identified by Motamayor et al.6 All plant tissues were collected at the USDA-ARS SHRS germplasm collection in Miami except EBC-148, which was from the Centro Agronomico Tropical de Investigacion y Ensenanza (CATIE), Turrialba, Costa Rica. Mature pistil tissue from unpollinated flowers of UF273 Type I was also collected at CATIE. Tissue samples from CATIE were placed into RNAlater (Life Technologies, NY, USA) for stable shipment prior to RNA extraction. RNA samples were used for transcript sequencing and SNP calling.
Figure 1.

SNP discovery and filtering for the selection of 6,000 SNPs for inclusion on the Cacao6kSNP array. Variants identified by alignment to an early Matina reference transcriptome. Standard filtering was applied to provide confidence in the existence of the variants. SNP Filter was applied to retain only biallelic SNP variants, referred to as the Original SNP Report. As a measure of added confidence, only those SNPs for which at least two accessions displayed the variant allele and two accessions displayed the reference allele were kept (Selected Filtered SNPs). Additional loci filtering was applied to reduce the number of selected SNPs down to the targeted final filtered SNPs, which were included on the Cacao6kSNP array.
A total of 1,152 cacao DNA samples were collected and submitted to Illumina for genotyping. These samples consisted of trees from the USDA cacao collection in Miami, including 9 of the 16 accessions from the diversity panel described above. Also included were five separate F1 mapping populations: Pound 7 × UF273 Type I (181 trees, CATIE Type 1), Pound 7 × UF273 Type II (68 trees, CATIE Type 2), KA2-101 × K82 and reciprocal (340 trees, PNG) and TSH1188 × CCN51 (498 trees, MCCS). The remaining 56 samples represent duplicated controls (36 samples) and select germplasm lines (20 samples). Leaves from the CATIE Type 1 and Type 2 populations were collected in CATIE, samples from PNG 1 and PNG 8 came from the Cacao and Coconut Institute in Papua New Guinea and the MCCS population came from the Mars Center for Cacao Science in Brazil.
2.2. RNA extraction for SNP discovery
Following a modified form of the method described by Chang et al.,38 RNA was extracted from leaf tissue for all cacao accessions in the diversity panel, with the exception of UF273 Type I, for which pistil tissue was used. A total of 1 g of leaf tissue (excluding the mid-rib) was collected from each tree and placed immediately in liquid nitrogen, then ground to a fine powder and homogenized in 15 ml of 65°C extraction buffer39 using a PRO200 Homogenizer with a 10 × 115 mm generator (PRO Scientific, Inc., CT, USA). Pistil tissue was first dissected from mature, unopened flowers in RNAlater with a scalpel and dissecting microscope. Approximately 20 dissected pistils were ground in liquid nitrogen, homogenized and then treated identically as leaf samples. All samples were extracted twice with equal volumes chloroform (1 min homogenization with the PRO200 Homogenizer and 30 min centrifugation at 10,500 × g). One-third volume of 8 M LiCl was then added, the sample mixed and the RNA precipitated overnight or over the weekend at 0°C (in an ice water bath in a 4°C refrigerator). The RNA pellet was obtained via centrifugation at 10,500 × g for 1 h at 4°C. The pellet was then processed with the Qiagen RNeasy Mini Kit (Qiagen, CA, USA) following the manufacturer's instructions. The clean RNA was treated with DNase by adding 100 µl water, 20 µl DNase buffer and 4 µl DNase I (Roche, IN, USA) and incubating for 30 min. RNA was extracted with 180 µl phenol : chloroform : isoamyl alcohol (25 : 24 : 1) with centrifugation at 14,000 × g for 10 min at 4°C. Next, 20 µl 3M NaOAc and 600 µl 100% ethanol were added to the supernatant and left to precipitate overnight at −80°C. The pellet was obtained via centrifugation at 14,000 × g for 30 min at 4°C and then rinsed with 500 µl 80% EtOH. The dried pellet was resuspended in 50 µl RNase-free water.
2.3. DNA extraction for genotyping
Purification of genomic DNA from T. cacao is difficult and not standardized for use in automated DNA extraction pipelines because of the high concentrations of carbohydrates, polyphenolic compounds and other secondary metabolites that oxidize nucleic acids. Here, ∼300 mg of tissue was ground to a powder in liquid nitrogen and immediately put in 1 ml of an inert wash buffer containing final concentrations of 100 mM Hepes, 0.1% PVP 40 (w/v) and 4% 2-mercapto-ethanol in 1.2 ml centrifuge tubes. The tubes were vortexed on a medium setting for 5 min and centrifuged at 8,400 × g for 5 min, decanted and washed 4–6 more times until the supernatant was no longer viscous. After the final wash, the pellet was suspended in nuclei extraction buffer (15% sucrose, 50 mM Tris–HCl, 50 mM EDTA pH 8.0 and 500 mM NaCl) by vortexing. The solution was incubated at 50°C for 15 min, mixing gently every 2 min and then centrifuged at 8,400 × g for 5 min. The supernatant was decanted, and the pelleted plant material resuspended in 450 µl of 20 mM Tris–HCl with 10 mM EDTA. Next, 80 µl of 10% SDS was added, and the samples were incubated for 15 min at 70°C. Samples were allowed to cool to room temperature and then mixed with 300 µl of 7.5 M NH4OAc (stored at −20°C) and incubated on ice for 30 min. The solution was centrifuged at top speed for 15 min at 4°C. The aqueous layer was transferred to a clean 1.2-ml tube, combined with an equal amount of isopropanol, and centrifuged at top speed for 15 min at 4°C. The DNA pellet was washed two times with ice-cold 70% ETOH and resuspended in 100 µl of 10 mM Tris–HCl.
2.4. Creation of the transcriptome reference sequence
Total leaf RNA of Matina 1-6 (800 ng) was used for a library preparation optimized for Roche/454 GS FLX Titanium sequencing described previously (NCBI SRX17296524,40). High-quality sequence reads (1,510,557) were trimmed and assembled using Newbler v2.0 into 29,787 contigs of average length 725 (SD = 558).24
2.5. SNP discovery in the diversity panel
The Matina 1-6 leaf transcriptome assembly was used as a reference sequence for SNP discovery among the members of a diversity panel that contains 16 accessions. mRNA isolated from each accession was used in double-stranded Illumina libraries after two rounds of oligo dT selection from total RNA. Three hundred base-pair library fragments were agarose gel purified, amplified by PCR and quality assessed using a Bioanalyzer 2100 (Agilent, Inc., Santa Clara, CA, USA). Libraries were sequenced on the Illumina GAII to 54 nt length using protocols of the manufacturer (Illumina, San Diego, CA, USA). Sequence reads are deposited in the short read archive (SRA) of NCBI under BioProject PRJNA51633 (Accession no. SRX278177 and SRX278006).
Sequence variants were identified by aligning the Illumina reads to the Matina 1-6 leaf transcriptome using the Alpheus analysis pipeline detailed by Miller et al.41 In brief, paired-end reads were aligned to the reference using the GSNAP aligner configured to allow up to 5% mismatch across the paired read considered as a whole. The data were filtered to reduce false positives. Only variants within reads that aligned uniquely to the reference were considered. Unique mapping ranged among accessions of the diversity panel from ∼20 to 45% of total reads (Supplementary Figure S1). Sequence read data quality and depth standards (Fig. 1, standard filter) required the variant to be present in at least two reads covering the base position, present in at least 20% of the total number of reads covering the variant, and to possess a sequence quality score of Q20 or higher. A variant report was generated from the Alpheus output, with SNPs named with respect to individual Matina 1-6 transcriptome contigs.
2.6. Selection of sequences for genotyping array
Additional filtering was applied to the variants in a stepwise manner to optimize selection and further reduce markers to the number appropriate for the array. Only bi-allelic SNPs were retained after sequence quality and depth filtering: all insertion/deletions (indels) and multi-allelic polymorphisms were excluded. The Original SNP Report contained ∼340 K sequences after these exclusions (Fig. 1). The next major filtering step considered data of the diversity panel as a whole. Here, SNPs were retained only if the reference (Matina 1-6) allele appeared in two accessions and the alternative allele also appeared in two accessions. This filtering step provided selection confidence against potential artifacts of single RNA samples and resulted in the list of 48,408 termed Selected Filtered SNPs (Fig. 1). Each potential marker was evaluated on the basis of its internal sequence with each sequence subjected to review of their expected performance in the Illumina Infinium technology. First, all markers in the Selected Filtered SNP set were submitted to Illumina and assigned an Assay Design Tool score. This score predicts the success of an SNP assay on the array by taking into account the GC content and sequence adjacent to the SNP site and assigning a value from zero to one. Only SNPs with an Illumina Infinium Assay Design Tool score >0.9 were included in the Final Filtered SNPs.
Furthermore, minor allele frequency (MAF) was calculated for each locus. Markers with a MAF >0.2 were selected for the Final Filtered set. Sequences surrounding the SNPs were screened for the presence of intron–exon junctions using BLASTn on a preliminary Matina 1-6 genome assembly24 and any containing a putative junction site was removed. Because the array was to be used on multiple mapping populations, SNPs heterozygous in at least one, but not all, diversity panel accessions were selected for inclusion on the array. As the Infinium array uses a primer extension bead-based array for genotyping, the number of markers that can be included depends on the bead type of each marker, which in turn is dependent on the nucleotides being assayed. Markers that distinguish A/T or C/G alleles require two beads. To increase the number of loci represented, only single bead-type SNPs (A/C, A/G, T/C, T/G) were chosen for inclusion on the Cacao6kSNP array. Finally, when possible, two SNPs per transcript were selected in an effort to ensure locus representation should one marker fail.
2.7. SNP evaluation and linkage mapping
Data generated from all 1,152 samples were analysed with GenomeStudio (Illumina), and genotypes were called using a GenCall threshold of 0.15. Additionally, to serve as a quality control for genotype calling, only markers with GenTrain and GenCall 10% scores above 0.4 and 0.2, respectively, were included for data analysis. The data were exported and separated into populations, with germplasm and diversity panel accessions (grouped per genetic affinity) comprising their own ‘populations'. For genetic mapping, the markers present in each dataset were reduced so that only SNPs showing segregation in one or both of the parental lines remained.
Pair-wise Identity by descent (IBD) values were estimated with PLINK v1.0742 with 5,149 SNPs for two mapping populations: CATIE Type 1 (Pound 7 × UF273 Type I) and CATIE Type 2 (Pound 7 × UF273 Type II), with 180 and 69 progenies, respectively. The total number of pair-wise calculations including the three parents (Pound 7, UF273 Type I and UF273 Type II) is 31,626. A pedigree file was used to allow PLINK to relate the two populations correctly. Assignments of ‘parent-offspring’, ‘full-sibling’, ‘half-sibs’ (i.e. CATIE Type 1 versus CATIE Type 2 progenies) and ‘other-related’ (i.e. mother/father) were assigned. The IBD distribution was plotted with R.43
A conservative estimation of the number of SNP loci needed to differentiate related cacao accessions (i.e. determine off-types) was performed. The genotyping error rate was calculated from five replicated DNA samples of Pound 7, UF273 Type I and UF273 Type II included on the Cacao6kSNP array. The genotyping error rate was small for all three parents, with UF273 Type II samples exhibiting the highest number of non-concordant genotypes with 14 out of 5,149 (0.00272). To be conservative, we rounded the calculated genotyping error rate of 0.00272 to 0.01 mistypes per locus, and the probability of differentiating any two cacao accessions was determined from the binomial distribution. As direct siblings are likely to share many alleles, the probability of detecting an off-type between any two pair of individuals was defined as the probability of observing more genotype differences between them than expected with a genotyping error rate of 0.01. We calculated this probability for different numbers of SNPs sampled and for three different levels of relatedness (i.e. expected number of genotype differences). The proportion of differing loci between the closely related accessions UF273 Type I and UF273 Type II (0.162) was used as a reference point likely to be encountered in practical situations. Additionally, proportion values, or levels of relatedness, of 0.1 and 0.3 were also included to indicate the number of SNP loci that might be needed to differentiate more or less related accessions.
A genetic linkage map was constructed using the CATIE Type 2 mapping population. This population resulted from the cross of Pound 7 × UF273 Type II and consists of 68 individual trees. The initial mapping dataset included 2,857 SNPs that demonstrated segregation in the population. To generate the linkage map, the JoinMap 4.1 software (Kyazma, the Netherlands) was used by first converting the raw genotype data into the JoinMap format using the parental genotypes to define the segregation type and then assigning the appropriate allele code based upon the genotype data.44 Markers with a significant amount of segregation distortion (15 SNPs) and with >10% missing data (11 SNPs) were removed from the linkage mapping analysis. Marker grouping was selected with a recombination frequency of 0.1 or higher, resulting in the formation of 10 linkage groups (one for each chromosome of cacao). Mapping itself was performed using maximum likelihood analysis. The fit and stress values, a measure of linkage strength, of the markers on each linkage group were examined, and any markers with a value >7 were removed. The linkage mapping was re-iterated until all markers had values <7. The small size of the CATIE Type 2 population contributed to a large number of markers with high fit and stress values. In total, 242 SNPs were removed due to fit and stress values above the stated threshold, resulting in a final linkage map consisting of 68 individuals with 2,589 SNPs.
3. Results and discussion
3.1. Filtering and SNP statistics
Among the transcriptome reference sequences built for Matina 1-6 genome annotation efforts,24 a Matina 1-6 leaf transcriptome assembly was used for the SNP discovery described here. This transcriptome represented ∼22 Mb of sequence in 29,787 isotigs.40 Paired-end Illumina GAII reads for 16 highly diverse cacao accessions were obtained and mapped as described (SRA BioProject PRJNA51633). Supplementary Fig. S1 summarizes the read coverage against the transcriptome assembly for each accession used for SNP calling. Unique mapped reads (red) were used to call SNPs. The repetitive (green) reads had at least one end of the read-pair map to multiple places within the transcriptome, whereas the unmapped (blue) reads failed to map under the described thresholds (Supplementary Fig. S1). For each accession, the average number of reads per final filtered SNP selected for the Cacao6kSNP array ranged from 13 to 67 reads per SNP (Supplementary Fig. S1).
The original SNP report identified 339,330 SNPs, which were reduced to 48,408 selected filtered SNPs, and finally to 6,000 SNPs selected for inclusion on the Cacao6kSNP array (Fig. 1). Figure 2 plots the location along the cacao genome of the selected filtered (middle ring) and the final filtered (inner ring) SNPs. Originally designed to be broadly applicable to various germplasm collections and mapping populations, our filtering methods favoured high-quality SNPs with large minor allele frequencies across the set, rather than SNPs specific to any one genotype. Although rare SNPs may identify a specific genetic background or unusual phenotype in germplasm collections, they are likely to be homozygous and hence unmappable in mapping populations. When possible, redundancy of marker usefulness among genotypes was preferred. The inclusion of two SNPs per contig that met all the filtering criteria was a measure of precaution against failed genotyping at any one locus. This precaution was unnecessary as 5,149 of the 5,388 successfully synthesized beads (96%) yielded reliable genotype data.
Figure 2.

Location of SNP sets along the Matina 1-6 genome. The 10 chromosomes of the Matina 1-6 genome assembly are represented along the outer ring (LG01–LG10). The middle ring highlights the locations of 48,408 select filtered SNPs, while the inner ring highlights the locations of the 6,000 final filtered SNPs. This figure is available in black and white in print and in colour at DNA Research online
In the final filtered set, 4,632 contigs were represented on the Cacao6kSNP array by 6,000 loci. This represents an average of 1.3 SNPs/contig. Because an early transcriptome assembly was used to identify SNPs, many of these contigs were later collapsed into one another during the gene model prediction and annotation stage of genome assembly.24 The final number of gene models represented by the selected SNPs was determined and shows a slight reduction to 4,305 gene models (1.4 SNPs/gene model on average). The gene models represented on the Cacao6kSNP array display a cross-section of cellular components, molecular functions and biological processes as determined via GOslim annotation (Fig. 3). This diversity in the types of genes represented suggests that the SNPs selected for inclusion on the Cacao6kSNP array are likely to have broad impacts on plant physiology, making them desirable for general marker-trait association analysis. Large proportions of genes involved in protein (13%) and nucleotide (10%) binding are represented, along with those with transferase (9%) and hydrolase (8%) activities. The largest biological processes represented include metabolic, cellular and protein metabolism. Of immediate interest to cacao breeding efforts are the SNPs present in gene models involved in stress and abiotic or biotic response (4%) and those linked to developmental processes (2%).
Figure 3.

GOslim annotation of SNP-containing gene models. Gene models from the Matina 1-6 assembly were screened to identify the final selected SNP set. Goslim annotation was used to classify the SNP-containing gene models. The top chart represents cellular components, the middle describes molecular function and the bottom refers to biological process. The X-axis shows the total number of SNP-containing gene models. The percentage after the bar represents the percent of SNP-containing gene models within each annotated group.
3.2. SNP array evaluation
Of the 6,000 SNPs submitted for inclusion on the bead array, 5,388 were successfully synthesized. Failing to produce genotype data for any sample, 171 SNPs were removed before analysis. Removing markers with low GenTrain (<0.4) and GenCall 10% (<0.2) scores resulted in a final set of 5,149 SNPs. The Cacao6kSNP array was originally run with 1,152 DNA samples (including duplicated controls), but seven DNA samples failed completely. In total, 5,149 SNPs were genotyped in 1,145 DNA samples for a total of 5,895,605 data points. Only 6,171 of these data points provided no definitive genotype representing 0.1% missing data within the total analysed dataset. The submitted Cacao6kSNP represented 6,912,000 potential data, of which 85% provided useful genotype data.
3.3. Comparison of allele calls from chip array and sequencing
A cursory survey was performed to compare the initial sequencing-based SNP calls from RNAseq with the genotype data generated from the Cacao6kSNP array. Nine accessions present in both datasets were examined for differences in allele calls (Table 1). Concordance between genotypes can be found along the diagonal for each accession and ranged from 86 to 99% across the nine accessions compared (Table 1). Overall, 39,399 data points were compared and found to be 93% concordant (36,724 data points). The majority of non-concordance events observed for any particular accession appear to represent differences in the sensitivity of heterozygous allele detection, that is, when one dataset called a marker heterozygous and the other set called the same marker homozygous. Homozygous changes, or those for which the sequencing reads called one homozygous allele and the array called homozygous for the other allele, were much less common. In total, 1,916 SNPs generated differing genotype calls between the Cacao6kSNP array and RNAseq data. This number was striking and represents variation for 37% of the total SNPs genotyped. A closer examination of the differences was performed. The number of non-concordant markers was calculated and sorted based on the number of accessions showing discrepancies for that particular SNP (Table 2). This analysis revealed that the bulk (1,433) of the identified non-concordant SNPs differed within a single accession and that 97% (1,383) of the differences observed were heterozygous changes. Visual inspection of these SNPs in GenomeStudio displayed three well-defined clusters for the majority of the markers. Additionally, for discrepant SNPs in the parents of the CATIE mapping population, Pound 7 and UF273, Mendelian segregation was used to infer the correct genotype of the parent. For all instances when either parent was the only accession displaying discrepancies between the Cacao6kSNP array and RNAseq, segregation of the CATIE mapping populations supported the genotype value obtained by the Cacao6kSNP array. In contrast, non-congruent SNPs with three or more accessions showing differences display a larger proportion of opposing homozygotes (24–100%), and the number of discrepant markers dropped to only 136 SNPs for this whole subset (Table 2). When SNPs with three or more non-concordant accessions were examined in GenomeStudio, over half showed poor or single cluster formation, indicating issues with the Cacao6kSNP data for these SNPs. Those displaying three well-defined clusters had less than six sequencing reads for the discrepant accessions. Although experiments specifically designed to assess the accuracy of the chip array versus short read sequencing calls are still required, from our data, it appears as though the majority of non-concordant markers are the result of improper allele calls from the use of sequencing reads, based on the strong cluster formation, segregation data and small number of discrepant accessions affected by these SNPs. These issues are possibly the result of low read coverage or strand (allele) bias at the mismatched SNP causing heterozygotes to be misidentified as homozygotes. However, the less common SNPs with the opposing homozygous alleles are more likely issues with the chip array, as evidenced by the increase in poor cluster formation for these SNPs.
Table 1.
Comparison of Cacao6kSNP array and sequencing calls across common accessions
| Clone | Concordant SNPs | Non-concordant SNPs | Per cent concordance | RNAseq genotypes |
||||
|---|---|---|---|---|---|---|---|---|
| Homozygous reference | Heterozygous | Homozygous variant | ||||||
| Cacao6kSNP Array genotypes | Homozygous reference | 4,685 | 23 | 3 | ||||
| Matina 1-6 | 4,687 | 47 | 99 | Heterozygous | 2 | 0 | 0 | |
| Homozygous variant | 9 | 10 | 2 | |||||
| Homozygous reference | 1,477 | 24 | 14 | |||||
| Criollo 13 | 4,104 | 117 | 97 | Heterozygous | 1 | 3 | 1 | |
| Homozygous variant | 18 | 59 | 2,626 | |||||
| Homozygous reference | 3,237 | 51 | 6 | |||||
| Pound 5 | 4,519 | 169 | 96 | Heterozygous | 21 | 104 | 14 | |
| Homozygous variant | 23 | 54 | 1,178 | |||||
| Homozygous reference | 2,712 | 91 | 12 | |||||
| GU255 | 4,558 | 211 | 96 | Heterozygous | 17 | 147 | 13 | |
| Homozygous variant | 8 | 70 | 1,699 | |||||
| Homozygous reference | 1,220 | 14 | 12 | |||||
| NAP 30 | 3,685 | 185 | 95 | Heterozygous | 42 | 182 | 55 | |
| Homozygous variant | 16 | 46 | 2,283 | |||||
| Homozygous reference | 971 | 50 | 14 | |||||
| SCA-6 | 3,493 | 414 | 89 | Heterozygous | 83 | 524 | 144 | |
| Homozygous variant | 11 | 112 | 1,998 | |||||
| Homozygous reference | 2,103 | 49 | 9 | |||||
| Pound 7 | 3,529 | 513 | 87 | Heterozygous | 245 | 820 | 164 | |
| Homozygous variant | 12 | 34 | 606 | |||||
| Homozygous reference | 2,304 | 64 | 5 | |||||
| EBC 148 | 4,273 | 369 | 92 | Heterozygous | 118 | 870 | 67 | |
| Homozygous variant | 18 | 97 | 1,099 | |||||
| Homozygous reference | 1,144 | 47 | 14 | |||||
| UF273 type I | 3,876 | 650 | 86 | Heterozygous | 280 | 1,351 | 185 | |
| Homozygous variant | 13 | 112 | 1,381 | |||||
Table 2.
Summary of non-concordant SNPs between Cacao6kSNP array and sequencing arranged by number of discrepant accessions
| Number of non-concordant accessions identified | Number of unique non-concordant SNPs | Number of unique SNPs with opposing homozygous genotypes | Per cent of opposing homozygous genotypes |
|---|---|---|---|
| 1 | 1,433 | 50 | 3 |
| 2 | 347 | 27 | 8 |
| 3 | 71 | 17 | 24 |
| 4 | 28 | 17 | 61 |
| 5 | 16 | 11 | 69 |
| 6 | 8 | 7 | 88 |
| 7 | 9 | 9 | 100 |
| 8 | 4 | 3 | 75 |
| 9 | 0 | — | — |
| Total | 1,916 | 141 | 7 |
3.4. Complete SNP dataset comparison among selected genotypes
To assess the utility of the Cacao6kSNP array data in distinguishing among accessions, representative accessions of the two sequenced genomes (Matina 1-6 and Criollo 13) known to belong to divergent genetic groups6 were compared. Both accessions showed extreme homozygosity across 5,117 SNPs, with only two and six heterozygotes identified in Matina 1-6 and Criollo 13, respectively, resulting in 99.8% homozygosity. This finding is consistent with previous analyses using microsatellite markers23,24 and was helpful in the generation of the respective genome assemblies. Despite their high levels of homozygosity, these accessions share only a meager 38% of their alleles (1,936 out of 5,117). A list of the markers with differing alleles between Matina 1-6 and Criollo 13 can be found in Supplementary Table S1. This allelic divergence is perhaps due to geographic isolation and differing evolutionary paths. In terms of cacao breeding, an examination of the differences between these accessions may identify alleles specific for particular traits of interest. Criollo is often preferred by the fine flavour chocolate producers but tends to suffer from poor yields,45,46 whereas Matina, an Amelonado type, one of the most grown genetic groups, is higher yielding and makes up a large proportion of bulk chocolate. A better understanding of the genetic differences between these two clones may provide insight into the mechanism and control of the traits that make each desirable to cacao growers and producers.
Two other genotypes, this time closely related: UF273 Type I and UF273 Type II, were also examined. These two accessions, respectively, serve as the fathers for the CATIE Type 1 and CATIE Type 2 populations generated at CATIE, Turrialba, Costa Rica.47 Originally intended to be a single F1 population from the cross of Pound 7 × UF273, five cloned trees of UF273 were used as parents. After the F1 population was planted, it was discovered that one tree out of the five UF273 trees used as a pollen donor was genetically distinct from the other four clones (UF273 Type I) and was henceforth referred to as UF273 Type II. An SSR analysis of 180 markers revealed variation in UF273 Type II alleles for 22 markers (12%), with most often one allele differing at the locus.47 A comparison of UF273 Type I and UF273 Type II was performed using 5,123 successful genotypes from the Cacao6kSNP array. UF273 Type I shows 60% homozygousity (3,101 out of 5,123 markers) and UF273 Type II only slightly more at 64% (3,276 out of 5,123). Further distinguishing themselves from the Matina 1-6 and Criollo 13 accessions, UF273 Type I and UF273 Type II share 84% identity (4,294 markers) and 99% of their alleles, having only eight opposing homozygous SNPs out of the 5,123 markers compared. The high proportion of shared alleles between these two accessions suggests a close genetic relationship. IBD values of all pair-wise comparisons for both the CATIE Type 1 and Type 2 mapping populations were determined and are summarized in Fig. 4. A pair-wise IBD value of 0.92 was determined for UF273 Type I versus UF273 Type II, indicating that it is a first-degree (full-sib) relationship (Fig. 4). There are only two cases where the IBD is as high, or higher, than those of the UF273 accessions. Two full-sibs from the CATIE Type 1 population also share an IBD of 0.92, and another comparison shows an IBD of 1 (genetically identical), which can be attributed to a field error. The UF273 Type I and Type II accessions are so similar that they have often been lumped together as few genetic differences between the two were previously observed.47 However, this pooling often creates problems for cacao breeders as progeny generated from crosses with these accessions has been shown to segregate differently for multiple traits (Dr Wilbert Phillips, personal communication). The availability of SNPs to easily distinguish these accessions from one another would serve to reassure breeding efforts utilizing one or both. A total of 827 markers differentiating UF273 Type I and Type II accessions were reported and can be found in Supplementary Table S2.
Figure 4.
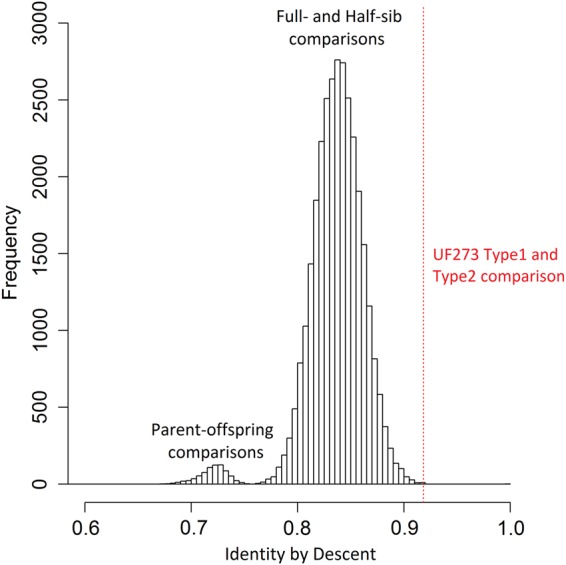
IBD distribution for all CATIE Type 1 and Type 2 pair-wise comparisons (including parents). The left mode of the bimodal curve reflects the IBD distribution for parent–offspring relationships (as well as two parent-to-parent IBDs: Pound 7 versus UF273 Type I and Pound 7 versus UF273 Type II). The right mode reflects the full-sibling and half-sibling pair-wise IBDs. The dashed line represents the UF273 Type I versus UF273 Type II pair-wise IBD value (0.92), indicating a first-degree relationship. This figure is available in black and white in print and in colour at DNA Research online
The first-order relationship between UF273 Type I and Type II provides an opportunity to examine the number of SNP markers needed to successfully differentiate between two closely related accessions, a task that is often essential in cacao breeding programs. Using a number of randomly selected loci genotyped in the Cacao6kSNP array as a pool of markers, we determined the probability of successfully differentiating accessions with 10%, 16.2% (as observed with UF273 Type I and Type II) and 30% genetic variation (Fig. 5). A confidence threshold of 95%, taking into account the genotyping error rate, was used to identify different accessions. Serving as a measure of relatedness, the proportion of loci that were different between the first-order related UF273 accessions (0.162) was used as a reference point as differentiation between two full-sibs is likely to be a practical situation encountered in breeding programs. Proportion values of 0.1 and 0.3 were also included to show how the results might change with more or less genetically related accessions as described in the Materials and Methods. For the example of UF273 Type I and Type II, 24 loci are required to confidently distinguish one accession from another, whereas for accessions displaying only 10% variation, 30 loci would be required (Fig. 5). These values are consistent with those identified in bovine systems and in other cacao studies,28,36 which reported that ∼40 SNP loci are required to differentiate genetically distinct individuals. The number of loci required to distinguish related accessions can be genotyped easily using modern SNP genotyping systems (Fluidigm, Sequenome, Golden Gate, etc.) and will be of value for marker-assisted selection breeding programs.
Figure 5.

Probability of differentiating accessions of various levels of identity using increasing numbers of SNP markers. The probability of successfully differentiating accessions with 10% (Δ), 16.2% (□; as observed with UF273 Type I and Type II) and 30% (∇) genetic variation using a number of randomly selected loci as calculated using the binomial distribution. A confidence threshold of 95%, with a 0.01 genotyping error rate, was selected to identify different accessions. Thirty SNPs are sufficient to distinguish accessions with only 10% variation.
3.5. Linkage mapping
In preparation for genetic linkage mapping with the Cacao6kSNP data, SNPs displaying segregation within the different mapping populations were separated from the uninformative loci. Segregating SNPs, or those where one or both parents are heterozygous, can be used to generate linkage maps in these F1 populations. The number of segregating SNPs within and between mapping populations is shown as a Venn diagram (Fig. 6). The total number of segregating SNPs ranges from 2,543 to 3,563, which is ∼10 times as many markers as in the composite SSR map created by Brown et al.48 and 2 to 3 times the number of markers in the composite map generated by Allegre et al.35 A number of SNPs specific to each of the mapping populations were identified (Fig. 6). Furthermore, 260 loci segregate in CATIE Type 2 but do not segregate in CATIE Type 1. Additionally, CATIE Type 1 has 346 segregating markers that do not segregate in the Type 2 population (Fig. 6). These population-specific SNPs may prove instrumental in determining associations with traits specific to one population. Conversely, the 956 SNPs held in common across all populations can be used as anchor markers in a composite linkage map. Placement of the markers of this set will provide higher overall precision than use of markers from any one individual map.35,47 Supplementary Table S3 lists all SNPs present on the Cacao6kSNP array, any population they segregate within, their positions on the Matina 1-6 genome, nearby SNPs presented by Allegre et al.35 as well as transcript sequences flanking each SNP.
Figure 6.
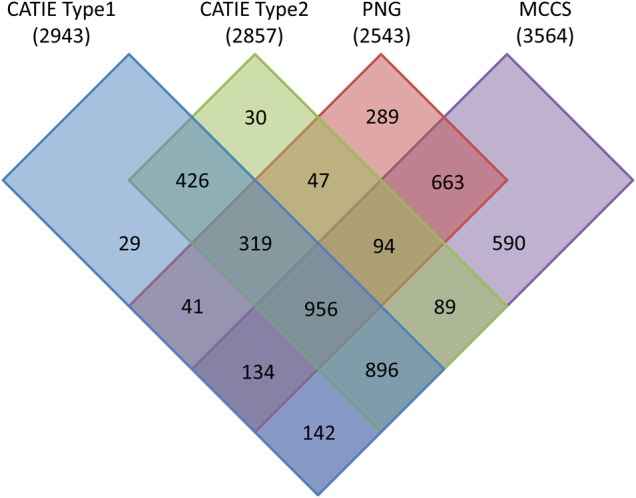
Venn diagram detailing the number of SNP markers that can be mapped, i.e. those with at least one heterozygous parent, in a particular population. The population name is listed above with the total number of markers that can be mapped in parenthesis. Markers that segregate within each population are represented by a coloured rectangle: CATIE Type 1 markers in blue, CATIE Type 2 markers in green, PNG in red and MCCS in purple. Overlapping rectangles indicate markers shared between those populations. Numbers within rectangles represent the number of markers that can be mapped within those population(s).
A genetic linkage map of the CATIE Type 2 population (Pound 7 × UF273 Type II) was generated with 68 individuals and 2,589 SNP markers (Fig. 7), producing a map of 1,268 cM total length. Ten linkage groups corresponding to the 10 chromosomes of cacao were identified, and linkage group designation was assigned by comparing mapped markers to the chromosomes of the Matina 1-6 genome assembly using the convention defined by Lanaud.24,49 Linkage mapping generally relies on large numbers of individuals within the population to identify recombination events, which are used to order markers along the map. Although quite small for linkage map generation, this population is typical of many cacao mapping populations, which are often studied in regions where resources are limited. Combined with the large land requirements of tree breeding and the need to maintain trees for many years, cacao mapping populations seldom have more than a hundred individuals, although a few exceptions exist at larger cacao research stations. The substantial increase in the number of markers should help to identify recombination events that may not be noticed with fewer markers. The genetic map generated for the CATIE Type 2 population serves as a proof of concept that larger numbers of markers can help, but not completely overcome, a limited number of individuals. A summary of the linkage map is presented in Table 3, as is the composite linkage map generated by Allegre et al. for comparison.35
Figure 7.

Linkage map of the Pound 7 × UF273 Type II mapping population. Linkage map representing the 10 identified chromosomes of cacao. The map was generated with JoinMap 4.1 and contains 68 individuals with 2,589 markers. Markers are depicted as black lines with their position (cM) reported to the left. Linkage group designation is indicated across the top, markers are identified as horizontal lines and cM position is indicated along the left.
Table 3.
Summary of CATIE type 2 linkage map generated with SNPs (top) and the composite Allegre35 linkage map generated with SNPs (bottom)
| No. of SNPs | Length (cM) | Gap length (cM) | Length (bp) | SNPs/cM | bp/cM | |
|---|---|---|---|---|---|---|
| LG01 | 265 | 134.2 | 5.6 | 35,128,701 | 2.0 | 261,764 ± 40,679 |
| LG02 | 454 | 178.2 | 7.1 | 35,095,207 | 2.5 | 196,976 ± 58,270 |
| LG03 | 128 | 107.3 | 13.4 | 29,936,525 | 1.2 | 279,100 ± 58,820 |
| LG04 | 280 | 146.5 | 6.2 | 28,498,427 | 1.9 | 194,555 ± 48,217 |
| LG05 | 206 | 117.1 | 14.0 | 33,047,117 | 1.8 | 282,230 ± 89,324 |
| LG06 | 261 | 99.5 | 3.3 | 21,387,731 | 2.6 | 214,924 ± 83,893 |
| LG07 | 153 | 93.8 | 7.2 | 19,274,282 | 1.6 | 205,424 ± 76,948 |
| LG08 | 309 | 120.7 | 3.9 | 16,539,538 | 2.6 | 137,005 ± 58,617 |
| LG09 | 354 | 178.5 | 7.9 | 35,247,141 | 2.0 | 197,447 ± 53,776 |
| LG10 | 179 | 92.4 | 6.3 | 20,306,549 | 1.9 | 219,756 ± 78,700 |
| Total | 2,589 | 1,268 | 7.5 | 274,461,215 | 2.0 | 216,420 ± 62,443 |
| LG01 | 179 | 94.1 | 2.8 | 35,128,701 | 1.9 | 373,312 ± 58,014 |
| LG02 | 155 | 101.1 | 7.6 | 35,095,207 | 1.5 | 347,134 ± 102,691 |
| LG03 | 163 | 76.9 | 2.3 | 29,936,525 | 2.1 | 389,292 ± 82,043 |
| LG04 | 135 | 64.2 | 2.6 | 28,498,427 | 2.1 | 443,901 ± 110,012 |
| LG05 | 147 | 78.1 | 4.4 | 33,047,117 | 1.9 | 423,138 ± 133,921 |
| LG06 | 81 | 64.0 | 4.1 | 21,387,731 | 1.3 | 334,183 ± 130,445 |
| LG07 | 62 | 52.6 | 4.0 | 19,274,282 | 1.2 | 366,431 ± 137,259 |
| LG08 | 73 | 59.2 | 6.0 | 16,539,538 | 1.2 | 279,384 ± 119,532 |
| LG09 | 182 | 100.9 | 4.0 | 35,247,141 | 1.8 | 349,327 ± 95,141 |
| LG10 | 63 | 59.5 | 5.4 | 20,306,549 | 1.1 | 341,287 ± 122,223 |
| Total | 1,240 | 751 | 4.3 | 274,461,215 | 1.7 | 365,656 ± 105,501 |
Compared with a composite map generated with 1,240 SNPs (Table 3), the total length of all linkage groups was longer. The CATIE Type 2 map has a largest gap length between markers of 14 cM on LG05 and an average longest gap length of 7.5 cM across all linkage groups. In comparison, the Allegre composite SNP map has a 7.6 cM gap (LG02) and an average longest gap length of 4.3 cM.35 Despite the increased number of SNPs on the CATIE Type 2 map, the gap size did not decrease. The redundancy in SNP selection for the Cacao6kSNP array is the most likely reason for this observation. Although more SNPs were present, they co-located (i.e. had the same cM position) along the map. In the CATIE Type 2 linkage map (Fig. 7), ∼1,600 SNPs were co-located. If these SNPs were selected from additional transcripts, fewer co-locating markers, and thus smaller gaps, would be expected. Additionally, the identification of SNPs from the transcriptome limited marker positions to the gene space. As a result, gene-rich regions may contain an abundance of markers. In the future, to better distribute SNPs across each linkage group, it will be beneficial to represent more transcripts or non-transcribed SNPs, perhaps evenly positioned across the chromosome, rather than to prioritize marker redundancy.
The generation of a composite map increases the effective number of individuals within the mapping population, improving the chance of observing recombination events. The smaller size of the CATIE Type 2 population reduces the number of observed recombinations, causing markers to co-locate and generating gaps between clumps of markers. The uncertainty introduced by ordering co-located markers can also result in somewhat larger linkage groups. An estimate of base- pairs per cM was calculated for each map, first using the length of each sequenced genome separately and then averaging the resulting values together; the error presented represents the standard deviation (Table 3). An average size was used, because Matina has one of the larger cacao genome sizes, whereas Criollo has one of the smaller genome sizes.24 The CATIE Type 2 map, at 2 SNPs/cM, generated an average size of 216,420 bp/cM, whereas the Allegre composite map, with 1.7 SNPs/cM, predicted 365,656 bp/cM.
Under ideal conditions, SNPs with fit and stress values (a statistical measure of whether a locus fits well between its neighbours; lower values represent a better fit) over 2 are removed from the map. To generate this map, 242 SNPs with a fit and stress value over 7 were removed; this relatively high number of markers is due to the limited number of individuals in the population, which reduces the strength of the linkages. When data from the Cacao6kSNP array is used to map a much larger population, the increased number of individuals in that population contributes to significantly improve fit and stress values for the mapped SNPs, further emphasizing that for linkage mapping, additional markers cannot completely overcome a lack of individuals. Despite this issue, the markers on the CATIE Type 2 linkage map show strong co-linearity to both the Matina 1-6 v1.1 and Criollo v1 genome assemblies (Fig. 8). Marker positions of the linkage map were compared with the genomic positions of both assembled cacao genomes. Marker sequences for the 2,589 SNPs included on the CATIE Type 2 linkage map were blasted to each assembled genome to determine marker position, and all of the linkage groups that contain a mapped marker are displayed with identical markers connected by grey lines (Fig. 8). Eleven linkage groups are presented for the Criollo v1 assembly as some markers were found on Tc00, a scaffold used to hold sequences that could not be placed on the original Criollo v1 assembly.45 As such, the increased number of markers on this new linkage map may have helped to anchor additional regions of the Criollo v1 assembly (Tc00) onto the 10 chromosomes.
Figure 8.

Comparison of SNP marker positions. Marker positions are depicted as grey lines and show marker position either by linkage mapping (CATIE Type 2) or blasting 121-mers containing the SNP to the genomic assemblies of Criollo23 or Matina.24 Tc00 contains unanchored sequences in the Criollo assembly. No markers present on the CATIE Type 2 map were located on unanchored sequences in the Matina assembly. This demonstrates the advantages of a more saturated genetic map in genome assembly.
4. Conclusions
We have identified nearly 400,000 SNP markers across a cross-section of the cacao transcriptome diversity and from these constructed a Cacao6kSNP array. With this ‘chocolate chip’, 5,149 markers provided genotype data for 1,152 samples, including five mapping populations. A linkage map with 2,589 SNPs was generated for the smallest of these mapping populations. The data generated from this chip have allowed the comparison of important cacao genotypes. Additionally, we determined a minimum number of SNP markers required to distinguish closely related accessions, with the aim of helping further cacao breeding efforts. Future QTL and association studies using these larger SNP datasets promise to identify markers that can be utilized in marker-assisted selection breeding programs throughout the world to help ensure a ready supply of chocolate.
Supplementary data
Supplementary data are available at www.dnaresearch.oxfordjournals.org.
Funding
This project was part of the Matina 1-6 cacao sequencing project, and was funded by MARS, Inc. Funding to pay the Open Access publication charges for this article was provided by MARS, Inc.
Supplementary Material
Acknowledgements
The authors thank Dr Wilbert Phillips from the Centro Agronomico Tropical de Investigacion y Ensenanza (CATIE), Turrialba, Costa Rica for kindly supplying many of the tissue samples utilized in this study. We thank Dr Sean Myles for his invaluable advice and assistance editing this manuscript, as well as Mark Hansen from Illumina for his expert advice and guidance when preparing and analysing the Illumina Infinium array that would become the Cacao6kSNP chip.
References
- 1.Food and Agriculture Organization of the United Nations. 2015. FAOSTAT. Crops (National Production). http://data.fao.org/ref/29920434-c74e-4ea2-beed-01b832e60609.html?version=1.0 (6 March 2014, date last accessed).
- 2.Cuatrecasas J. 1964, Cacao and its allies: a taxonomic revision og the genus Theobroma, Contrib. US Herbarium, 35, 542–3. [Google Scholar]
- 3.Hunter J.R. 1990, The status of cacao (Theobroma-Cacao, Sterculiaceae) in the western-hemisphere, Econ. Bot., 44, 425–39. [Google Scholar]
- 4.Motamayor J.C., Risterucci A.M., Lopez P.A., Ortiz C.F., Moreno A., Lanaud C. 2002, Cacao domestication I: the origin of the cacao cultivated by the Mayas, Heredity, 89, 380–6. [DOI] [PubMed] [Google Scholar]
- 5.Fredholm A. 1911, Breeding of cacao, The West India Committee Circular, 102–3. [Google Scholar]
- 6.Motamayor J.C., Lachenaud P., da Silva e Mota J.W., et al. 2008, Geographic and genetic population differentiation of the Amazonian chocolate tree (Theobroma cacao L), PLoS ONE, 3, e3311. [DOI] [PMC free article] [PubMed] [Google Scholar]
- 7.Warren J. 1992, Cocoa breeding in the 21st century. In: International Workshop on Conservation, Characterisation and Utilisation of Cocoa Genetic Resources in the 21st Century. Port of Spain, Trinidad and Tobago. [Google Scholar]
- 8.Engels J. 1983, A systematic description of cacao clones. III. Relationships between clones, between characteristics and some consequences for the cacao breeding, Euphytica, 32, 719–33. [Google Scholar]
- 9.Iwaro A.D., Butler D.P. 2000, Germplasm enhancement for resistance to black pod and witches' broom diseases. In: Proceedings of the 13th International Cocoa Research Conference: Towards the Effective and Optimum Promotion of Cocoa through Research and Development. Cocoa Producers Alliance, Lagos, Nigeria. [Google Scholar]
- 10.Boza E.J., Irish B.M., Meerow A.W., et al. 2013, Genetic diversity, conservation, and utilization of Theobroma cacao L.: genetic resources in the Dominican Republic, Genet. Resour. Crop Evol., 60, 605–19. [Google Scholar]
- 11.Irish B.M., Goenaga R., Zhang D., Schnell R., Brown J.S., Motamayor J.C. 2010, Microsatellite fingerprinting of the USDA-ARS Tropical Agriculture Research Station Cacao (Theobroma cacao L.) germplasm collection, Crop Sci., 50, 656–67. [Google Scholar]
- 12.Schnell R.J., Olano C.T., Brown J.S., et al. 2005, Retrospective determination of the parental population of superior cacao (Theobroma cacao L.) seedlings and association of microsatellite alleles with productivity, J. Am. Soc. Hortic. Sci., 130, 181–90. [Google Scholar]
- 13.Risterucci A.M., Grivet L., N'Goran J.A.K., Pieretti I., Flament M.H., Lanaud C. 2000, A high-density linkage map of Theobroma cacao L, Theor. Appl. Genet., 101, 948–55. [Google Scholar]
- 14.Kuhn D.N., Heath M., Wisser R.J., et al. 2003, Resistance gene homologues in Theobroma cacao as useful genetic markers, Theor. Appl. Genet., 107, 191–202. [DOI] [PubMed] [Google Scholar]
- 15.Borrone J., Kuhn D., Schnell R. 2004, Isolation, characterization, and development of WRKY genes as useful genetic markers in Theobroma cacao, Theor. Appl. Genet., 109, 495–507. [DOI] [PubMed] [Google Scholar]
- 16.Schnell R.J., Kuhn D.N., Brown J.S., et al. 2007, Development of a marker assisted selection program for cacao, Phytopathology, 97, 1664–9. [DOI] [PubMed] [Google Scholar]
- 17.Lima L., Gramacho K., Carels N., et al. 2009, Single nucleotide polymorphisms from Theobroma cacao expressed sequence tags associated with witches’ broom disease in cacao, Genet. Mol. Res., 8, 799–808. [DOI] [PubMed] [Google Scholar]
- 18.Kuhn D.N., Motamayor J.C., Meerow A.W., Borrone J.W., Schnell R.J. 2008, SSCP markers provide a useful alternative to microsatellites in genotyping and estimating genetic diversity in populations and germplasm collections of plant specialty crops, Electrophoresis, 29, 1–14. [DOI] [PubMed] [Google Scholar]
- 19.Motilal L.A., Zhang D.P., Umaharan P., Mischke S., Mooleedhar V., Meinhardt L.W. 2010, The relic Criollo cacao in Belize - genetic diversity and relationship with Trinitario and other cacao clones held in the International Cocoa Genebank, Trinidad, Plant Genet. Resour. C., 8, 106–15. [Google Scholar]
- 20.Borrone J.W., Brown J.S., Kuhn D.N., Motamayor J.C., Schnell R.J. 2007, Microsatellite markers developed from Theobroma cacao L. expressed sequence tags, Mol. Ecol. Notes, 7, 236–9. [Google Scholar]
- 21.Lanaud C., Risterucci A.M., Pieretti I., Falque M., Bouet A., Lagoda P.J. 1999, Isolation and characterization of microsatellites in Theobroma cacao L, Mol. Ecol., 8, 2141–3. [DOI] [PubMed] [Google Scholar]
- 22.Livingstone D.S., Motamayor J.C., Schnell R.J., et al. 2011, Development of single nucleotide polymorphism markers in Theobroma cacao and comparison to simple sequence repeat markers for genotyping of Cameroon clones, Mol. Breed., 27, 93–106. [Google Scholar]
- 23.Argout X., Salse J., Aury J.M., et al. 2011, The genome of Theobroma cacao, Nat. Genet., 43, 101–8. [DOI] [PubMed] [Google Scholar]
- 24.Motamayor J.C., Mockaitis K., Schmutz J., et al. 2013, The genome sequence of the most widely cultivated cacao type and its use to identify candidate genes regulating pod color, Genome Biol., 14, R53. [DOI] [PMC free article] [PubMed] [Google Scholar]
- 25.Page B.T., Casas E., Heaton M.P., et al. 2002, Evaluation of single-nucleotide polymorphisms in CAPN1 for association with meat tenderness in cattle, J. Anim. Sci., 80, 3077–85. [DOI] [PubMed] [Google Scholar]
- 26.Ha B.K., Hussey R.S., Boerma H.R. 2007, Development of SNP assays for marker-assisted selection of two southern root-knot nematode resistance QTL in soybean, Crop Sci., 47, S73–82. [Google Scholar]
- 27.Altshuler D., Pollara V.J., Cowles C.R., et al. 2000, An SNP map of the human genome generated by reduced representation shotgun sequencing, Nature, 407, 513–6. [DOI] [PubMed] [Google Scholar]
- 28.The Bovine HapMap Consortium 2009, Genome-wide survey of SNP variation uncovers the genetic structure of cattle breeds, Science, 324, 528–32. [DOI] [PMC free article] [PubMed] [Google Scholar]
- 29.Chagné D., Crowhurst R.N., Troggio M., et al. 2012, Genome-wide SNP detection, validation, and development of an 8K SNP array for apple, PLoS ONE, 7, e31745. [DOI] [PMC free article] [PubMed] [Google Scholar]
- 30.Kumar S., Banks T.W., Cloutier S. 2012, SNP discovery through next-generation sequencing and its applications, Int. J. Plant Genomics, 15 pages. [DOI] [PMC free article] [PubMed] [Google Scholar]
- 31.Van Tassell C.P., Smith T.P.L., Matukumalli L.K., et al. 2008, SNP discovery and allele frequency estimation by deep sequencing of reduced representation libraries, Nat. Meth., 5, 247–52. [DOI] [PubMed] [Google Scholar]
- 32.Takrama J., Dadzie A.M., Opoku S.Y., et al. 2012, Applying SNP marker technology in the cacao breeding programme in Ghana, Afr. Crop Sci. J., 20, 67–75. [Google Scholar]
- 33.Kuhn D.N., Figueira A., Lopes U., et al. 2010, Evaluating Theobroma grandiflorum for comparative genomic studies with Theobroma cacao, Tree Genet. Genomes, 6, 783–92. [Google Scholar]
- 34.Livingstone D.S., Freeman B., Motamayor J.C., et al. 2012, Optimization of a SNP assay for genotyping Theobroma cacao under field conditions, Mol. Breed., 30, 33–52. [Google Scholar]
- 35.Allegre M., Argout X., Boccara M., et al. 2012, Discovery and mapping of a new expressed sequence tag-single nucleotide polymorphism and simple sequence repeat panel for large-scale genetic studies and breeding of Theobroma cacao L, DNA Res., 19, 23–35. [DOI] [PMC free article] [PubMed] [Google Scholar]
- 36.Fang W., Meinhardt L.W., Mischke S., Bellato C.M., Motilal L., Zhang D. 2013, Accurate determination of genetic identity for a single cacao bean, using molecular markers with a nanofluidic system, ensures cocoa authentication, J. Agric. Food Chem., 62, 481–7. [DOI] [PubMed] [Google Scholar]
- 37.Antanaviciute L., Fernández-Fernández F., Jansen J., et al. 2012, Development of a dense SNP-based linkage map of an apple rootstock progeny using the Malus Infinium whole genome genotyping array, BMC Genomics, 13, 203. [DOI] [PMC free article] [PubMed] [Google Scholar]
- 38.Chang S., Puryear J., Cairney J. 1993, A simple and efficient method for isolating RNA from pine trees, Plant Mol. Biol. Rep., 11, 113–6. [Google Scholar]
- 39.Bailey B.A., Strem M.D., Bae H.H., de Mayolo G.A., Guiltinan M.J. 2005, Gene expression in leaves of Theobroma cacao in response to mechanical wounding, ethylene, and/or methyl jasmonate, Plant Sci., 168, 1247–58. [Google Scholar]
- 40.Kuhn D.N., Livingstone D., III, Main D., et al. 2012, Identification and mapping of conserved ortholog set (COS) II sequences of cacao and their conversion to SNP markers for marker-assisted selection in Theobroma cacao and comparative genomics studies, Tree Genet. Genomes, 8, 97–111. [Google Scholar]
- 41.Miller N.A., Kingsmore S.F., Farmer A., et al. 2008, Management of high-throughput DNA sequencing projects: alpheus, J. Comput. Sci. Syst. Biol., 1, 132. [DOI] [PMC free article] [PubMed] [Google Scholar]
- 42.Purcell S., Neale B., Todd-Brown K., et al. 2007, PLINK: a tool set for whole-genome association and population-based linkage analyses, Am. J. Hum. Genet., 81, 559–75. [DOI] [PMC free article] [PubMed] [Google Scholar]
- 43.RC Team 2014, R: a language and environment for statistical computing. Vienna, Austria: R Foundation for Statistical Computing; 2012. http://cran.r-project.org. (20 May 2015, date last accessed). [Google Scholar]
- 44.Stam P. 1993, Construction of integrated genetic linkage maps by means of a new computer package: Join Map, Plant J., 3, 739–44. [Google Scholar]
- 45.Argout X., Fouet O., Wincker P., et al. 2008, Towards the understanding of the cocoa transcriptome: production and analysis of an exhaustive dataset of ESTs of Theobroma cacao L. generated from various tissues and under various conditions, BMC Genomics, 9, 512. [DOI] [PMC free article] [PubMed] [Google Scholar]
- 46.Motamayor J.C., Risterucci A.M., Heath M., Lanaud C. 2003, Cacao domestication II: progenitor germplasm of the Trinitario cacao cultivar, Heredity, 91, 322–30. [DOI] [PubMed] [Google Scholar]
- 47.Brown J.S., Phillips-Mora W., Power E.J., et al. 2007, Mapping QTLs for resistance to frosty pod and black pod diseases and horticultural traits in Theobroma cacao L, Crop Sci., 47, 1851–8. [Google Scholar]
- 48.Brown J., Sautter R., Olano C., et al. 2008, A composite linkage map from three crosses between commercial clones of cacao, Theobroma cacao L, Trop. Plant Biol., 1, 120–30. [Google Scholar]
- 49.Lanaud C., Risterucci A., N'goran A., et al. 1995, A genetic linkage map of Theobroma cacao L, Theor. Appl. Genet., 91, 987–93. [DOI] [PubMed] [Google Scholar]
Associated Data
This section collects any data citations, data availability statements, or supplementary materials included in this article.