

Abstract
Myeloproliferative neoplasms (MPNs) are clinically characterized by the chronic overproduction of differentiated peripheral blood cells and the gradual expansion of malignant intramedullary/extramedullary hematopoiesis. In MPNs mutations in JAK2 MPL or CALR are detected mutually exclusive in more than 90% of cases [1], [2]. Mutations in them lead to the abnormal activation of JAK/STAT signaling and the autonomous growth of differentiated cells therefore they are considered as “driver” gene mutations. In addition to the above driver gene mutations mutations in epigenetic regulators such as TET2 DNMT3A ASXL1 EZH2 or IDH1/2 are detected in about 5%–30% of cases respectively [3]. Mutations in TET2 DNMT3A EZH2 or IDH1/2 commonly confer the increased self-renewal capacity on normal hematopoietic stem cells (HSCs) but they do not lead to the autonomous growth of differentiated cells and only exhibit subtle clinical phenotypes [[4], [6], [7], [8],5]. It was unclear how mutations in such epigenetic regulators influenced abnormal HSCs with driver gene mutations how they influenced the disease phenotype or whether a single driver gene mutation was sufficient for the initiation of human MPNs. Therefore we focused on JAK2V617F and loss of TET2—the former as a representative of driver gene mutations and the latter as a representative of mutations in epigenetic regulators—and examined the influence of single or double mutations on HSCs (Lineage−Sca-1+c-Kit+ cells (LSKs)) by functional analyses and microarray whole-genome expression analyses [9]. Gene expression profiling showed that the HSC fingerprint genes [10] was statistically equally enriched in TET2-knockdown-LSKs but negatively enriched in JAK2V617F–LSKs compared to that in wild-type-LSKs. Double-mutant-LSKs showed the same tendency as JAK2V617F–LSKs in terms of their HSC fingerprint genes but the expression of individual genes differed between the two groups. Among 245 HSC fingerprint genes 100 were more highly expressed in double-mutant-LSKs than in JAK2V617F–LSKs. These altered gene expressions might partly explain the mechanisms of initiation and progression of MPNs which was observed in the functional analyses [9]. Here we describe gene expression profiles deposited at the Gene Expression Omnibus (GEO) under the accession number GSE62302 including experimental methods and quality control analyses.
Keywords: Microarray profiling, Loss of TET2, JAK2V617F, Hematopoietic stem cell, Myeloproliferative neoplasm
| Specifications | |
| Organism/cell line/tissue | Mus musculus, C57BL/6, bone marrow Lineage−Sca-1+c-Kit+ cells (LSKs) |
| Sex | Not applicable: each fetus was genotyped for JAK2 and TET2, but was not determined by gender; for each genotype, fetal liver cells (FLs) were collected from multiple fetuses and mixed altogether, and were transplanted into lethally irradiated recipients; therefore the gender of recipients' LSKs derived from transplanted FLs was not to be determined. |
| Sequencer or array type | Agilent-028005 SurePrint G3 Mouse GE 8x60K Microarray |
| Data format | Raw and analyzed |
| Experimental factors | Genotype: Wild type vs. TET2 knock-down (TET2KD), JAK2V617F, or TET2KD and JAK2V617F (double-mutant); JAK2V617F vs. double-mutant. |
| Experimental features | Microarray gene expression profiling to identify genes that are regulated by loss of TET2 and/or JAK2V617F. |
| Consent | Animal studies were performed in accordance with the local University of Miyazaki Ethics Committee. |
| Sample source location | Not applicable |
Direct link to deposited data
http://www.ncbi.nlm.nih.gov/geo/query/acc.cgi?link_type=NCBIGEO&access_num=GSE62302&acc=GSE62302
Experimental design, materials and methods
Mouse usage
JAK2V617F transgenic mice [11] and TET2 heterozygous knockdown (TET2trap/+) mice [5] generated by gene trapping were previously reported. They were backcrossed at least 8 times onto C57BL/6 mice (B6-CD45.2). The TET2trap/trap mice frequently died during the neonatal period on the B6-CD45.2 background; therefore, we transplanted their fetal liver (FL) cells (FLs) to generate mouse models of myeloproliferative neoplasms (MPNs). For the transplantation, we crossed male JAK2V617F–TET2trap/+ mice with female TET2trap/+ mice, and obtained the following 4 experimental groups of E14.5 fetuses: JAK2WT–TET2WT (wild-type (WT)), JAK2WT–TET2trap/trap (TET2-knockdown (TET2KD)), JAK2V617F–TET2WT (JAK2V617F), and JAK2V617F–TET2trap/trap (double-mutant) (Table 1). B6 mice congenic for the CD45.1 locus (B6-CD45.1) were purchased as recipients (Sankyo Laboratory Service, Tsukuba, Japan). Animal studies were performed in accordance with the local University of Miyazaki Ethics Committee.
Table 1.
Four experimental groups defined by the JAK2-and-TET2 mutation status of the experimental tissues or cells.
| Annotation | JAK2 status | TET2 status |
|---|---|---|
| WT | JAK2WT | TET2WT |
| TET2KD | JAK2WT | TET2trap/trap |
| JAK2V617F | JAK2V617F | TET2WT |
| Double-mutant | JAK2V617F | TET2trap/trap |
Generation of mouse models of MPNs
We non-competitively transplanted 1 × 10⁶ of 4 experimental groups of E14.5 FLs (WT, TET2KD, JAK2V617F, double-mutant) into lethally irradiated B6-CD45.1 mice [9]. Compared with the recipients transplanted with WT cells, the recipients of TET2KD cells showed normal blood cell count, no splenomegaly, comparable overall survival duration, and minimal extramedullary hematopoiesis of the lung and liver, indicating that TET2KD cells developed only a subtle clinical phenotype as MPNs. Recipients of JAK2V617F cells showed leukocytosis, anemia, thrombocytosis, splenomegaly, shorter survival duration, moderate extramedullary hematopoiesis, and fibrosis in bone marrow (BM) and spleen, indicating that JAK2V617F cells induced clinically primary myelofibrosis (PMF)-like MPNs. Double-mutant cells showed not only the phenotype of JAK2V617F cell recipients, but also prolonged leukocytosis, splenomegaly, and severe extramedullary hematopoiesis, with modestly shorter overall survival. These results indicated that the combination of loss of TET2 and JAK2V617F worsened the disease compared to single-mutant JAK2V617F-induced MPNs.
RNA and cDNA preparation for microarray gene expression analyses
To identify genes regulated by loss of TET2 and/or JAK2V617F, we performed microarray gene expression analyses. For the cell preparation, we sacrificed the 4 experimental groups of recipients at 10–16 weeks post-transplantation, and sorted Lineage−Sca-1+c-Kit+ cells (LSKs) from the BM of the recipients by FACSAriaII (BD Biosciences, San Jose, USA). WT-LSKs (n = 1), TET2KD–LSKs (n = 1), JAK2V617F–LSKs (n = 1), and double-mutant-LSKs (n = 1) were each pooled from 5 mice (Table 1), and preserved in TRIzol reagent. RNA samples were isolated from the each pooled 2–6 × 10⁴ BM-LSKs. cDNA samples were prepared from 2–5 ng RNA samples using the Ovation Pico WTA System V2 (NuGEN, San Carlos, CA), according to the manufacturer's instructions. The NuGEN Ovation amplification methodology uses an isothermal linear amplification using DNA/RNA chimeric primers.
cDNA labeling and hybridization
Two μg of purified and amplified cDNA was used as input into the Agilent Genomic DNA Enzymatic Labeling Kit (Agilent Technologies, Palo Alto, CA), according to the manufacturer's instructions. The Cy3-labeled cDNA was quantified and dye incorporation determined by Nanodrop ND-1000 Spectrophotometer (Thermo Fisher Scientific, Waltham, MA). For each hybridization, 1.65 μg of Cy3-labeled cDNA was hybridized at 65 °C for 17 h to an Agilent Mouse GE 8x60K Microarray (Agilent, Design ID: 028005). After washing, microarrays were scanned using an Agilent DNA microarray scanner (Agilent).
Microarray study design
Using the 4 experimental groups of prepared cDNA samples (each, n = 1), microarray gene expression analyses were performed. Each gene expression profile of TET2KD–LSKs, JAK2V617F–LSKs and double-mutant-LSKs was compared to that of WT-LSKs; and a gene expression profile of double-mutant-LSKs was compared to that of JAK2V617F–LSKs.
RNA and cDNA quality control analyses
RNA and cDNA qualities were assessed by Nanodrop ND-1000 Spectrophotometer (Thermo Fisher Scientific) and by the 2100 Bioanalyser (Agilent). All isolated RNA samples showed appropriate A260/A280 ratios ranging between 1.56 and 1.72, but small peaks for 18 s and 28 s ribosomal RNA subunits and low RNA integrity numbers (RIN) ranging between 2.7 and 5.4 in their electropherograms, probably because of their small amounts or degradation; suggesting their insufficient qualities for the regular microarray protocol without amplification (Fig. 1 left column). However, according to the manufacturer's instructions, the NuGEN Ovation Pico WTA System V2 enables RNA samples with RIN still around 2.0 to amplify successfully and reproducibly; therefore we performed following RNA amplification and cDNA synthesis. All amplified cDNA samples showed A260/A280 ratios ranging between 1.92 and 1.96, A260/A230 ratio between 2.30 and 2.36, and typical plots between 200 and 2000 kb; indicating their sufficient qualities for the microarray protocol with amplification (Fig. 1 right column). Finally, all Cy3-labeled cDNA samples showed A260/A280 ratios ranging between 1.79 and 1.84, and dye incorporation rates ranging between 32.1 and 35.1.
Fig. 1.

Quality control assays of RNA samples (left column) and amplified cDNA samples (right column).
Bioanalyser outputs were shown for each sample. FU, fluorescence units; nt, nucleotide. RNA integrity numbers (RIN) were displayed beside each RNA plot. All amplified cDNA samples showed typical plots between 200 and 2000 kb, indicating their sufficient qualities for microarray analysis.
Microarray quality control analyses
In each 4 experimental group of hybridization, the grid placements were adequate (Fig. 2A). Obvious biases in the distributions of outlier probes were not seen, and the frequencies of non-uniform features were sufficiently low (< 1%) (Fig. 2B).
Fig. 2.

Quality control assays of hybridizations. (A) Adequate grid placements in each 4 experimental groups of hybridizations. (B) Absence of obvious biases in the distributions of outlier probes and sufficiently low frequencies (< 1%) of non-uniform features in each 4 experimental groups of hybridizations.
Data normalization
There are total of 55,681 probes on Agilent Mouse GE 8x60K Microarray (Design ID: 028005) without control probes, and intensity values of each scanned feature were quantified using Agilent Feature Extraction software version 10.7.3.1, which performs background subtractions. Normalization was performed using Agilent GeneSpring GX version 12.6.1. (per chip: normalization to 75 percentile shift).
Data analysis (cluster analysis)
Dendrogram was constructed from unsupervised hierarchical clustering of data sets from 4 experimental groups of BM-LSKs using Pearson correlation. There were close similarities in the whole-genome expression profiles between JAK2V617F–LSKs and double-mutant-LSKs (Fig. 3).
Fig. 3.
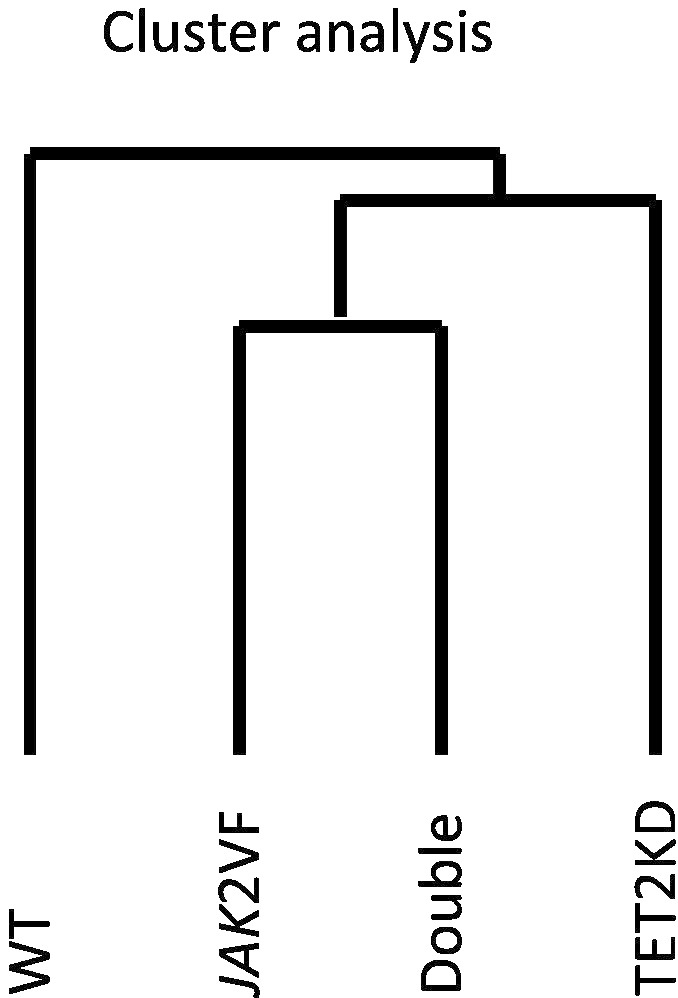
Clustering analysis of data sets from 4 experimental groups of BM-LSKs.
Dendrogram constructed from unsupervised hierarchical clustering using Pearson correlation. There were close similarities in the whole-genome expression profiles between JAK2V617F–LSKs and double-mutant-LSKs.
Data analysis (gene set enrichment analysis (GSEA))
Gene set enrichment analysis (GSEA) [12] was performed across the complete list of genes ranked by signal-to-noise ratio according to their differential expression. A normalized enrichment score (NES) was assigned to each gene set and the statistical significance of its enrichment was measured by FDR q-value. Consistent with the finding from cluster analysis, GSEA showed positive enrichment of the STAT5A target genes [13] and pre-erythroid colony-forming unit signature genes [14] in both JAK2V617F–LSKs and double-mutant LSKs, but not in TET2KD–LSKs; suggesting that JAK2V617F expression induced a progenitor phenotype in LSKs (Fig. 4A, B). Although there was no significant enrichment of the HSC fingerprint genes [10] in TET2KD–LSKs, it was negatively enriched in JAK2V617F–LSKs. Double-mutant-LSKs showed the same tendency as JAK2V617F–LSKs in terms of their HSC fingerprint genes, but the expression of individual genes differed between the two groups (Fig. 4C, D). Among 245 HSC fingerprint genes, 100 (41%) genes were highly expressed in double-mutant LSKs, compared to in JAK2V617F–LSKs; and 37 (15%), 16 (6.5%), 6 (2.4%) and 2 (0.8%) genes showed more than 1.0 log2 fold change (log2FC) (2 FC), 2.0 log2FC (4 FC), 3.0 log2FC (8 FC) and 5.0 log2FC (32 FC), respectively (Table 2, Fig. 5).
Fig. 4.

Gene set enrichment analysis (GSEA) between the expression profiles of different LSKs (WT vs. TET2KD, JAK2V617F, or double-mutant; JAK2V617F vs. double-mutant).
(A) Positive enrichment of the STAT5A target genes both in JAK2V617F–LSKs and in double-mutant-LSKs. (B) Positive enrichment of the pre-erythroid colony-forming unit signature genes both in JAK2V617F–LSKs and in double-mutant-LSKs. (C) Equivalent enrichment of the HSC fingerprint genes in TET2KD–LSKs, and negative enrichment both in JAK2V617F–LSKs and in double-mutant-LSKs. (D) Equivalent enrichment of the HSC fingerprint genes between double-mutant-LSKs and JAK2V617F–LSKs. The normalized enrichment score (NES) from the overall gene expression profiles of LSKs and the false discovery rate q-value are indicated.
Table 2.
HSC fingerprint genes expressed more highly in double mutant-LSKs than in JAK2V617F–LSKs.
For each HSC fingerprint gene, Agilent probe ID, RefSeq ID, normalized expression values (log2) in each mutant LSKs and the value of the log2 fold change (log2FC) (Double mutant vs. JAK2V617F) are shown. HSC fingerprint genes are arranged in descending order of the value of the log2FC.
| Probe ID | RefSeq ID | Gene symbol | WT | TET2KD | JAK2 V617F | Double-mutant | log2FC (double mutant vs. JAK2V617F) |
|---|---|---|---|---|---|---|---|
| A_55_P2174935 | NM_001081235 | MN1 | 0.230 | − 0.936 | − 5.367 | − 0.130 | 5.237 |
| A_51_P469480 | NM_009535 | YES1 | − 4.917 | − 4.721 | − 4.618 | 0.502 | 5.120 |
| A_55_P2078710 | NM_029413 | MORC4 | 2.775 | 0.403 | − 4.103 | − 0.382 | 3.721 |
| A_52_P17098 | NM_001161620 | MPP7 | − 2.307 | − 1.290 | − 2.043 | 1.666 | 3.709 |
| A_51_P384148 | NM_013649 | RYK | − 5.134 | − 4.928 | − 5.348 | − 1.843 | 3.505 |
| A_55_P2121985 | NM_013829 | PLCB4 | − 0.339 | − 0.537 | − 1.038 | 2.245 | 3.283 |
| A_65_P16750 | NM_001163609 | PSMA8 | − 4.958 | − 4.351 | − 4.187 | − 1.193 | 2.994 |
| A_51_P501803 | NM_010451 | HOXA2 | − 3.562 | − 2.678 | − 5.015 | − 2.069 | 2.946 |
| A_51_P258409 | NM_010423 | HEY1 | − 4.939 | − 1.361 | − 4.175 | − 1.249 | 2.926 |
| A_52_P121342 | NM_020252 | NRXN1 | 0.839 | 1.021 | − 2.792 | 0.010 | 2.802 |
| A_55_P2129271 | NM_001285498 | TEAD2 | − 3.023 | − 1.465 | − 3.308 | − 0.683 | 2.625 |
| A_55_P1955457 | NM_010345 | GRB10 | − 1.329 | − 1.564 | − 3.263 | − 0.660 | 2.603 |
| A_51_P293781 | NM_016863 | FKBP1B | − 4.324 | − 1.063 | − 3.222 | − 0.629 | 2.593 |
| A_55_P2066463 | NM_010135 | ENAH | − 5.220 | − 5.021 | − 4.031 | − 1.655 | 2.376 |
| A_52_P162486 | NM_007542 | BGN | 0.864 | 1.299 | − 5.224 | − 2.941 | 2.283 |
| A_55_P1966644 | NM_013838 | TRPC6 | 0.286 | − 1.267 | − 3.580 | − 1.300 | 2.280 |
| A_51_P462102 | NM_133911 | GPR125 | − 4.796 | − 2.431 | − 2.045 | − 0.073 | 1.972 |
| A_66_P136228 | NM_030690 | RAI14 | − 1.642 | 1.334 | − 5.468 | − 3.539 | 1.929 |
| A_66_P134991 | NM_028360 | TTC19 | − 3.783 | 0.111 | − 1.617 | 0.297 | 1.914 |
| A_55_P1981155 | NM_153537 | PHLDB1 | − 3.791 | − 2.611 | − 5.050 | − 3.227 | 1.822 |
| A_55_P2262136 | NM_013690 | TEK | − 1.750 | − 2.354 | − 5.453 | − 3.726 | 1.727 |
| A_55_P2154659 | NM_023651 | PEX13 | − 4.951 | − 4.765 | − 1.839 | − 0.187 | 1.652 |
| A_51_P258493 | NM_011067 | PER3 | − 5.172 | − 2.979 | − 4.253 | − 2.680 | 1.573 |
| A_66_P114381 | NM_001005341 | YPEL2 | 0.865 | 2.139 | − 2.649 | − 1.103 | 1.547 |
| A_55_P2163319 | NM_008817 | PEG3 | − 5.166 | − 4.958 | − 5.380 | − 3.871 | 1.510 |
| A_55_P2036026 | NM_028783 | ROBO4 | 0.744 | 0.297 | − 1.038 | 0.469 | 1.506 |
| A_55_P2137887 | NM_010820 | MPDZ | − 5.192 | − 5.020 | − 5.454 | − 3.969 | 1.485 |
| A_55_P2000758 | NM_019832 | GKAP1 | 0.273 | 0.416 | − 1.831 | − 0.398 | 1.433 |
| A_51_P350453 | NM_013743 | PDK4 | − 3.333 | − 4.200 | − 5.482 | − 4.071 | 1.410 |
| A_51_P463003 | NM_021367 | TSLP | − 2.800 | − 4.719 | − 3.351 | − 2.000 | 1.351 |
| A_55_P1968362 | NM_011599 | TLE1 | 0.466 | 1.850 | − 0.451 | 0.865 | 1.316 |
| A_55_P2038056 | NM_080285 | CTTNBP2 | − 4.706 | − 4.534 | − 5.502 | − 4.272 | 1.230 |
| A_51_P361220 | NM_008055 | FZD4 | − 2.366 | − 1.957 | − 4.903 | − 3.674 | 1.229 |
| A_51_P249930 | NM_146236 | TCEAL1 | − 5.003 | − 3.211 | − 3.418 | − 2.247 | 1.171 |
| A_52_P20048 | NM_011544 | TCF12 | 0.393 | − 1.130 | − 1.777 | − 0.661 | 1.116 |
| A_55_P2092859 | NM_013471 | ANXA4 | 2.783 | 1.534 | − 0.644 | 0.459 | 1.103 |
| A_55_P2109559 | NM_001013616 | TRIM6 | − 2.055 | − 3.687 | − 3.141 | − 2.101 | 1.041 |
Fig. 5.

Venn diagram illustrating the numbers and frequencies of highly expressed HSC fingerprint genes in double-mutant-LSKs than in JAK2V617F–LSKs.
Within the 245 HSC fingerprint genes, 100 (41%), 37 (15%), 16 (6.5%), 6 (2.4%) and 2 (0.8%) genes were highly expressed more than 0 log2FC (1 FC), 1.0 log2FC (2 FC), 2.0 log2FC (4 FC), 3.0 log2FC (8 FC) and 5.0 log2FC (32 FC), respectively.
Discussion
We present here a unique data set of mouse models of MPNs. This dataset is measured by Agilent platform and composed of gene expression profiles of normal and mutant LSKs (WT, JAK2V617F, TET2KD, double-mutant) (Table 1). JAK2V617F-induced HSC impairments were identified in several mouse models of MPNs including ours [9], [15], [16]. In our model, though single-mutant JAK2V617F-cells could initiate and promote MPNs during a short-term, they showed reduced self-renewal capacity in vitro and reduced long-term oncogenic capacity in vivo [9]. However, the double-mutant cells showed increased self-renewal capacity and could initiate and promote MPNs over the long-term [9], indicating that JAK2V617F-induced HSC impairments were restored by combined loss of TET2. Also in human, those impairments were identified in JAK2V617F–HSCs [17], and combined loss of TET2 seemed to restore the JAK2V617F-induced HSC impairments and expand the HSC compartment by altering transcriptional programs [17], [18]. Therefore, we tried to uncover the restoration mechanisms by using a gene-profiling approach in mouse models. Here, we showed that many HSC fingerprint genes were down-regulated in JAK2V617F–LSKs, but the expressions of significant number of them were restored in double-mutant-LSKs (Table 2, Fig. 5), though we could not see statistically significant restoration of the profile (Fig. 4D). These expressional changes might partly explain the mechanisms of initiation and progression of MPNs. In spite of our and other studies [9], [18], [19], the precise mechanisms by which loss of TET2 restores the JAK2V617F-induced HSC impairments still remain poorly known, further wet and dry investigations are necessary to uncover them more precisely.
Conflict of interest
The authors declare no competing financial interests.
Funding
This work was supported in part by Grants-in-Aid for Scientific Research (grants 24641408, 24591401, and 26860738) from the Ministry of Education, Science, Sports, and Culture in Japan.
Acknowledgment
The authors thank M. Matsushita, T. Shinmori, E. Torii, and S. Saito for their technical assistance; and Professor N. Arima and M. Hachiman at Kagoshima University for cell sorting assistance.
References
- 1.Klampfl T., Gisslinger H., Harutyunyan A.S. Somatic mutations of calreticulin in myeloproliferative neoplasms. N. Engl. J. Med. 2013;369(25):2379–2390. doi: 10.1056/NEJMoa1311347. [DOI] [PubMed] [Google Scholar]
- 2.Nangalia J., Massie C.E., Baxter E.J. Somatic CALR mutations in myeloproliferative neoplasms with nonmutated JAK2. N. Engl. J. Med. 2013;369(25):2391–2405. doi: 10.1056/NEJMoa1312542. [DOI] [PMC free article] [PubMed] [Google Scholar]
- 3.Nangalia J., Green T.R. The evolving genomic landscape of myeloproliferative neoplasms. Hematol. Am. Soc. Hematol. Educ. Program. 2014;2014(1):287–296. doi: 10.1182/asheducation-2014.1.287. [DOI] [PubMed] [Google Scholar]
- 4.Moran-Crusio K., Reavie L., Shih A. Tet2 loss leads to increased hematopoietic stem cell self-renewal and myeloid transformation. Cancer Cell. 2011;20(1):11–24. doi: 10.1016/j.ccr.2011.06.001. [DOI] [PMC free article] [PubMed] [Google Scholar]
- 5.Shide K., Kameda T., Shimoda H. TET2 is essential for survival and hematopoietic stem cell homeostasis. Leukemia. 2012;26(10):2216–2223. doi: 10.1038/leu.2012.94. [DOI] [PubMed] [Google Scholar]
- 6.Challen G.A., Sun D., Jeong M. Dnmt3a is essential for hematopoietic stem cell differentiation. Nat. Genet. 2012;44(1):23–31. doi: 10.1038/ng.1009. [DOI] [PMC free article] [PubMed] [Google Scholar]
- 7.Khan S.N., Jankowska A.M., Mahfouz R. Multiple mechanisms deregulate EZH2 and histone H3 lysine 27 epigenetic changes in myeloid malignancies. Leukemia. 2013;27(6):1301–1309. doi: 10.1038/leu.2013.80. [DOI] [PubMed] [Google Scholar]
- 8.Sasaki M., Knobbe C.B., Munger J.C. IDH1(R132H) mutation increases murine haematopoietic progenitors and alters epigenetics. Nature. 2012;488(7413):656–659. doi: 10.1038/nature11323. [DOI] [PMC free article] [PubMed] [Google Scholar]
- 9.Kameda T., Shide K., Yamaji T. Loss of TET2 has dual roles in murine myeloproliferative neoplasms: disease sustainer and disease accelerator. Blood. 2015;125(2):304–315. doi: 10.1182/blood-2014-04-555508. [DOI] [PubMed] [Google Scholar]
- 10.Chambers S.M., Boles N.C., Lin K.Y. Hematopoietic fingerprints: an expression database of stem cells and their progeny. Cell Stem Cell. 2007;1(5):578–591. doi: 10.1016/j.stem.2007.10.003. [DOI] [PMC free article] [PubMed] [Google Scholar]
- 11.Shide K., Shimoda H.K., Kumano T. Development of ET, primary myelofibrosis and PV in mice expressing JAK2 V617F. Leukemia. 2008;22(1):87–95. doi: 10.1038/sj.leu.2405043. [DOI] [PubMed] [Google Scholar]
- 12.Subramanian A., Tamayo P., Mootha V.K. Gene set enrichment analysis: a knowledge-based approach for interpreting genome-wide expression profiles. Proc. Natl. Acad. Sci. U. S. A. 2005;102(43):15545–15550. doi: 10.1073/pnas.0506580102. [DOI] [PMC free article] [PubMed] [Google Scholar]
- 13.Wierenga A.T., Vellenga E., Schuringa J.J. Maximal STAT5-induced proliferation and self-renewal at intermediate STAT5 activity levels. Mol. Cell. Biol. 2008;28(21):6668–6680. doi: 10.1128/MCB.01025-08. [DOI] [PMC free article] [PubMed] [Google Scholar]
- 14.Pronk C.J., Rossi D.J., Mansson R. Elucidation of the phenotypic, functional, and molecular topography of a myeloerythroid progenitor cell hierarchy. Cell Stem Cell. 2007;1(4):428–442. doi: 10.1016/j.stem.2007.07.005. [DOI] [PubMed] [Google Scholar]
- 15.Li J., Spensberger D., Ahn J.S. JAK2 V617F impairs hematopoietic stem cell function in a conditional knock-in mouse model of JAK2 V617F-positive essential thrombocythemia. Blood. 2010;116(9):1528–1538. doi: 10.1182/blood-2009-12-259747. [DOI] [PMC free article] [PubMed] [Google Scholar]
- 16.Mullally A., Bruedigam C., Poveromo L. Depletion of Jak2V617F myeloproliferative neoplasm-propagating stem cells by interferon-alpha in a murine model of polycythemia vera. Blood. 2013;121(18):3692–3702. doi: 10.1182/blood-2012-05-432989. [DOI] [PMC free article] [PubMed] [Google Scholar]
- 17.Delhommeau F., Dupont S., Valle V.D. Mutation in TET2 in myeloid cancers. N. Engl. J. Med. 2009;360(22):2289–2301. doi: 10.1056/NEJMoa0810069. [DOI] [PubMed] [Google Scholar]
- 18.Ortmann C.A., Kent D.G., Nangalia J. Effect of mutation order on myeloproliferative neoplasms. N. Engl. J. Med. 2015;372(7):601–612. doi: 10.1056/NEJMoa1412098. [DOI] [PMC free article] [PubMed] [Google Scholar]
- 19.Chen E., Schneider R.K., Breyfogle L.J. Distinct effects of concomitant Jak2V617F expression and Tet2 loss in mice promote disease progression in myeloproliferative neoplasms. Blood. 2015;125(2):327–335. doi: 10.1182/blood-2014-04-567024. [DOI] [PMC free article] [PubMed] [Google Scholar]